INTRODUCTION
The improvement of populations through recurrent selection is a common procedure in breeding programs de-signed to develop hybrids from inbred lines in maize and other allogamous species. Several recurrent selection meth-ods have been reported (Hallauer et al., 1988), and formu-las for the expected response to selection for each method have been derived. These expressions are linear functions of the intensity of selection and of the additive genetic vari-ance, and are inverse functions of the phenotypic variance (Empig et al., 1972; Cockerham and Matzinger, 1985).
Genetic drift is expected to occur in recurrent selec-tion irrespective of the method, because of the small num-ber of selected progenies recombined to give rise to the improved populations. Furthermore, to increase the genetic gain and to lower the genetic load of the populations, in-bred progenies have been used for recombination. These factors lead to a decrease in the effective size of the popu-lation under selection in which genetic drift is likely to take place, as has been reported for maize populations (Smith, 1979a,b, 1983; Helms et al., 1989; Eyherabide and Hallauer, 1991; Keeratinijakal and Lamkey, 1993). Ex-pected and observed responses to intrapopulation selec-tion usually show large discrepancies (Burton et al., 1971; Penny and Eberhart, 1971; Crossa and Gardner, 1989; Arriel et al., 1993). A possible reason for these discrepancies may be that the expressions of the expected responses to se-lection have been derived for a random mating population under the assumption of infinite population size (Kemp-thorne, 1957; Falconer and Mackay, 1996). The objective
of this study was to derive a general expression for the ex-pected response to intrapopulation selection by taking into account the effects of finite population size and present experimental results for a maize population.
MATERIAL AND METHODS
Genetic model
Consider a random mating population in both Hardy-Weinberg and linkage equilibrium under intrapopulation recurrent selection. Let p0 and q0 be the frequencies of the
favorable (B) and unfavorable (b) alleles, and a and d be half the difference of the homozygous effects and the domi-nance effects, respectively (Falconer and Mackay, 1996). After one cycle of recurrent selection the frequencies of B and balleles will be p1 and q1, respectively. The changes
in these frequencies are functions of both selection (∆p) and drift (δp). Then, ε(p1) = ε(p0 + ∆p + δp), and ε(q1) =
ε(q0 - ∆p - δp), where ε(∆p) = icp0q0α/σPh (Empig et al.,
1972), and ε(δp) = ε(p0δp) = ε(q0δp) = ε(∆pδp) = 0, and
ε(δp)2 = p
0q0/2Ne (Falconer and Mackay, 1996). In these
expressions i is the standardized selection differential, c is the parental control, σPh is the phenotypic standard
de-viation, Ne is the effective size of the population, α = a +
(q0-p0)d is the average effect of gene substitution and ε
de-notes expectation. We also assumed that changes in gene frequencies through recurrent selection are small, so one could assume that ε(∆p)2≅ 0, and this term will therefore
be neglected in the following derivations.
Following the genetic model, the mean of the
origi-Response to recurrent selection under small effective population size
Cláudio Lopes de Souza Jr., Isaias Olívio Geraldi and Roland Vencovsky
Abstract
A formula was derived for the prediction of the response to recurrent selection when the effective population size (Ne) is small. Usually, responses to selection have been estimated by Rs = icσ2
A/σPh, where i, c, σ2A, and σPh stand for standardized selection differential, parental control, additive variance, and phenotypic standard deviation, respectively. This expression, however, was derived under the assumption of infinite population size. By introducing the effects of finite population size, the expression derived was Rs = [ic(σ2
A + ∆FD1)/σPh] - ∆FID, where ∆F, ID and D1 are the changes in the inbreeding coefficient, the inbreeding depression, and the covariance of additive and homozy-gous dominance effects, respectively. Thus, the predicted responses to selection based on these expressions will be smaller than those based on the standard procedures for traits with a high level of dominance such as yield. Responses to five cycles of half-sib selection were predicted for maize by both expressions, considering that 100 progenies were evaluated and 10 S1 progenies were recombined, which corresponds to Ne = 10 for each cycle. The accumulated response to selection estimated with the new expression was about 47 and 28% smaller than that based on the standard expression for yield and plant height, respectively. Thus, the expression usually used overestimates the responses to selection, which is in agreement with reported results, because it does not take into account the effective population size that is generally small in recurrent selection programs.
nal (unselected) population for one locus is u0 = u + (p0
-q0)a + 2p0q0d and the mean of the population after one cycle
of selection is u1 = u + (p1 - q1)a + 2p1q1d. Now,
substitut-ing p1 and q1 in u1 by their expectations and after algebraic
manipulations we will have u1 as a function of the original
mean, the changes due to selection and drift. Then, the ex-pected response to selection was derived from the con-trast Rs = u1 - u0.
Inbreeding depression (ID) is usually estimated by the expression: ID = 2(uS0 - uS1), where uS0 is the mean of the
original population (u0) and uS1 is the mean of this
popula-tion after one generapopula-tion of selfing, i.e., uS1 = u + (p0 - q0)a
+ p0q0d. Then, inbreeding depression is ID = 2p0q0d. The
inbreeding coefficient (Ft) as a function of the effective
population size in the tth
generation is Ft = (1/2Ne) + [1
-(1/2Ne)]Ft-1, where Ft and Ft-1 are the inbreeding coefficients
in the tth
and (t-1)th
generations, respectively. Then, the in-breeding depression due to the small population size is estimable by ∆FID for each cycle of selection, where ∆F is the change in the inbreeding coefficient (Falconer and Mackay, 1996).
Experimental procedures
Experimental data from ESALQ-PB1, an open-polli-nated maize population, were used for illustration. One hundred pairs of S1 and half-sib progenies were obtained in
two-ear plants in a lower plant density field (25,000 plants/ ha) by selfing the lower ears and crossing the upper ears with a pollen mixture from 50 random plants. These pairs of progenies were evaluated in a randomized complete block design, with the half-sib and S1 progenies in a
split-block arrangement to avoid competition due to inbreeding depression. Each sub-plot was one row 4.0 m long with 1.0 m between rows, with 20 plants per sub-plot after thinning (50,000 plants/ha). The experiments were carried out at two locations in Piracicaba (SP) and one location in Uberlândia (MG), with three replications per location. Data on yield as the mean of unhusked ear weight, and on plant height as the mean of five competitive plants per sub-plot were recorded.
Analysis of variance was performed according to the experimental design. Subsequently, analyses of variance were computed for each progeny type for each environ-ment, and then combined across environments. Inbreeding depression was estimated as ID = 2(S0 - S1) and ID% as
(ID/S0)100, which corresponds to the expected total
inbre-eding depression, i.e., ID = S0 - S∞. In these expressions S0
and S1 refer to the general means of half-sibs and S1
prog-enies, respectively (Table I). From the half-sib analysis, estimates of genetic and phenotypic parameters were ob-tained as follows: additive variance: σ2
A = 4(Mp - Me)/RL;
phenotypic variance among progeny means: σ2
Ph = Mp/RL;
and heritability (h2
%) = (σ2A/4σ2Ph)100, where Mp and Me
stand for progeny and error mean squares, and R and L are the number of replications and of locations, respectively.
The covariance of additive and homozygous dominance effects was estimated as D1 = 4[CovG(HS,S1) - (1/2) σ
2 A],
where CovG(HS,S1) is the genetic covariance of half-sib
and S1 progenies (Table II). For estimation of the expected
response to selection, an intrapopulation half-sib selection was considered, where half-sib progenies and S1 progenies
are the selection and recombination units, respectively. Since the effective size of an S1 progeny is 1, the different
effective population sizes considered in this paper refer to the number of recombined S1 progenies.
RESULTS AND DISCUSSION
Theoretical response to selection
The expected mean value of a population following one cycle of selection is:
u1 = u + (p1 - q1)a + 2p1q1d,
and substituting p1 and q1 by their expectations, we have:
u1 = u + [(p0 + ∆p + δp) - (q0 - ∆p - δp)]a +
+ 2(p0 + ∆p + δp)(q0 - ∆p - δp)d,
and after algebraic manipulations, the expected mean of a population after one cycle of selection can be expressed as:
u1 = u0 + 2∆pα - 2(δp)2d.
For a random sample from a base population, ε(δp)2
= p0q0/2Ne (Falconer and Mackay, 1996). However, to
ac-Table I - Mean values of grain yield (Y) and plant height (PH) for ESALQ-PB1 maize population in the S0 and S1 generations, inbreeding
depression (ID), and coefficient of experimental variation (CV%). Generation Y (g/plant) PH (cm/plant)
S0 201.88 ± 8.42 213.31 ± 5.54
S1 118.91 ± 9.37 156.16 ± 6.82
ID 165.94 ± 15.2 114.30 ± 10.4
ID% 82.2 53.6
CV% (S0) 10.5 4.6
CV% (S1) 16.9 6.3
Table II - Estimates of additive variance (σ2A), phenotypic variance (σ2Ph), D1, and heritability (h2%) from maize half-sib
progenies, for yield (Y) and plant height (PH). Parameters Y(g/plant) PH (cm/plant)
σ2
A 197.41 ± 67.91 184.39 ± 42.48
σ2
Ph 111.63 ± 15.79 70.88 ± 10.02 D1 - 50.32 ± 19.39 - 34.72 ± 11.30 h2
% 44.21 ± 15.21 65.04 ± 14.98
commodate the situation in which changes in gene frequency occur both due to selection and drift, the set of selected genotypes was considered as the reference population for measuring the effect of sampling on allelic frequencies. Taking p’0 = p0 + ∆p as the gene frequency in this set then
ε(δp’)2 = p’
0 q’0/2Ne. Then, for the selected sample we have:
ε(δp’)2 = p’
0 q’0 /2Ne = (p0 + ∆p)(q0 - ∆p)/2Ne, and
ε(δp’)2 = [p
0q0 + ∆p(q0 - p0)]/2Ne.
Now, including ε(∆p) in this expression leads to:
ε(δp’)2 = [(p
0q0/2Ne) + icp0q0(q0 - p0)α/2NeσPh].
Then, substituting ε(∆p) and ε(δp’)2 in u
1 we have:
u1 = u0 + (ic2p0q0α 2/σ
Ph) - [2p0q0d/2Ne +
+ ic2p0q0(q0 - p0)αd/2NeσPh],
with σ2
A = 2p0q0α 2, D
1 = - 2p0q0(q0 - p0)αd and ID = 2p0q0d
as the additive variance, the covariance of additive and ho-mozygous dominance effects, and the inbreeding depres-sion, respectively, we have:
u1 = u0 + [ic(σ 2
A + ∆FD1)/σPh] - ∆FID,
and the expression of the expected response to one cycle of selection (Rs = u1 - u0) taking into account the effective
population size is:
Rs = [ic(σ2
A + ∆FD1)/σPh] - ∆FID,
and the accumulated response after t cycles of selection is:
Rs = [ic(tσ2
A + FtD1)/σPh] - Ft ID [1]
These results were derived for one locus-two alleles model, but the extension for all loci is straightforward by letting σ2
A, D1 and ID be the sum for all loci, as follows:
σ2
A = ∑σ2Ak, D1 = ∑Dk1, and ID = ∑ IDk.
The response to selection (Rs) has usually been esti-mated by using the following expression (Falconer and Mackay, 1996):
Rs = icσ2
A/σPh. [2]
Notice that Equation 2 was derived on the assump-tion of infinite effective populaassump-tion size, whereas Equa-tion 1 took into account the effective populaEqua-tion size as finite. Thus, the expression derived in this study is less bi-ased than Equation 2 because of the small number of prog-enies that has usually been recombined in recurrent selec-tion programs (Smith, 1983). Comparing Equaselec-tion 1 with
2, we note that the difference is a function of the last two terms, i.e., the D1 and ID terms, related to genetic drift
cau-sed by small population size.
For most of the traits the term -FtID will reduce Rs,
because it represents the decrease in the heterozygosity of the selected population. However, D1, as a covariance, may
be either negative or positive (Cockerham, 1984), and then could reduce or increase Rs. The effects of genetic drift increase as selection cycles proceed. Then, Ne should be
maintained at a level such that this effect could be reduced, and, therefore, the response to selection could be main-tained as high as possible.
It is important to note that genetic drift may also lead to the fixation of undesirable alleles. Even without domi-nance (d = 0), i.e., no inbreeding depression (ID = 0) and D1 = 0, genetic drift may reduce the response to selection
(Robertson, 1960).
It should be emphasized that genetic drift is affected by selection, because (δp’)2 = (δp)2[1 + ic(q
0 - p0)α/σPh]
for the selected sample, which results from the genetic drift of a random sample (δp)2 plus the effects of selection on
it. The second term is a function of the selection intensity (i), the selection procedure used (c), and the allele fre-quencies (p0 and q0). Note that this term may be either
posi-tive or negaposi-tive, because it depends on the differences be-tween the allele frequencies of the same locus. Then, if this term is positive, (δp’)2> (δp)2, and vice-versa.
The effective population size (Ne) is also affected by a long-term selection, because as selection proceeds the individuals of the population under selection become genetically related, and, consequently, the inbreeding co-efficient (Ft) and the rate of inbreeding (∆F) increases
(Wray and Thompson, 1990; Wray et al., 1994). Therefore, for a long-term selection, the increase in Ft and in ∆F should
be added to the formula derived in this paper; otherwise the response to selection would be overestimated.
Wei et al. (1996) derived a formula to predict re-sponse to selection in finite populations by jointly consid-ering the effects of genetic drift, linkage disequilibrium, inbreeding depression, and mutational variance. However, they did not consider the effects of selection on genetic drift and, consequently, the component D1. Nonetheless,
their results showed that mutational variance and effective population size could affect considerably the response to a long-term selection.
Numerical evaluation
Values of expected responses (Rs) for five cycles of selection were computed from parameter estimates of ESALQ-PB1 maize population for yield and plant height. Although theoretical results have shown that genetic vari-ances change with selection and small population sizes (Nei, 1963; Cockerham, 1984), and that inbreeding depres-sion is also expected to change with selection (Souza Jr., 1985), we considered σ2
A, D1, ID and σPh as constant for all
cycles. We assumed that these restrictions are stringent because experimental results have shown small changes in these parameters following selection (Stucker and Hallauer, 1992; San Vicente and Hallauer, 1993; Schnicker and Lamkey, 1993; Benson and Hallauer, 1994).
Estimates of response to one cycle of selection (Rs%) for yield and plant height were 3.9 and 6.2%, respectively, for finite size (Ne = 10), and 8.1 and 9.0%, respectively,
for infinite Ne. Thus, the decreases in response when finite
population size was taken into account were about 52 and 31% for yield and plant height, respectively. The greater decrease in yield occurred because of the higher level of dominance for this trait, which leads to a greater inbreed-ing depression. Note that these results refer to a half-sib selection scheme, where 10 S1 progenies were used for
recombination. The expected accumulated decrease in yield due to icFtD1/σPh and FtID following five cycles of
selec-tion for several Ne’s (Table III) showed that as Ne decreases
and cycles of selection proceed, the effects of ID and D1,
related to the genetic drift, increase as expected. For ex-ample, at the 5th
selection cycle, the accumulated decrease from Ne = 30 (13.71 g/plant) to Ne = 10 (38.47 g/plant)
increased about 181%. Also, for Ne = 10 the accumulated
decrease from the 1st
(8.51 g/plant) to the 5th
(38.47 g/ plant) cycle of selection increased about 352%. Note that the contributions of D1 and ID to the decrease were
differ-ent, with the FtID component being about 40 times greater
than the icFtD1/σPh component.
Expected responses to selection for yield, consider-ing the intensity of selection (10%) to be constant, and varying the number of progenies evaluated, i.e., varying the effective population size (Figure 1), showed an increase in the response to selection as Ne increased. Nevertheless,
this increment was not linear, increasing sharply up to Ne =
20 and decreasing thereafter. For instance, the response to selection for Ne = 20 was about 42% greater than that for
Ne = 10, whereas the response to selection for Ne = 30
was only 11% greater than that for Ne = 20. Thus, for yield
in maize it seems worthwhile keeping the effective size number at least at 20. Considering the method and the in-tensity of selection used in this example, where S1
prog-enies are used for recombination, the number of progprog-enies to be evaluated should be around 200 to lower the inbreed-ing depression caused by the small population size.
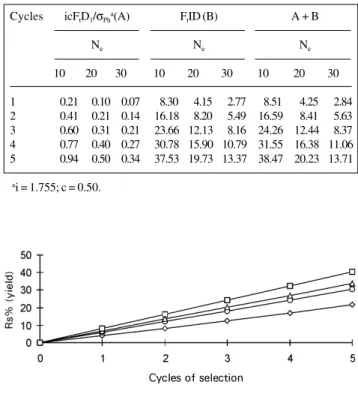
Another situation, where the number of progenies to be evaluated is constant (100) but not the intensity of se-lection, i.e., varying Ne’s from 10 to 30, for yield was also
considered (Figure 2). Results showed that the expected response to selection increased as the intensity of selection increased from 30 to 20%, but decreased thereafter (from 20 to 10%). This occurred because of the decrease in the effective population size that offsets the response to selec-tion as shown in Table III. Despite the small differences in responses to selection, it would be important to maintain effective size as high as possible because genetic variance is expected to become smaller due to small population size.
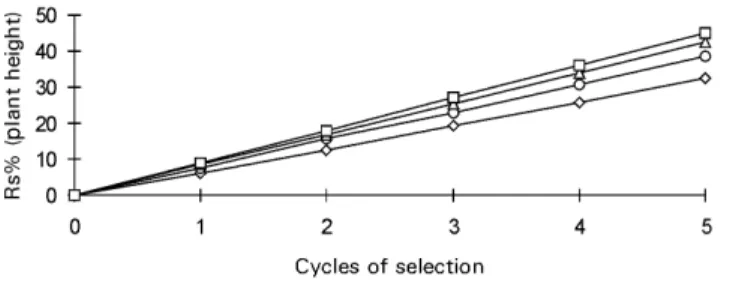
General results for five cycles of selection for plant height, considering constant intensity of selection (10%) but varying effective population size by increasing the number of progenies evaluated (Figure 3), showed the same pattern as for yield (Figure 1), but with smaller dif-ferences among varying Ne’s. The level of dominance for
plant height was lower than that for yield, and, conse-quently, its inbreeding depression was smaller than for yield (Hallauer et al., 1988). Thus, the differences among
Table III - Expected decreases in the response to five cycles of half-sib selection due to icFtD1/σPh (A), FtID (B), and the sum (A + B) for three population sizes (Ne), for maize yield (g/plant) at 10% selection intensity.
Cycles icFtD1/σPha(A) FtID (B) A + B
Ne Ne Ne
10 20 30 10 20 30 10 20 30
1 0.21 0.10 0.07 8.30 4.15 2.77 8.51 4.25 2.84 2 0.41 0.21 0.14 16.18 8.20 5.49 16.59 8.41 5.63 3 0.60 0.31 0.21 23.66 12.13 8.16 24.26 12.44 8.37 4 0.77 0.40 0.27 30.78 15.90 10.79 31.55 16.38 11.06 5 0.94 0.50 0.34 37.53 19.73 13.37 38.47 20.23 13.71
ai = 1.755; c = 0.50.
Figure 2 - Expected responses to five cycles of half-sib selection (Rs%) for maize yield, considering several population sizes and selection intensi-ties, for a constant number of progenies evaluated (100).
Figure 3 - Expected responses to five cycles of half-sib selection (Rs%) for plant height in maize, considering 10% selection intensity and several population sizes.
the responses to selection by varying Ne’s for plant height
were smaller than for yield because of the lower level of dominance of this trait.
Discrepancies between the expected and observed responses to selection can also be explained by sampling errors, precision of estimates, and genotype-environment interaction. Sampling errors could occur during the recom-bination of selected progenies; estimates of genetic and phenotypic variances generally have low precision, and genotype-environment interaction may reduce the response to selection, mainly in atypical years. Also, errors can oc-cur in the expected response by using the standardized selection differential if the progeny means do not fit a normal distribution (Arriel et al., 1993). Recently, the effect of the gametic-phase disequilibrium was reported as another important source of discrepancies (Mackay and Gibson, 1993). Simulation studies by these authors showed reductions attributed to linkage disequilibrium between 16 and 32%, when comparing observed and ex-pected responses to selection.
It was shown in this study that effective population size (Ne) is an important source of discrepancy between
the expected and observed responses to selection, mainly when effective size is very small and the level of domi-nance of the trait is high. We have considered, for the sake of simplicity, only half-sib selection, but deriving expres-sions for other selection schemes are straightforward by letting parental control (c), effective population size (Ne),
and the phenotypic standard deviation (σPh) be those re-lated to the selection scheme considered.
ACKNOWLEDGMENTS
Publication supported by FAPESP.
RESUMO
Foi derivada uma expressão para predizer a resposta à seleção recorrente para tamanhos efetivos populacionais (Ne) pequenos. Usualmente, as respostas à seleção têm sido estimadas utilizando-se da expressão Rs = icσ2A/σPh, onde i, c, σ2A e σPh re-ferem-se ao diferencial de seleção estandardizado, controle
pa-rental, variância genética aditiva e desvio-padrão fenotípico, res-pectivamente. Entretanto, essa expressão foi derivada assumindo que o tamanho efetivo populacional é infinito. Considerando que a população sob seleção é finita, derivou-se uma nova expressão considerando o tamanho efetivo populacional finito: Rs = [ic(σ
2 A +
∆FD1)/ σPh) - ∆FID], onde ∆F, ID, e D1 referem-se às alterações no coeficiente de endogamia, à depressão por endogamia, e à covariância dos efeitos aditivos e de dominância dos homozigotos, respectivamente. Portanto, as respostas esperadas à seleção baseadas nesta expressão serão inferiores àquelas obtidas na expressão padrão, principalmente para caracteres com elevados níveis de dominância como produção de grãos. Foram estimadas as respostas à seleção recorrente com progênies de meios-irmãos para uma população de milho utilizando-se as duas expressões, considerando-se a avaliação de 100 progênies e recombinação de 10 progênies S1’s, o que corresponde a um tamanho efetivo de Ne = 10 para cada ciclo. A resposta à seleção acumulada estimada com a nova expressão foi cerca de 47 e 28% inferior para produção de grãos e altura da planta, respectivamente, que aquela obtida com a expressão usual que não considera o tamanho efetivo populacional. Portanto, a expressão padrão que tem sido utilizada superestima as respostas à seleção recorrente, como tem sido reportado na literatura, por não considerar o tamanho efetivo populacional normalmente baixo nestes tipos de programas.
REFERENCES
Arriel, E.F., Ramalho, M.A.P. and Pacheco, C.A.P. (1993). Expected and realized gains in the CMS-39 maize population after three cycles of half-sib family selection. Rev.Bras.Genet. 16: 1013-1018.
Benson, D.L. and Hallauer, A.R. (1994). Inbreeding depression rates in maize populations before and after recurrent selection. J. Hered. 85: 122-128.
Burton, J.W., Penny, L.H., Hallauer, A.R. and Eberhart, S.A. (1971). Evalu-ation of synthetic populEvalu-ation developed from a maize variety (BSR) by two methods of recurrent selection. Crop Sci. 11: 361-365.
Cockerham, C.C. (1984). Covariances of relatives for quantitative characteres with drift. In: Human Population Genetics: The Pitts-burgh Symposium (Chakravati, A., ed.). Van Nostrand Reinhold Co., New York, pp. 195-208.
Cockerham, C.C. and Matzinger, D.F. (1985). Selection response based on selfed progenies. Crop Sci. 25: 483-488.
Crossa, J. and Gardner, C.O. (1989). Predicted and realized grain yield responses to full-sib family selection in Cimmyt maize populations.
Theor. Appl. Genet. 77: 33-38.
Empig, L.T., Gardner, C.O. and Compton, W.A. (1972). Theoretical Gains for DifferentPopulation Improvement Procedures. (M.P. 26). Univer-sity of Nebraska, Nebraska.
Eyherabide, G.H. and Hallauer, A.R. (1991). Reciprocal full-sib selection in maize. II: Contributions of additive, dominance and genetic drift ef-fects. Crop Sci. 31: 1442-1448.
Falconer, D.S. and Mackay, T.F. (1996). Introduction to Quantitative Ge-netics. 4th edn. Longman Scientific & Technical, New York.
Hallauer, A.R., Russell, W.A. and Lamkey, K.R. (1988). Corn breeding. In:
Corn and Corn Improvement (Dudley, J.W. and Sprague, G.F., eds.). 3rd edn. ASA, CSSA, ASSSA, Madison, pp. 463-564.
Helms, T.C., Hallauer, A.R. and Smith, O.S. (1989). Genetic drift and se-lection evaluated from recurrent sese-lection programs in maize. Crop Sci. 29: 602-607.
Keeratinijakal, V. and Lamkey, K.R. (1993). Genetic effects associated with reciprocal recurrent selection in BSSS and BSCB1 maize popula-tions. Crop Sci. 33: 78-82.
Kempthorne, O. (1957). An Introduction to Genetic Statistics. John Wiley & Sons, Inc., New York.
Mackay, I.J. and Gibson, J.P. (1993). The effect of gametic-phase disequi-librium on the prediction of response to recurrent selection in plants.
Theor. Appl. Genet. 87: 152-160.
Nei, M. (1963). Effect of selection on the components of genetic variance. In:
StatisticalGenetics and Plant Breeding (Hanson, W.D. and Robinson, H.F., eds.). Publication 982 NAS-NRC, Washington, pp. 501-515.
Penny, L.H. and Eberhart, S.A. (1971). Twenty years of reciprocal recurrent selection with two synthetic varieties of maize. Crop Sci. 11: 900-903.
Robertson, A. (1960). A theory of limits in artificial selection. Proc. R. Soc. Lond. Ser. B.153: 234-249.
San Vicente, F.M. and Hallauer, A.R. (1993). Inbreeding depression rates of materials derived from two groups of maize inbred lines. Rev. Bras. Genet. 16: 989-1001.
Schnicker, B.J. and Lamkey, K.R. (1993). Interpopulation genetic vari-ance after reciprocal recurrent selection in BSSS and BSCB1 maize populations. Crop Sci. 33: 90-95.
Smith, O.S. (1979a). A model for evaluating progress from recurrent selec-tion. Crop Sci. 19: 223-226.
Smith, O.S. (1979b). Application of a modified diallel analysis to evaluate
recurrent selection for grain yield in maize. Crop Sci. 19: 819-822.
Smith, O.S. (1983). Evaluation of recurrent selection in BSSS, BSCB1 and BS13 maize populations. Crop Sci. 23: 35-40.
Souza Jr., C.L. (1985). Procedures for estimating expected genetic progress in inbred lines via recurrent intrapopulation selection. Rev. Bras. Genet. VIII:329-342.
Stucker, D.S. and Hallauer, A.R. (1992). Genetic variability as affected by selection in Iowa stiff stalk synthetic maize. J. Hered. 83: 410-418.
Wei, M., Caballero, A. and Hill, W.G. (1996). Selection response in finite populations. Genetics 144: 1961-1974.
Wray, N.R. and Thompson, R. (1990). Prediction of rates of inbreeding in selected populations. Genet. Res. 55: 41-54.
Wray, N.R., Wooliams, J.A. and Thompson, R. (1994). Prediction of rates of inbreeding in populations undergoing index selection. Theor. Appl. Genet. 87: 878-892.