Cecília Khusala Verardi(1), Erivaldo José Scaloppi Junior(2), Guilherme Augusto Peres Silva(1), Lígia Regina Lima Gouvêa(1) and Paulo de Souza Gonçalves(1)
(1)Instituto Agronômico, Caixa Postal 28, CEP 13012‑970 Campinas, SP, Brazil. E‑mail: [email protected], [email protected],
[email protected], [email protected] (2)Agência Paulista de Tecnologia dos Agronegócios, Departamento de Descentralização do
Desenvolvimento, Polo Regional Noroeste Paulista, Rodovia Péricles Belini, Km 121, Caixa Postal 61, CEP 15500‑970 Votuporanga, SP, Brazil. E‑mail: [email protected]
Abstract – The objective of this work was to assess the genetic parameters and to estimate genetic gains in young rubber tree progenies. The experiments were carried out during three years, in a randomized block design, with six replicates and ten plants per plot, in three representative Hevea crop regions of the state of São Paulo, Brazil. Twenty‑two progenies were evaluated, from three to five years old, for rubber yield and annual girth growth. Genetic gain was estimated with the multi‑effect index (MEI). Selection by progenies means provided greater estimated genetic gain than selection based on individuals, since heritability values of progeny means were greater than the ones of individual heritability, for both evaluated variables, in all the assessment years. The selection of the three best progenies for rubber yield provided a selection gain of 1.28 g per plant. The genetic gains estimated with MEI using data from early assessments (from 3 to 5‑year‑old) were generally high for annual girth growth and rubber yield. The high genetic gains for annual girth growth in the first year of assessment indicate that progenies can be selected at the beginning of the breeding program. Population effective size was consistent with the three progenies selected, showing that they were not related and that the population genetic variability is ensured. Early selection with the genetic gains estimated by MEI can be made on rubber tree progenies.
Index terms: Hevea brasiliensis, annual girth growth, early selection, effective population size, multi‑effect index, rubber yield.
Parâmetros genéticos e ganhos de seleção estimados
em progênies jovens de seringueira
Resumo – O objetivo deste trabalho foi avaliar os parâmetros genéticos e estimar ganhos genéticos em progênies jovens de seringueira. Os experimentos foram realizados durante três anos, em delineamento de blocos ao acaso, com seis repetições e dez plantas por parcela, em três regiões representativas da heveicultura paulista. Vinte e duas progênies foram avaliadas, dos três aos cinco anos de idade, quanto à produção de borracha e incremento anual do caule. O ganho genético foi estimado com o índice multiefeitos (IME). A seleção pela média das progênies proporcionou maior ganho genético do que a seleção baseada em indivíduos, já que os valores de herdabilidade das médias de progênies foram maiores do que os da herdabilidade individual, para ambas as variáveis, em todos os anos de avaliação. A seleção das três melhores progênies quanto à produção de borracha proporcionou um ganho de seleção de 1,28 g por planta. Os ganhos genéticos estimados pelo IME com dados das primeiras avaliações (dos 3 aos 5 anos) foram altos em geral, para produção de borracha e incremento anual do caule. Os elevados ganhos genéticos obtidos para incremento anual no primeiro ano de avaliação indicam que as progênies podem ser selecionadas no início do programa de melhoramento. O tamanho efetivo da população foi condizente com as três progênies selecionadas e mostrou que elas não são aparentadas e que a variabilidade genética da população está garantida. A seleção precoce, com os ganhos genéticos estimados pelo IME, pode ser feita em progênies de seringueira.
Termos para indexação:Hevea brasiliensis, crescimento anual do caule, seleção precoce, tamanho efetivo populacional, índice multiefeito, produção de borracha.
Introduction
Breeding programs for rubber tree [Hevea brasiliensis (Willd. ex A. Juss.) Müell. Arg.] in Brazil
to achieve the final results. Therefore, research on
young plants using early yield and plant vigor tests is very important.
Knowledge of the genetic variability of a population is the basis for breeding and essential to estimate the genetic parameters, which describe the variation levels among progenies, the magnitude of genetic control of traits, and the expected gains with selection (Freitas et al., 2006). Researches in several parts of the world, such as Indonesia, India, Malaysia, and Brazil, have been trying to maximize genetic gains of rubber tree (Costa et al., 2008) using different selection techniques in order to accelerate the breeding programs.
According to Resende et al. (1999) the multi‑effect index (MEI) method is an excellent selection procedure, equivalent to the Blup (best linear unbiased prediction). MEI estimates uses the variances of the mixed linear model random effects when data are unbalanced or when survival is greater than 85%. The index is based on the multiplication of phenotypic values of individuals, plot means, family means, block
means, and general means by the weighing coefficients of the indexes (heritability). These coefficients are
calculated in order to maximize the correlation between heritability indexes and genetic values. This maximization is obtained from the regression between genetic values and phenotype values. The
multiplication between these values and coefficients is
made using a matrix system (Resende & Higa, 1994a). According to Resende & Higa (1994b), selection based on MEI maximizes the genetic progress of a trait, regardless of the experimental structure.
The objective of this work was to assess the genetic parameters and estimate genetic gains in young rubber tree progenies.
Materials and Methods
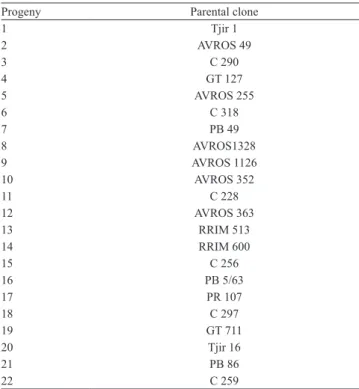
The study was done with a population of cross‑pollinated rubber tree progenies. It was set up in the regional research poles of the Agência Paulista de Agronegócios (Apta), in different rubber cropping regions of the state of São Paulo, Brazil, represented by the following municipalities: Jaú, Pindorama, and Votuporanga (Table 1).
Cross‑pollinated progenies were obtained from parental clones from Southeast Asia germoplasm,
introduced in 1952 at the experimental center at the Instituto Agronômico, Campinas, SP, Brazil (Table 2).
The experiments were set up in 2006, in a randomized block design, with 22 treatments (cross‑pollinated progenies), six replicates, and ten plants per plot, placed in a single row with 1.5x1.5 m spacing.
Rubber yield (g per tapping per plant) was obtained
by the Hamaker Morris‑Mann test (HMM), modified
for three‑year‑old seedlings (Dijkman, 1951), based on the average dry rubber yield of 30 tappings per plant. The tapping panel was opened 15 cm above the ground, using ½S d/3 tapping systems, with a total of
35 tappings, discarding the first five tapping samples
which corresponded to the adaptation of the panel.
Table 1. Characteristics of the experimental sites, in three municipalities of the state of São Paulo, Brazil.
Characteristic Jaú Pindorama Votuporanga
Latitude (S) 22°17' 21°13' 20°25'
Longitude (W) 48°34' 48°56' 49°59'
Altitude (m) 580 560 450
Mean annual temperature (ºC) 21.6 21.0 22.3 Mean annual precipitation (mm) 1,344 1,390 1,480
Soil type Ferralsol Acrisol Lixisol
Table 2. Name of the parental clones introduced from
Southeast Asian to the Instituto Agronômico in 1952, which originated the 22 evaluated progenies.
Progeny Parental clone
1 Tjir 1
2 AVROS 49
3 C 290
4 GT 127
5 AVROS 255
6 C 318
7 PB 49
8 AVROS1328
9 AVROS 1126
10 AVROS 352
11 C 228
12 AVROS 363
13 RRIM 513
14 RRIM 600
15 C 256
16 PB 5/63
17 PR 107
18 C 297
19 GT 711
20 Tjir 16
21 PB 86
The indication ½S stands for a half‑spiral cut, and d/3 indicates the interval between tappings, in this case, one tapping every three days.
Annual girth growth (cm per plant) was determined at 50 cm from the ground with a measuring tape. The analysis for individual variance was done according to the mathematical model that considers all the random effects, expressed by Yijk = m + pi + bj + eij + dijk, , in which: Yijk is the observation related to plant k in the j replicate, in the i progeny;m is the general mean; pi is the random effect of the ith progeny (i= 1, 2,..., p); b
j is the effect of the j (j= 1, 2,..., b) replicate; eij is the effect of the random experimental error associated to the ij plot; dijkis the random deviation inherent to plant k within the ij plot.
The variance estimates were obtained from the plot means in each location, following recommendations by Steel & Torrie (1980), analyzed by the genetic statistical program Selegen (Resende, 2002).
Within plot variances (s2
d) were calculated using individual plant data and averaging the individual plant square means.
Genetic and phenotypic parameters were estimated using the genetic statistical software Selegen – Reml/ Blup (Model 93).
Individual heritability in narrow sense was estimated as ˆh2r = ˆs
2 a / (ˆs
2 a + ˆs
2 p + ˆs
2
e), in which: ˆs 2
a is the additive genetic variance; ˆs2
p is the genetic variance among progenies; ˆs2
e is the environmental variance among plots.
Progeny mean heritability was calculated as ˆh2
mp = 0.25 ˆs 2
a /(0.25 ˆs 2 a + ˆs
2 p /b + ˆs
2
e /nb), in which: b is the number of blocks; n is the number of plots; ˆs2
a is the additive genetic variance; ˆs2
p is the genetic variance among progenies; ˆs2
e is the environmental variance among plots.
Within plot additive heritability was calculated as ˆh2
ad = 0.75 ˆs 2
a /(0.75 ˆs 2 a + ˆs
2
e ), in which: ˆs 2
p is the genetic variance among progenies; ˆs2
a is the additive genetic variance; ˆs2
e is the environmental variance among plots.
Individual genetic coefficient of variation was
calculated as CVg (%) = 100(ˆs2a/–x)0.5, in which: ˆs 2 a is the additive genetic variance; and –x is the general mean.
Within plot environmental coefficient of variation
was calculated as CVe (%) = 100 [(c2 + ˆs2parc /n)0.5/–x], in which: c2 is the plot coefficient of variation, ˆs2
parc is the plot variance; –x is the general mean.
Selection gain (%) was calculated as Gs(%) = 100Gs/–x, in which: Gs is the genetic gain; and –x is the general mean
The multi‑effect index (MEI) was used to estimate the selection gains (Resende, 2002) by the following expression:
ˆI = ˆb1 Yijk + (ˆb2 ‑ ˆb3) –
Yi. + (ˆb3 ‑ ˆb1) – Yij. ‑ ˆb3
–
Y.j. + (ˆb3 ‑ ˆb2) – Y... in which: Y–... is the general mean of the experiment; Yijk is the individual value;
–
Yi.is the mean as a matrix in the experiment; Y–ij. is the mean of the matrix in a determined block (plot mean); Y–.j. is the block mean;
ˆb
1 = ˆh2d is the within plot heritability in the narrow sense; ˆh2d = (3/4) ˆs 2 A/ ˆs
2
d;
ˆb
2=
ˆh2m is the heritability in the narrow sense of the matrices ˆh2m = [(3 + nb)/4nb]ˆs 2 A/ˆs
2 p + ˆs
2 e/b + ˆs
2
d/n; and
ˆb
3 = ˆh2p is the plot heritability in the narrow sense, in which ˆh2p = (3/4n) ˆs 2 A/ˆs
2 e + ˆs
2 d /n.
The effective population (Ne) was obtained according to Resende (2002) as Ne = (4Nf
– kf)/[
–
kf + 3 + (ˆs2kf / – kf)], in which: –kfis the mean number of selected individuals per matrix; sˆ2
kf is the variance of the number of selected individuals per matrix; Nf is the number of selected matrices.
Results and Discussion
Significant mean square for progenies show that they
differed as to annual girth growth and rubber yield, and indicate that selection can be made with data already
from the first year of assessment, except for rubber
yield in Jaú, where the mean square for progenies was
not significant in the first year (Table 3). These results
agree with those of Gonçalves et al. (2004a, 2009) and Costa et al. (2006).
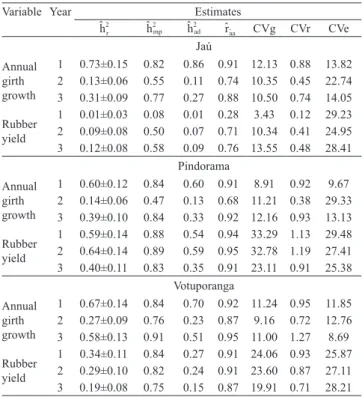
The heritability values ranged from low to high for the evaluated variables (Table 4). Progeny mean heritability (ˆh2
mp) was higher than the individual heritability (ˆh2
r and ˆh 2
ad); therefore, selection based on progeny mean would provide higher genetic gains than that based only on individuals. Gonçalves et al. (2005), in studies carried out in the same locations of the present one, with three‑year‑old progenies, and reported similar results, with greater (ˆh2
mp than ˆh 2 r). These authors stated that high heritability estimates, together with a great variation within population,
makes it more efficient to select for productive and
and within progeny heritabilities, for rubber yield and annual girth growth. Therefore, selecting by progeny mean seems to be a sound strategy to increase the genetic gain in rubber tree.
The selective‑accuracy (ˆrˆaa) values were greater than
80%, within the indicated standard for the first and
intermediate steps of a breeding program (Resende, 2007). High‑accuracy values are advantageous because they can provide high genetic gain values and increase
selecting efficiency of progenies.
The coefficient of genetic variation (CVg%) and the experimental coefficient of variation (CVe%)
(Table 4) were low, but within the expected range for rubber. Higher values were reported by Gonçalves et al. (2004b) and Gouvêa et al. (2012). The relative variation index (CVr) showed very high values, greater than 1.0 in some cases, indicating high genetic variability for the evaluated variables, in all the years and locations. These values also indicate a favorable situation for selection.
Selecting 13.63% of the best progenies led to high selection gains, estimated with MEI, for rubber
yield, using data from the three early tests (Table 5). However, low selection gains were observed in the
first year of production in Jaú (3,92%), which was
already expected since the observed heritabilities in this period (Table 4) were also low (ˆh2
mp = 0,08). Progeny selection in Jaú is recommended only from the third production year, when heritability value becomes high (59.52%).
Genetic gains are based on the general mean of each year. In the present study, the improved mean was greater than the general mean, in all the locations and tests; thus, selecting the three best progenies would increase yield up to 1.28 g per plant. Because of the genetic gain increases over the assessment years, selection is recommended only at the end of the third test, in order to make the breeding programs more
efficient.
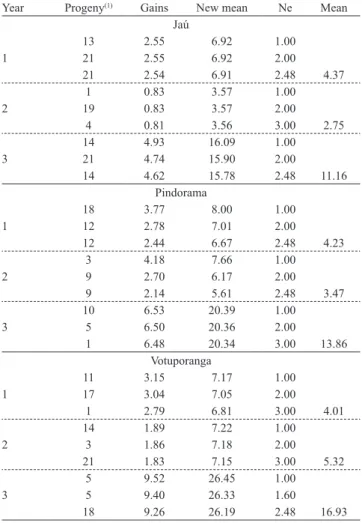
The annual girth growth had high selection gains, estimated with MEI, in all assessed years and locations
Table 3. Individual analysis for annual girth growth (cm per plant) and dry rubber yield (g per tapping per plant), of 22 rubber tree progenies assessed for three years, in Jaú, Pindorama, and Votuporanga, São Paulo state, Brazil, 2006.
Variable Year Mean square
Progeny Residual Within plot Jaú
Annual girth growth
1 2.05** 0.36 0.98
2 0.87** 0.39 2.14
3 10.70** 2.45 15.27
Rubber yield
1 0.02ns 0.02 0.12
2 0.12** 0.06 0.44
3 0.30** 0.12 0.92
Pindorama
Annual girth growth
1 1.02** 0.17 0.71
2 1.94* 1.04 3.49
3 20.37** 3.31 25.82
Rubber yield
1 0.36** 0.04 0.29
2 0.52** 0.05 0.39
3 0.58** 0.09 0.69
Votuporanga
Annual girth growth
1 1.45** 0.23 0.87
2 1.88** 0.46 3.15
3 22.99** 2.17 20.22
Rubber yield
1 0.08** 0.01 0.13
2 0.14** 0.02 0.24
3 0.26** 0.06 0.63
nsNonsignificant. *and**Significant by the F test, at 5 and 1% probability.
Table 4. Estimates of genetic parameters for annual girth growth and rubber yield of 22 rubber tree progenies assessed for three years, in three locations, in the state of São Paulo, Brazil.
Variable Year Estimates
ˆh2
r ˆh
2
mp ˆh
2
ad ˆrˆaa CVg CVr CVe
Jaú
Annual girth growth
1 0.73±0.15 0.82 0.86 0.91 12.13 0.88 13.82 2 0.13±0.06 0.55 0.11 0.74 10.35 0.45 22.74 3 0.31±0.09 0.77 0.27 0.88 10.50 0.74 14.05
Rubber yield
1 0.01±0.03 0.08 0.01 0.28 3.43 0.12 29.23 2 0.09±0.08 0.50 0.07 0.71 10.34 0.41 24.95 3 0.12±0.08 0.58 0.09 0.76 13.55 0.48 28.41
Pindorama
Annual girth growth
1 0.60±0.12 0.84 0.60 0.91 8.91 0.92 9.67 2 0.14±0.06 0.47 0.13 0.68 11.21 0.38 29.33 3 0.39±0.10 0.84 0.33 0.92 12.16 0.93 13.13
Rubber yield
1 0.59±0.14 0.88 0.54 0.94 33.29 1.13 29.48 2 0.64±0.14 0.89 0.59 0.95 32.78 1.19 27.41 3 0.40±0.11 0.83 0.35 0.91 23.11 0.91 25.38
Votuporanga
Annual girth growth
1 0.67±0.14 0.84 0.70 0.92 11.24 0.95 11.85 2 0.27±0.09 0.76 0.23 0.87 9.16 0.72 12.76 3 0.58±0.13 0.91 0.51 0.95 11.00 1.27 8.69
Rubber yield
1 0.34±0.11 0.84 0.27 0.91 24.06 0.93 25.87 2 0.29±0.10 0.82 0.24 0.91 23.60 0.87 27.11 3 0.19±0.08 0.75 0.15 0.87 19.91 0.71 28.21
ˆh2
r, individual heritability in the narrow sense; ˆh 2
mp, progeny mean herita‑
bility; ˆh2
ad, within plot additive heritability; ˆrˆaa , accuracy; CVg (%), coef‑
(Table 6). Due to the high genetic gain obtained with
data already from the first year, the most vigorous
progenies can be selected at the beginning of the breeding program. Early selection can reduce rubber tree breeding cycle, which is very long, taking from
25 to 30 years to reach the final results. The positive
selection gains obtained in all the assessment years and locations allows for a more reliable early selection. The values reported here are compatible with other studies, such as those by Gonçalves et al. (2004b), which used a different methodology.
A more effective selection must take yield into consideration and account for the performance of
other variables that contribute to yield increase, especially the annual girth growth gain, which is related to plant vigor.
The effective population size was in agreement with the number of selected progenies (three), indicating that they were not related , thus ensuring the genetic variability of the population. The mean inbreeding
coefficient was high with F=[1/(2Ne)*100]= 17%,
but this value can be reduced by increasing the number of selected individuals. Arantes et al.
(2010) reported endogamy coefficient values lower
(F=2.88%) than those observed in the present study, selecting the 20 best rubber tree progenies for rubber yield.
Table 5. Selection gains, new means, and effective population size (Ne) of selected individuals by the multi‑effect index method, for rubber yield (g per tapping per plant) of 22 progenies assessed for three years, in Jaú, Pindorama, and Votuporanga, in the state of São Paulo, Brazil.
Year Progeny(1) Gains New mean Ne Mean
Jaú
1
6 0.03 0.54 1.00
0.51
19 0.02 0.53 2.00
22 0.02 0.53 3.00
2
19 0.33 1.30 1.00
0.98
15 0.30 1.28 2.00
19 0.29 1.27 2.48
3
17 0.84 2.10 1.00
1.26
19 0.76 2.04 2.00
19 0.75 2.01 2.48
Pindorama
1
20 1.37 2.06 1.00
0.69
20 1.35 2.04 1.60
20 1.30 2.01 2.00
2
4 1.91 2.76 2.76
0.85
15 1.77 2.62 2.61
20 1.71 2.56 2.56
3
19 1.70 2.93 1.00
1.23
5 1.62 2.84 2.00
15 1.54 2.76 3.00
Votuporanga
1
18 0.95 1.40 1.00
0.45
18 0.85 1.29 1.60
18 0.78 1.23 2.00
2
17 1.01 1.59 1.00
0.58
18 0.95 1.53 2.00
12 0.90 1.46 3.00
3
3 1.20 2.11 1.00
0.90
18 1.19 2.09 2.00
17 1.13 2.04 3.00
(1)Progeny numbers related to identification in Table 2.
Table 6. Selection gains, new means, and effective
populational size (Ne) of selected individuals by the multi‑effect index, for annual girth growth (cm per plant) of 22 progenies assessed for three years, in Jaú, Pindorama, and Votuporanga, in the state of São Paulo, Brazil.
Year Progeny(1) Gains New mean Ne Mean
Jaú
1
13 2.55 6.92 1.00
4.37
21 2.55 6.92 2.00
21 2.54 6.91 2.48
2
1 0.83 3.57 1.00
2.75
19 0.83 3.57 2.00
4 0.81 3.56 3.00
3
14 4.93 16.09 1.00
11.16
21 4.74 15.90 2.00
14 4.62 15.78 2.48
Pindorama
1
18 3.77 8.00 1.00
4.23
12 2.78 7.01 2.00
12 2.44 6.67 2.48
2
3 4.18 7.66 1.00
3.47
9 2.70 6.17 2.00
9 2.14 5.61 2.48
3
10 6.53 20.39 1.00
13.86
5 6.50 20.36 2.00
1 6.48 20.34 3.00
Votuporanga
1
11 3.15 7.17 1.00
4.01
17 3.04 7.05 2.00
1 2.79 6.81 3.00
2
14 1.89 7.22 1.00
5.32
3 1.86 7.18 2.00
21 1.83 7.15 3.00
3
5 9.52 26.45 1.00
16.93
5 9.40 26.33 1.60
18 9.26 26.19 2.48
Conclusions
1. Genetic variability for the studied variables in rubber tree progenies can be detected in young plants, which indicates favorable conditions for early selection.
2. Selection is more efficient when based on the
progeny mean than when based only on individuals. 3. Early selection can be made on rubber tree progenies using the genetic gains estimated with multi‑effects index.
Acknowledgments
To Fundação de Amparo à Pesquisa do Estado de São
Paulo (Fapesp), for financial support and scholarship.
References
ARANTES, F.C.; GONÇALVES, P. de S.; SCALOPPI JUNIOR, E.J.; MORAES, M.L.T. de; RESENDE, M.D.V. de. Ganho genético com base no tamanho efetivo populacional de progênies de seringueira. Pesquisa Agropecuária Brasileira, v.45, p.1419‑1424, 2010. DOI: 10.1590/S0100‑204X2010001200012.
COSTA, R.B. da; RESENDE, M.D.V. de; GONÇALVES, P. de S.; CHICHORRO, J.F.; ROA, R.A.R. Variabilidade genética e seleção para caracteres de crescimento da seringueira. Bragantia, v.67, p.299‑305, 2008. DOI: 10.1590/ S0006‑87052008000200005.
COSTA, R.B. da; RESENDE, M.D.V. de; GONÇALVES, P. de S.; REGO, F.L.H.; CONTINI, A.Z.; ROA, R.A.R. Genetic evaluation of Hevea brasiliensis [(Willd ex Adr. de Juss.) Müell. Arg.] for juvenile vigour using the Reml/Blup method. Floresta e Ambiente, v.12, p.8‑14, 2006.
DIJKMAN, M. J. Hevea: thirty years of research in Far East Florida. Miami: University of Miami, 1951. 329p.
FREITAS, M.L.M.; SEBBENN, A.M.; MORAIS, E.; ZANATTO, A.C.S.; VERARDI, C.K.; PINHEIRO, A.N. Parâmetros genéticos em progênies de polinização aberta de Cordia trichotoma(Vell.) ex Steud. Revista do Instituto Florestal, v.18, p.95‑102, 2006.
GONÇALVES, P. de S.; BORTOLETTO, N.; COSTA, R.B. da; SILVA, M. de A.; CARDINAL, Á.B.B.; GOUVÊA, L.R.L. Estimates of annual genetic parameters and expected gains in the second cycle of Hevea genotype selection. Crop Breeding and Applied Biotechnology, v.4, p.416‑421, 2004a.
GONÇALVES, P. de S.; CARDINAL, A.B.B.; COSTA, R.B. da; BORTOLETTO, N.; GOUVÊA, L.R.L. Genetic variability and selection for laticiferous system characters in Hevea brasiliensis.
Genetics and Molecular Biology, v.28, p.414‑422, 2005. DOI: 10.1590/S1415‑47572005000300014.
GONÇALVES, P. de S.; MARTINS, A.L.M.; BORTOLETTO, N.; SAES, L.A. Selection and genetic gains for juvenile trains in progenies of Hevea in São Paulo state, Brazil. Genetics and Molecular Biology, v.27, p.207‑214, 2004b. DOI: 10.1590/ S1415‑47572004000200014.
GONÇALVES, P. de S.; MORAES, M.L.T. de; SILVA, M. de A.; GOUVÊA, L.R.L.; AGUIAR, A.T. da E.; COSTA, R.B. Prediction of Hevea progeny performance in the presence of genotype‑environment interaction. Brazilian Archives of Biology and Technology, v.52, p.25‑33, 2009. DOI: 10.1590/ S1516‑89132009000100004.
GOUVÊA, L.R.L.; SILVA, G.A.P.; VERARDI, C.K.; SILVA, J.Q.; SCALOPPI‑JUNIOR, E.J.; GONÇALVES, P. de S. Temporal stability of vigor in rubber tree genotypes in the pre‑ and post‑tapping phases using different methods. Euphytica, v.186, p.625‑634, 2012. DOI: 10.1007/s10681‑012‑0688‑y.
RESENDE, M.D.V. de. Genética biométrica e estatística no melhoramento de plantas perenes. Brasília: Embrapa Informação Tecnológica; Colombo: Embrapa Florestas, 2002. 975p.
RESENDE, M.D.V. de. Matemática e estatística na análise de experimentos e no melhoramento genético. Colombo: Embrapa Florestas, 2007. 561p.
RESENDE, M.D.V. de; FERNANDES, J.S.C.; SIMEÃO, R.M. Blup individual multivariado em presença de interação genótipo x ambiente para delineamentos experimentais repetidos em vários ambientes. Revista de Matemática e Estatística, v.17, p.209‑228, 1999.
RESENDE, M.D.V. de; HIGA, A.R. Estimação de valores genéticos no melhoramento de Eucalyptus: seleção em um caráter com base em informações do indivíduo e de seus parentes. Boletim de Pesquisa Florestal, v.28/29, p.11‑35, 1994a.
RESENDE, M.D.V. de; HIGA, A.R. Maximização da eficiência da seleção em testes de progênies de Eucalyptus através da utilização de todos os efeitos do modelo matemático. Boletim de Pesquisa Florestal, v.28/29, p.37‑55, 1994b.
SILVA, G.A.P.; GOUVÊA, L.R.L.; VERARDI, C.K.; RESENDE, M.D.V. de; SCALOPPI JUNIOR, E.J.; GONÇALVES, P. de S. Genetic parameters and correlation in early measurement cycles in rubber trees. Euphytica, v.189, p.343‑350, 2012. DOI: 10.1007/ s10681‑012‑0751‑8.
STEEL, R.G.D.; TORRIE, J.H. Principles and procedures of statistics: a biometrical approach. 2nd ed. New York: McGraw‑Hill, 1980. 633p.