0104-0014/$ - see front matter © 2013 Sociedade Brasileira de Anestesiologia. Published by Elsevier Editora Ltda. All rights reserved. doi: 10.1016/j.bjane.2013.01.001
Oficial Publication of the Brazilian Society of Anesthesiology www.sba.com.br
Revista
BRasileiRa de
anestesiologia
☆Study conducted at Hospital Santa Cruz, Curitiba, PR, Brazil, in partnership with Hospital de Clínicas da Universidade Federal do Paraná, Curitiba, PR, Brazil.
* Corresponding author.
E-mail: [email protected]; [email protected] (F.A.E. Carvalho).
SCIENTIFIC ARTICLE
Comparative study between doses of intrathecal morphine
for analgesia after caesarean
☆Francisco Amaral Egydio de Carvalho
a,*, Sérgio B. Tenório
ba Hospital Santa Cruz, Curitiba, PR, Brazil
b Hospital de Clínicas, Universidade Federal do Paraná, Curitiba, PR, Brazil
Received 16 December 2012; accepted 10 January 2012
KEYWORDS
Analgesia; Caesarean section; Morphine;
Intrathecal; Side effects; Visual analogue scale
Abstract
Background and objectives: Analgesia after caesarean section is important because postpartum women with pain have difficulty in mobility, which undermines breastfeeding. Intrathecal morphine provides adequate and prolonged analgesia after cesarean. The aim of this study was to compare the quality of analgesia provided by two doses of intrathecal morphine and its side effects in patients undergoing cesarean section.
Method: The study included 123 pregnant women with gestational age over 38 weeks and scheduled for cesarean section. The women were randomly allocated into two groups to receive either 50 or 100 µg of intrathecal morphine (Group 50/Group 100). All patients were intrathecally anesthetized with 12 mg of 0.5% hyperbaric bupivacaine. Patients were assessed between the 9th and 11th hour and the 22nd and 24th hour after blockade for quality
of analgesia, analgesic consumption, side effects, and main cause of discomfort in the first 24 hours after surgery.
Results: There was similarity between groups regarding anthropometric data and obstetric history. There was no statistical difference in pain intensity between groups. In both groups, pain was more intense in the first 12 hours after anesthesia (p < 0.001). Tramadol hydrochloride consumption and time to first dose were similar in both groups. Pruritus was the most common side effect, with statistically higher incidence in Group 100 (p = 0.026). Conclusions: Intrathecal morphine 50 µg provides the same quality of analgesia as 100 µg, with a lower incidence of side effects.
Introduction
Postoperative analgesia enables a faster rehabilitation, improves the patient’s level of satisfaction, and reduces hospital stay.1,2 In obstetrics, postoperative analgesia is
important because postpartum women with pain have difficulty in walking and may adopt antalgic positions that hinder the initiation of breastfeeding.3 Moreover, endocrine
changes and stress resulting from pain may interfere with lactation.4
Intrathecally administered morphine is the most widely used drug for analgesia after caesarean section, as it promotes adequate and long-lasting postoperative analgesia even at low doses.5,6 However, it may cause side
effects such as nausea, vomiting, pruritus, sedation, and respiratory depression.
The quality of analgesia and incidence of side effects may vary according to the intrathecal dose of morphine used.5 The optimal dose capable of providing better
analgesia with the lowest incidence of side effects has not yet been defined.
The main objective of this study was to compare analgesia at rest and in motion, provided by two doses of intrathecal morphine in patients undergoing cesarean section. Moreover, the need for supplementary analgesics, incidence of side effects, main cause of discomfort within the 24 hours of the study, and level of patient satisfaction regarding analgesia were also compared.
Patients and method
After approval by the Ethics Committee of the Hospital de Clínicas/UFPR and Hospital Santa Cruz, 130 pregnant women, ASA I-III, were invited to participate in this study. Inclusion criteria were: single-fetus pregnancy, more than 38 weeks of gestational age and scheduled for elective cesarean section. Exclusion criteria were: body mass index greater than 40
kg•m2, a history of more than three prior cesareans, allergy to
any of the study medications, psychiatric or cardiopulmonary disease or decompensated diabetes mellitus, and chronic use of analgesics. Patients received the informed consent with information on this study, which was signed after reading and clarification of any doubts.
The study was double-blind and, using a on-line randomization program (www.randon.org), the study participants were randomly allocated into two groups: Group 50 and Group 100.
Upon arrival at the operating room, peripheral venous access was obtained using an 18G catheter and Ringer’s lactate solution (250 mL) was infused with cefazolin (1 g) for antibiotic prophylaxis. After monitoring with non-invasive blood pressure, pulse oximetry, and cardioscopy, patients were placed in a sitting position to receive anesthesia. Spinal puncture was performed with a 27G pencil point needle under topical anesthesia, with 2% lidocaine without vasoconstrictor, through L3-L4 or L4-L5 intervertebral spaces. For intrathecal anesthesia, 0.5% hyperbaric bupivacaine (12 mg) was administered. Patients in Group 50 received 50 µg of morphine associated with bupivacaine, whereas Group 100 received 100 µg associated
with bupivacaine. Morphine was administered in proper syringe, after the local anesthetic.
After anesthesia, patients were kept supine, with the uterus manually shifted to the left to avoid compression
of inferior vena cava, and received oxygen (2-3 L•min–1)
via nasal catheter. For hypotension correction, fluid resuscitation with Ringer’s lactate solution was used, associated with phenylephrine or metaraminol, at the discretion of the anesthesiologist responsible for the case. The objective was to maintain systolic blood pressure greater than 100 mmHg. In cases of bradycardia, with heart rate less than 45 bpm, atropine (0.5 mg) was used. After birth, oxytocin (05-15 U/I) diluted in Ringer’s lactate was administered to stimulate uterine contraction.
At the end of surgery, patients were taken to the post-anesthesia care unit (PACU) and received intravenous ketorolac tromethamine (30 mg), dipyrone (2 g), and bromopride (10 mg). Cases of muscle tremor were treated with pethidine hydrochloride (30 mg). Patients were discharged from PACU after completing 9 points in the modified Aldrete-Kroulik scale.7 Postoperative analgesic
and antiemetic prescriptions were standardized. Patients received ketoprofen (100 mg every 12 hours), dipyrone (1 g every six hours), and bromopride (10 mg every six hours). Tramadol hydrochloride (50 mg) was prescribed as rescue analgesic. For nausea and vomiting episodes, ondansetron (4 mg) was prescribed and for cases of itching, diphenhydramine hydrochloride (25 mg).
Postoperative evaluations were made between the 9th and 11th hour and the 24th and 22nd hour after
anesthesia by a nurse who was blinded to which group the patient belonged. A questionnaire was used to be filled out by patient and evaluator. Evaluated data were postoperative pain intensity, worst pain experienced at each period of time (first period: between anesthesia and first assessment; second period: between first and second evaluation), supplementary analgesic consumption, time interval between anesthesia and first dose of medication, side effects, main cause of discomfort at 24 hours, and satisfaction regarding analgesia.
Postoperative pain intensity was assessed with patients at rest and in motion. To standardize the assessment in motion and facilitate comparison, it has been determined that all patients should cough three times. A 10 cm long visual analogue scale (VAS), not numbered, was used. At this scale, the left end represents no pain and the right end represents the worst possible pain. The patient rated the pain she was feeling, and located it at one point of the scale. The distance between the left end and the point indicated by the patient corresponded to the intensity of pain. Pain intensity was considered mild (up to 3), moderate (4 to 6), and severe8 (7 to 10).
Sample size calculation was based on studies by Mikuni et al.9 and Paech et al.,10 considering a significance level of
5% and power of 90%.
The study results are expressed as mean, median, minimum-maximum values, and standard deviations (quantitative variables) or as frequencies and percentages (qualitative variables). To compare both groups regarding quantitative variables, we considered Student t-test for independent samples or nonparametric Mann-Whitney test, when appropriate. Comparison between the two evaluations for quantitative variables was performed using the nonparametric Wilcoxon’s test. For association between qualitative variables, we considered the chi-square or Fisher’s exact test. Pearson’s correlation coefficient was considered to assess the association between quantitative variables. To estimate parameters of interest, confidence intervals of 95% were constructed. For all tests, p values < 0.05 were considered statistically significant. Data were analyzed with the Statistica software v.8.0.
Results
Of the 130 patients participating in this study, five from Group 50 and two from Group 100 refused to respond the second evaluation due to visit’s time and were excluded from the analysis.
The groups were homogeneous regarding anthropometric data (Table 1). Regarding the number of pregnancies and previous cesareans, the groups were also similar.
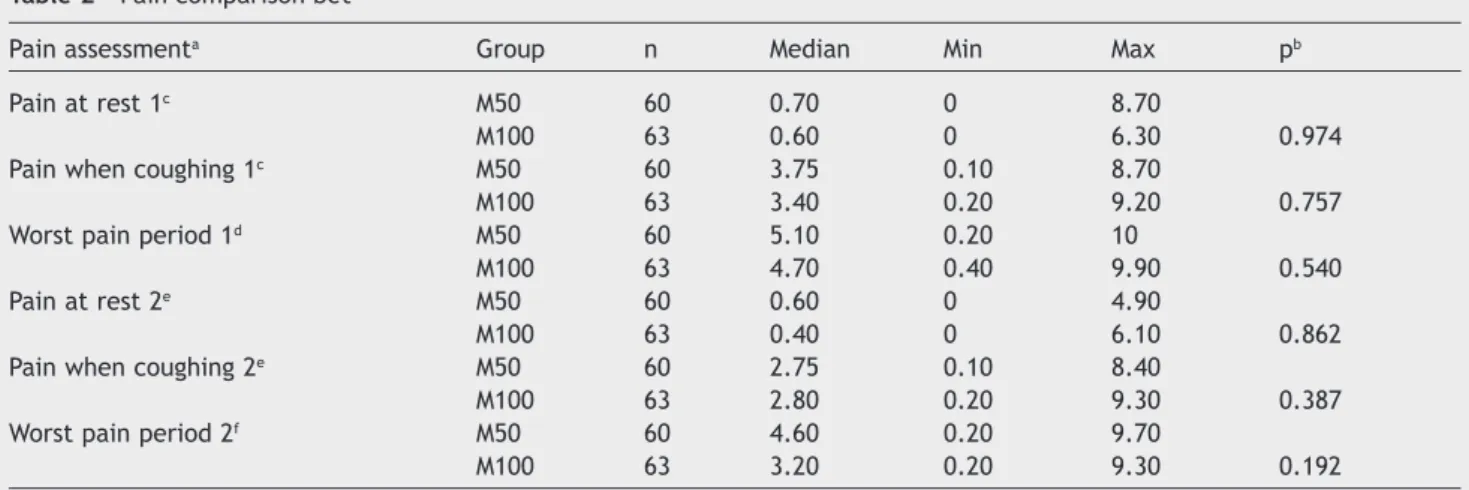
Both groups had similar pain intensity at rest and when coughing in both assessments (Table 2).
There was no statistical difference between groups regarding worst pain at the first and second periods (Table 2). Comparison between times showed that pain intensity was significantly higher in both groups at the first period (Table 3).
There was no statistical difference in moderate/severe pain probability between Group 50 and Group 100, but the probability of moderate/severe pain was statistically higher in the first 12 hours after surgery in both groups (Tables 4 and 5).
In Group 50, 15% of patients requested tramadol hydrochloride and in Group 100, 8% of patients requested analgesia (p = 0.263). The mean interval between anesthesia and the first dose of medication was 496 minutes in Group 50 and 452 minutes in Group 100 (p = 0.740).
In Group 50, the interval between anesthesia and the first urination was 650 ± 128 minutes and in Group 100 it was 694 ± 155 minutes (p = 0.094). The probability of voiding difficulty was also higher in Group 100, but without statistical difference (p = 0.194).
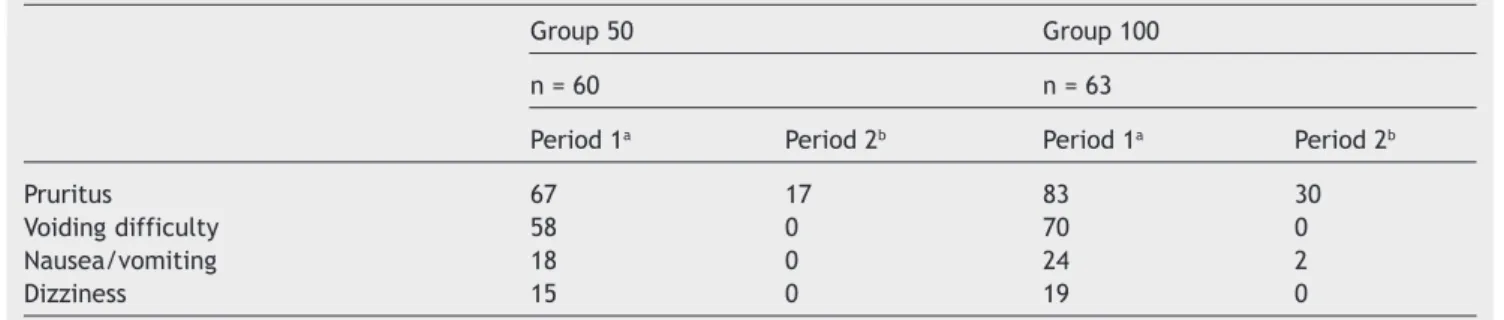
Among side effects, only itching was significantly higher in Group 100 compared to Group 50 (Fig. 1). Side effects were more frequent at first period in both groups (Table 6). There were no cases with sedation and/or respiratory depression.
When asked what bothered them most during the 24 hours after cesarean section, 70% of patients in Group 50 elected pain as the main cause of discomfort, followed by voiding difficulty (15%) and pruritus (12%). In Group 100, the main cause of discomfort was also pain (38%), followed by pruritus (32%), and voiding difficulty (16%) (Table 7).
Regarding satisfaction, 82% of patients in Group 50 and 83% in Group 100 classified analgesia as good or very good at first period (p = 0.785). At the second period, 95% of patients in Group 50 and 87% in Group 100 classified analgesia as good or very good (p = 0.245).
Discussion
Pain assessment is complex because it is influenced by emotional, ethnic, cultural, and cognitive factors. To standardize and make this assessment more objective, scales for pain assessment were created. The most used are the VAS and the verbal numeric scale (VNS). They are easy to apply and when compared to the verbal scale (VS), they are more accurate and able to detect subtle differences.8 For these reasons, we opted for using the
VAS as a pain assessment method in this study. The time interval between anesthesia and the first dose of analgesic or total analgesic consumption are other ways to measure
Table 1 Anthropometric data of patients.
Variable Group 50 Group 100 pa
n = 60 n = 63
Ageb (years) 28.1 ± 5.2 29.4 ± 4.8 0.132
Current weighb (kg) 77.6 ± 11.8 79.9 ± 10.0 0.250
Previous weightb (kg) 64.7 ± 10.7 66.8 ± 10.9 0.280
Heightb (m) 1.6 ± 0.1 1.6 ± 0.1 0.728
BMIb (kg•m2)c 28.7 ± 3.8 29.8 ± 3.9 0.127
BMI, body mass index.
Group 50, received 50 µg morphine; Group 100, received 100 µg morphine.
a Student’s t-test for independent samples, p < 0.05. b Values expressed as mean ± SD.
the effectiveness of analgesia.5
The use of 50 and 100 µg of intrathecal morphine did not show statistically significant difference in pain evaluation between both groups of patients who underwent caesarean section. This result showed that there is no direct relationship between the dose of intrathecal morphine and quality of analgesia, which are consistent with the results of other authors. Cardoso compared 25, 50, and 100 µg of intrathecal morphine
and reported analgesia statistically better in the group receiving 100 µg; however, analgesia was satisfactory in all groups without clinical difference between them.11 No
patient required systemic opioid to supplement analgesia. Ganem et al.12 used 50 and 100 µg of intrathecal morphin
and also reported similar analgesia between groups. In the study by Girgin et al.,13 100, 200, 300 and 400 µg of
intrathecal morphine were compared with a control group not receiving morphine. The study showed no statistical
Table 3 Pain comparison regarding periods for each group.
Group Pain assessment Median Min Max pa
M50 (n = 60) Pain at rest 1b 0.70 0 8.70
Pain at rest 2c 0.60 0 4.90 0.183
Pain when coughing 1b 3.75 0.10 8.70
Pain when coughing 2c 2.75 0.10 8.40 < 0.001
Worst pain period 1d 5.10 0.20 10
Worst pain period 2e 4.60 0.20 9.70 0.001
M100 (n = 63) Pain at rest 1b 0.60 0 6.30
Pain at rest 2c 0.40 0 6.10 0.358
Pain when coughing 1b 3.40 0.20 9.20
Pain when coughing 2e 2.80 0.20 9.30 < 0.001
Worst pain period 1d 4.70 0.40 9.90
Worst pain period 2e 3.20 0.20 9.30 < 0.001
Group 50, received 50 µg morphine; Group 100, received 100 µg morphine.
a Nonparametric Wilcoxon’s test, p < 0.05.
b First evaluation, i.e., period between the 9th and 11th hour after anesthesia. c Second evaluation, i.e., period between the 22nd and 24th hour after anesthesia. d Period between anesthesia and first evaluation.
e Period between the first and second evaluation.
Table 2 Pain comparison bet
Pain assessmenta Group n Median Min Max pb
Pain at rest 1c M50 60 0.70 0 8.70
M100 63 0.60 0 6.30 0.974
Pain when coughing 1c M50 60 3.75 0.10 8.70
M100 63 3.40 0.20 9.20 0.757
Worst pain period 1d M50 60 5.10 0.20 10
M100 63 4.70 0.40 9.90 0.540
Pain at rest 2e M50 60 0.60 0 4.90
M100 63 0.40 0 6.10 0.862
Pain when coughing 2e M50 60 2.75 0.10 8.40
M100 63 2.80 0.20 9.30 0.387
Worst pain period 2f M50 60 4.60 0.20 9.70
M100 63 3.20 0.20 9.30 0.192
Group 50, received 50 µg morphine; Group 100, received 100 µg morphine.
a Visual analog scale.
b Nonparametric Mann-Whitney test, p < 0.05.
c First evaluation, i.e., period between the 9th and 11th hour after anesthesia. d Period between anesthesia and first evaluation.
difference in the quality of analgesia and consumption of supplemental analgesic between groups receiving opioids. Palmer et al.6 evaluated the use of intravenous morphine
after using 0, 25, 50, 75, 100, 200, 300, 400, and 500
Table 5 Difference in probability of moderate/severe paina between periods in each group.
Assessment 1b Assessment 2c p
Group 50, n = 60, moderate/severe pain
Rest 12 8 0.687
Cough 62 47 0.049
Worst pain period 77 62 0.035
Group 100, n = 63, moderate/severe pain
Rest 18 11 0.344
Cough 59 44 0.035
Worst pain period 73 54 0.002
Values are expressed as percentage.
a Moderate/severe pain > 3 assessed with visual analogue scale.
b First evaluation, i.e., period between the 9th and 11th hour after anesthesia. c Second evaluation, i.e., period between the 24th and 22nd hour after anesthesia.
Table 4 Difference in probability of moderate/severe paina between groups at each time period.
Group 50 Group 100 p
n = 60 n = 63
Assessment 1,b moderate/severe pain
Rest 12 18 0.448
Cough 62 59 0.854
Worst pain period 1c 77 73 0.682
Assessment 2,d moderate/severe pain
Rest 8 11 0.763
Cough 47 44 0.857
Worst pain period 2e 62 54 1
Values are expressed as percentage.
a Moderate/severe pain > 3 assessed with visual analogue scale.
b First evaluation, i.e., period between the 9th and 11th hour after anesthesia. c Period between anesthesia and first evaluation.
d Second evaluation, i.e., period between the 24th and 22nd hour after anesthesia. e Period between the first and second evaluation.
18.33 23.81
70
58.33 87.3
69.84
15 19.05 Group 50 Group 100
Pruritus (p = 0.026) Voiding difficulty (p = 0.194) Dizziness (p = 0.635) Nausea/Vomiting (p = 0.512)
Figure 1 Incidence of side effects in at least one period in each group. Values are expressed as percentages.
The first 12 hours after cesarean section corresponded to the period of worst pain intensity. In both groups, pain when coughing and the worst pain of the period were statistically greater in the first assessment. The incidence of moderate/severe pain (greater than 3 on VAS) was also greater at the first 12 hours. In Group 50, 77% of patients reported moderate/severe pain in the first period and 62% of patients in the second (p = 0.035). In Group 100, 73% of patients experienced moderate/severe pain in the first period and 54% of patients in the second (p = 0.002).
In this study, the worst pain felt in each period had mean and median < 3 in both groups. This result is opposed to that of Cardoso et al.11 who compared similar doses of
intrathecal morphine using VAS and reported that the mean pain during 24 hours was > 1 in all groups. Possibly, the difference in pain intensity between studies was because Cardoso evaluated the patients from the first hour after blockade, at one-hour interval.11 Pain intensity in the first
hours after anesthesia is less intense due to the residual effect of local anesthetic, which certainly reduced the mean pain for 24 hours. In the present study, it was decided to evaluate patients after anesthesia regression, on two times, between the 9th and 11th hour and the 22nd and 24th
hour after anesthesia.
In both groups, tramadol hydrochloride consumption was surprisingly low, considering the incidence of moderate/ severe pain. Only 15% of patients in Group 50 requested analgesia, while in Group 100, 8% of patients requested
analgesia (p = 0.263). This fact illustrates the ineffectiveness of prescriptions using dosing schedule only when necessary. Possibly, analgesic consumption would be greater in both groups if a system of patient-controlled analgesia (PCA) had been used, as well as lower pain intensity. In 2002, Dollin et al.14 reported better pain control and a lower incidence
of moderate/severe pain in patients using PCA compared to patients receiving analgesics only when requested.
Time interval between anesthesia and the first analgesic dose was not statistically different between groups. Sarvela et al.15 compared 100 and 200 µg of intrathecal morphine
with 3 mg of epidural morphine for cesarean section analgesia and also found statistically similar time interval between anesthesia and the first dose of analgesic. In the study by Girgin study,13 time interval to first analgesic dose
was lower in control group, but there was no statistical difference between groups receiving morphine. These results differ from those presented by Abboud et al.16
and Uchiyama et al.17 who reported duration of analgesia
directly proportional to the dose of morphine.
Pruritus is the most common side effect after the use of intrathecal morphine and has a variable incidence.5,11,15,18
In obstetric patients, it may be more frequent due to the interaction with estrogen receptors Mu19 (µ). In
the presentstudy, it was the most frequent side effect, experienced by 70% of patients in Group 50 and 87% in Group 100 (p = 0.026). This dose-dependent effect is consistent with the systematic review by Dahl, reporting
Table 7 Main factors of discomfort over 24 hours in each study group.a
Group 50 Group 100
n = 60 n = 63
1st Pain 70 1st Pain 38
2nd Voiding difficulty 15 2nd Pruritus 32
3rd Pruritus 12 3rd Voiding difficulty 16
4th Dizziness 2 4th Nausea/vomiting 11
5th Nausea/vomiting 2 5th Dizziness 3
a Values are expressed as percentage of patients reporting each complaint.
Table 6 Relationship between side effects and periods.
Group 50 Group 100
n = 60 n = 63
Period 1a Period 2b Period 1a Period 2b
Pruritus 67 17 83 30
Voiding difficulty 58 0 70 0
Nausea/vomiting 18 0 24 2
Dizziness 15 0 19 0
Values are expressed as percentage.
that the incidence of pruritus varies directly according morphine dose.5 In the study by Cardoso et al.,11 the
incidence of pruritus in groups receiving 25, 50, and 100 µg of intrathecal morphine was 33%, 33%, and 58%, respectively (p < 0.05). The likely cause for the difference in the incidence of pruritus is that Cardoso considered only cases requiring treatment, while this study included all patients who reported pruritus. The study by Sarvela reported 77% incidence of pruritus.15
Urinary retention was the second most frequent side effect. The incidence in Group 50 was 58%, with a mean time interval until the first urination of 650 minutes, and 70% in Group 100, with a mean interval until the first urination of 693 minutes. Despite the numerical difference between groups, it was not statically significant and all patients had voiding activity normalized in the second evaluation. For urinary retention diagnosis, some authors use the residual volume of urine in the bladder after urination or consider the need for catheterization or frustrated attempt of spontaneous voiding.20,21 These conceptual differences
associated with the use of urinary catheterization during cesarean section in some services make it difficult to determine the incidence of urinary retention.22 In this
study, we chose to consider as having urinary retention all patients who had not experienced diuresis until the first evaluation. This difference may explain the high incidence of this side effect in the study. Kuipers et al.22 assessed the
effect of intrathecally administered opioids on urinary tract and reported a reduction in the bladder detrusor muscle contractility associated with a reduction in the urgency sensation, resulting in urinary retention. The intensity and duration of this effect was dose-dependent.22
The incidence of nausea/vomiting was not statistically different between groups. This result is consistent with that of other authors. Cardoso et al.11 found only a
trend towards a higher incidence of nausea and vomiting with increased dose of intrathecal morphine (p > 0.05). Ganem et al.12 reported incidence of nausea and vomiting
statistically similar between patients who received 50 or 100 µg of intrathecal morphine. Palmer et al.6 and Girgin
et al.13 compared increasing doses of intrathecal morphine
and reported that the incidence and severity of nausea and vomiting did not vary with the dose used.
There was no case of sedation or respiratory depression, which does not mean that these side effects will not occur. Possibly, the small number of patients involved in the study justifies this result. Sedation is considered a warning sign, as it may precede respiratory depression – the most feared side effect of intrathecal morphine. The incidence of respiratory depression is less than 1% and may occur up to 24 hours after administration. In obstetric patients, the incidence seems to be lower due to the respiratory stimulation caused by high levels of progesterone.19 In a
review by Dahl, the incidence of respiratory depression following caesarean section was 0.2%.5
Regardless of morphine dosage, the incidence of moderate/severe pain was higher than 70% in the first period and higher than 50% in the second period. Despite the high incidence of moderate/severe pain, over 80% of patients in the first period and over 85% in the second period rated the quality of analgesia as very good or good,
irrespective of the group. This result shows that 100 µg of morphine do not promote more satisfying analgesia than 50 µg and demonstrates the difficulty of relating pain intensity with level of satisfaction.1
In 70% of patients in Group 50, pain was the event that bothered the most over 24 hours. In Group 100, pain also was the most bothering event; however, it occurred in 38% of patients, while 32% reported pruritus as the main factor of discomfort in the same period. Considering that the quality of analgesia was similar between groups, one possible explanation for this result is a difference in the intensity of side effects. A more intense pruritus in Group 100 justifies the number of patients who elected it as the main cause of discomfort in the 24 hours after cesarean. This result is consistent with those of Palmer et al.6 and Girgin et al.13
who reported pruritus intensity varying proportionally with the intrathecal dose of morphine used.
Our results suggest that 50 µg of intrathecal morphine are closer to the optimal dose for analgesia after cesarean section than 100 µg, as it provide the same quality of analgesia with lower incidence of side effects. Pruritus was statistically more frequent in Group 100 and considered the main factor of discomfort over 24 hours in 32% of patients in this group. Due to its incidence and importance, this side effect should be investigated and treated routinely. Patients undergoing caesarean section should have access to additional systemic analgesics to improve the quality of analgesia because, regardless of morphine dosage, a large number of patients experience moderate/severe pain.
Conlicts of interest
The authors declare no conflicts of interest.
References
1. Werner MU, Søholm L, Rotbøll-Nielsen P, et al. Does an acute pain service improve postoperative outcome? Anesth Analg. 2002;95:1361-72.
2. Kehlet H, Holte K. Effect of postoperative analgesia on surgical outcome. Br J Anaesth. 2001;87:62-72.
3. Carvalhaes MABL, Corrêa CRH. Identiicação de diiculdades no início do aleitamento materno mediante aplicação de protocolo. J Pediatr. 2003;79:13-20.
4. Pérez-Escamilla R, Maulén-Radovan I, Dewey KG. The association between cesarean delivery and breast-feeding outcomes among Mexican women. Am J Public Health. 1996;86:832-6. 5. Dahl JB, Jeppesen IS, Jørgensen H, et al. Intraoperative and
postoperative analgesic eficacy and adverse effects of intra -thecal opioids in patients undergoing cesarean section with spinal anesthesia: a qualitative and quantitative systematic review of randomized controlled trials. Anesthesiology. 1999; 91:1919-27.
6. Palmer CM, Emerson S, Volgoropolous D, et al. Dose response relationship of intrathecal morphine for postcesarean analgesia. Anesthesiology. 1999;90:437-44.
7. Aldrete JA. The post-anesthesia recovery score revisited. J Clin Anesthesia. 1995;7:89-91.
9. Mikuni I, Hirai H, Toyama Y, et al. Eficacy of intrathecal morphine with epidural ropivacaine infusion for postcesarean analgesia. J Clin Anesth. 2010;22:268-73.
10. Paech MJ, Pavy TJ, Orlikowski CE, et al. Postoperative intraspinal opioid analgesia after caesarean section: a randomised comparison of subarachnoid morphine and epidural pethidine. Int J Obstet Anesth. 2000;9:238-45.
11. Cardoso MM, Carvalho JC, Amaro AR, et al. Small doses of intrathecal morphine combined with systemic diclofenac for postoperative pain control after cesarean delivery. Anesth Analg. 1998;86:538-41.
12. Ganem EM, Módolo NSP, Ferrari F, et al. Efeitos da associação entre pequenas doses subaracnóideas de morina e cetoprofeno venoso e oral em pacientes submetidas à cesariana. Rev Bras Anestesiol. 2003;53:431-9.
13. Girgin NK, Gurbet A, Turker G, et al. Intrathecal morphine in anesthesia for cesarean delivery: dose-response relationship for combinations of low-dose intrathecal morphine and spinal bupivacaine. J Clin Anesth. 2008;20:180-5.
14. Dolin SJ, Cashman JN, Bland JM. Effectiveness of acute postoperative pain management: I. Evidence from published data. Br J Anaesth. 2002;3:409-23.
15. Sarvela J, Halonen P, Soikkeli A, et al. A double-blinded, ran-domized comparison of intrathecal and epidural morphine
for elective cesarean delivery. Anesth Analg. 2002;95: 436-40.
16. Abboud TK, Dror A, Mosaad P. Mini-dose intrathecal morphine for the relief of post-cesarean section pain: safety, eficacy, and ventilatory responses to carbon dioxide. Anesth Analg. 1988;67:137-43.
17. Uchiyama A, Nakano S, Ueyama H, et al. Low dose intrathecal morphine and pain relief following caesarean section. Int J Obstet Anesth. 1994;3:87-91.
18. Gehling M, Tryba M. Risks and side-effects of intrathecal morphine combined with spinal anaesthesia: a meta-analysis. Anaesthesia. 2009;64:643-51.
19. Stoelting RK, Hillier SC. Pharmacology & physiology in anesthetic practice. 4th ed. Philadelphia: Lippincott, Williams & Wilkins; 2006. p. 90-2.
20. Liang CC, Chang SD, Wong SY, et al. Effects of postoperative analgesia on postpartum urinary retention in women undergoing cesarean delivery. J Obstet Gynacol Res. 2010;36: 991-5.
21. Baldini G, Bagry H, Aprikian A, et al. Postoperative urinary retention. Anesthesiology. 2009;110:1139-57.