UNIVERSIDADE TÉCNICA DE LISBOA
INSTITUTO SUPERIOR DE ECONOMIA E GESTÃO
MESTRADO EM FINANÇAS
DETERMINANTS OF LOAN AND LEASE LOSSES EXPERIENCED BY NORTH AMERICAN BANK HOLDING COMPANIES IN 2008
CARLOS MANUEL FRANCO FRANÇA
Supervisor: Professora Doutora Ana Isabel Pires Sarmento Lacerda
Jury:
President: Doutora Maria Teresa Medeiros Garcia, professora auxiliar com agregação do Instituto Superior de Economia e Gestão da Universidade Técnica de Lisboa;
Vogals: Doutora Ana Isabel Pires Lacerda, professora auxiliar convidada do Instituto Superior de Economia e Gestão da Universidade Técnica de Lisboa;
Doutor António Armando Belo de Matos Rebocho Antunes, especialista da área de Finanças.
1
DETERMINANTS OF LOAN AND LEASE LOSSES EXPERIENCED BY NORTH AMERICAN BANK HOLDING COMPANIES IN 2008
Carlos França
M.Sc: Finance
Supervisor: Ana Lacerda
Abstract
This study analyzes the determinants of loan and lease losses experienced by North American Bank Holding Companies in 2008, as a result of the credit crisis initially triggered by residential lending to high-risk borrowers. The performed analysis is based on financial information on Bank Holding Companies obtained from the Federal Reserve System and on macroeconomic data for the United States of America at national, regional and state levels. For both larger and smaller Bank Holding Companies, higher credit losses were associated with higher loan portfolio average spreads and higher shares of construction and land-related loans. The fact that the Bank Holding
Company was audited by one of the “Big Four” auditing firms also proved to be relevant. Larger Bank Holding Companies’ credit losses were also found to be influenced by lower gross domestic product growth rates, higher proportions of restructured loans and higher shares of foreign loans. Larger housing price declines, lower shares of foreign loans and lower provisioning ratios of delinquent loans also resulted in higher credit losses for smaller Bank Holding Companies.
This study also demonstrates that larger and listed Bank Holding Companies incurred in higher credit losses comparatively to smaller and unlisted Bank Holding Companies, respectively. Finally, it was found that Bank Holding Companies developing their activities in the West registered comparatively higher credit losses, while Bank Holding Companies developing their activities in the Northeast incurred in comparatively lower credit losses.
Keywords: Bank Holding Companies, credit losses, subprime crisis, credit crisis, United States of America, 2008
2
DETERMINANTES DAS PERDAS DE CRÉDITO INCORRIDAS PELAS
HOLDINGS BANCÁRIAS NORTE-AMERICANAS EM 2008
Carlos França
Mestrado em: Finanças
Orientador: Ana Lacerda
Resumo
Este estudo analisa os factores determinantes das perdas de crédito incorridas pelas holdings bancárias Norte-Americanas em 2008, como resultado da crise do
mercado de crédito inicialmente despoletada pela concessão de crédito hipotecário de alto risco. A análise efectuada baseia-se em informação financeira das holdings
bancárias obtida junto da Federal Reserve System e em dados macroeconómicos para os Estados Unidos da América, aos níveis nacional, regional e estatal. Conjuntamente para
as holdings bancárias de maior e de menor dimensões, perdas de crédito mais elevadas
estão associadas a carteiras de crédito com spreads médios mais altos e a maiores
proporções de empréstimos para construção e financiamento de terrenos. O facto de a
holding bancária ter sido auditada por uma das “Big Four” também se revelou relevante.
As perdas de crédito das holdings bancárias de maior dimensão foram ainda
influenciadas por menores taxas de crescimento do produto interno bruto, maiores pesos de empréstimos reestruturados e maiores proporções de empréstimos ao estrangeiro. Maiores quedas dos preços dos imóveis para habitação, menores pesos de empréstimos ao estrangeiro e menores níveis de provisionamento do crédito vencido implicaram também maiores perdas de crédito para as holdings bancárias de menor dimensão.
Este estudo demonstra ainda que as holdings bancárias de maior dimensão e as
que são cotadas em bolsa incorreram em perdas de crédito mais elevadas face às
holdings bancárias de menor dimensão e às que não são cotadas em bolsa,
respectivamente. Finalmente, verificou-se que as holdings bancárias que desenvolvem
as suas actividades no Oeste registaram perdas de crédito comparativamente mais elevadas, enquanto as holdings bancárias que desenvolvem as suas actividades no
Nordeste incorreram em perdas de crédito comparativamente menores.
Palavras-chave: holdings bancárias, perdas de crédito, crise do mercado de subprime,
3
Acknowledgments
I’m grateful to my supervisor, Ana Lacerda, for her continued support during the
course of work and for our productive discussions, often at the expense of our personal lives. Working with Ana was a quite rewarding experience since it allowed us to share our views and to clearly improve this study.
I would also like to thank my colleagues at Banco Espírito Santo de Investimento, S.A., especially to those with whom I work closely. In a demanding profession, teamwork is always an important factor to help other team members achieve their personal goals.
Continuous motivation from my family and friends was also a significant tonic, although they were probably the most affected by the fact this study was a rather time-consuming undertaking.
4
Acronyms and Abbreviations
BEA Bureau of Economic Analysis
BHC / BHCs Bank Holding Company / Bank Holding Companies
CAGR Compound Annual Growth Rate
ECB European Central Bank
EUR Euro, the single official currency of the European Union's
Member States that make up the “euro area”
FED Federal Reserve System
FHFA Federal Housing Finance Agency
GBP Great British Pound, the currency of the United Kingdom
GDP Gross Domestic Product
HPI Housing Price Index
IMF International Monetary Fund
MBA Mortgage Bankers Association
NIC National Information Center
NDS National Delinquency Survey
OLS Ordinary Least Squares
OTS Office of Thrift Supervision
UK United Kingdom
USA United States of America
5
Glossary
Billion.References to “billion” used in this study should be understood as one thousand million (i.e., 109).
Credit losses. The definition “credit losses” refers to losses faced by financial
institutions in their loan portfolios. Several proxies can be used to measure credit losses, including proxies based on provisions for loan losses, net charge-offs and flow of new nonperforming loans.
Credit score.A credit score is a number/grade representing a person’s creditworthiness
or the likelihood of that person repaying his or her debts, being primarily based on a
person’s debt-paying history/debt profile and on a statistical analysis of similar borrowers in terms of credit risk profile.
Nonperforming loans. Generally, a loan is considered to be “nonperforming” if payments of interest and principal are past due by 90 days or more or, if those payments are less than 90 days overdue, there are reasons to doubt that owed amounts will be fully recovered.
Owners’ equity in household real estate. Difference between (i) residential real estate assets’ valuation and (ii) related total debt outstanding.
Prime loans. There isn’t a standard definition for what are prime loans and subprime
loans. Conceptually, the former may be defined as mortgage loans carrying lower credit
risk, based on borrowers’ creditworthiness and terms of mortgage contracts.
Subprime loans. As opposed to prime loans, subprime loans are mortgage loans carrying higher credit risk. Generally, subprime loans are granted to borrowers with a previous record of delinquency, a low credit score and high debt service-to-income ratios and as a consequence subprime loans are subject to higher interest rates.
Trillion.References to “trillion” used in this study should be understood as one million
6
Table of Contents
1. Introduction ... 8
2. Evolution of the North American Credit and Housing Markets and the 2007-2009 Credit Crisis ... 10
2.1. Evolution of the North American Credit and Housing Markets ... 10
2.2. The 2007-2009 Credit Crisis ... 20
3. Literature Review ... 26
3.1. External Determinants of Credit Losses ... 26
3.2. Bank-Specific Determinants of Credit Losses ... 30
4. The Methodology and Data ... 36
5. Empirical Results ... 44
5.1. Model Estimation ... 44
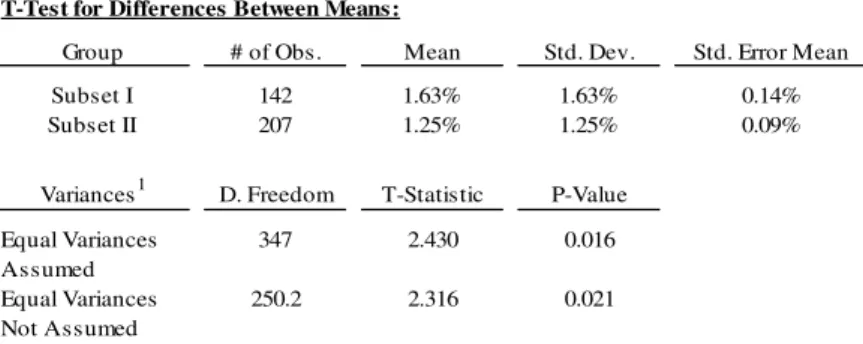
5.2. Hypotheses Tests for Predefined BHCs’ Groups ... 50
6. Conclusions ... 54
7. References ... 56
7
List of Tables
Table 1. Housing market performance by state. ... 12
Table 2. Evolution of delinquency rates for mortgage loans by state. ... 19
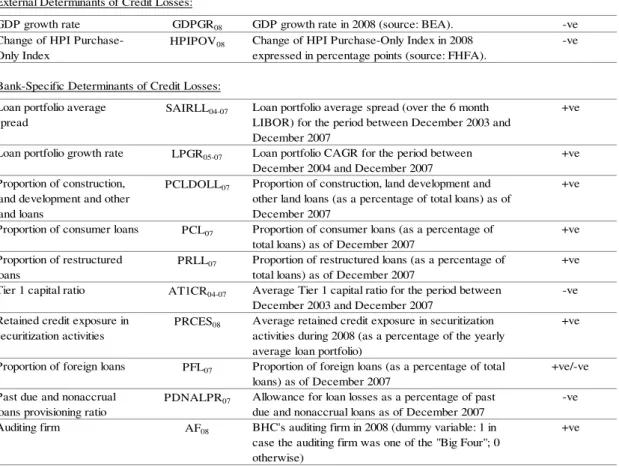
Table 3. Variables used as determinants of BHCs’ credit losses in 2008. ... 38
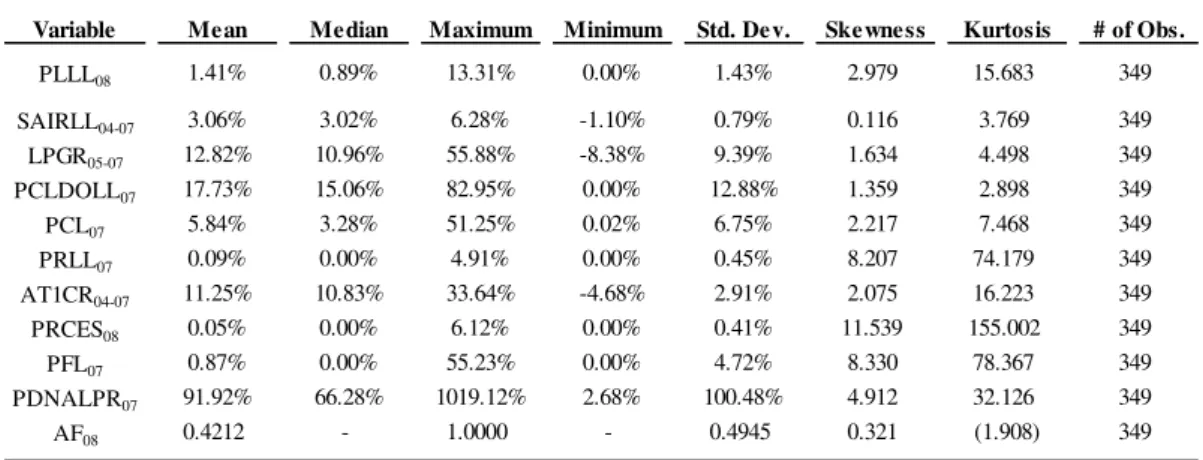
Table 4. Descriptive statistics for the dependent variable and for bank-specific determinants of BHCs’ credit losses in 2008. ... 43
Table 5. Descriptive statistics for external determinants of BHCs’ credit losses in 2008 at national, regional and state levels. ... 43
Table 6. Model estimation results... 45
Table 7. Hypotheses test results – Test #1... 51
Table 8. Hypotheses test results – Test #2... 52
Table 9. Hypotheses test results – Test #3... 53
List of Figures Figure 1. Evolution of the FHFA's HPI Purchase-Only Index (seasonally-adjusted). ... 11
Figure 2. Evolution of total debt outstanding to nonfinancial sectors. ... 14
Figure 3. Evolution of total debt outstanding related to home mortgages. ... 14
Figure 4. Evolution of owners’ equity in household real estate. ... 15
Figure 5. Evolution of charge-off rates for insured United States-chartered commercial banks (seasonally-adjusted). ... 16
Figure 6. Evolution of delinquency rates for insured United States-chartered commercial banks (seasonally-adjusted). ... 17
Figure 7. Evolution of delinquency rates for mortgage loans (seasonally-adjusted). .... 18
Figure 8. Evolution of housing prices and mortgage loans’ delinquency rates across North American states between June 2007 and September 2009. ... 20
Figure 9. Evolution of financial institution failures in the USA between January 2008 and November 2009. ... 25
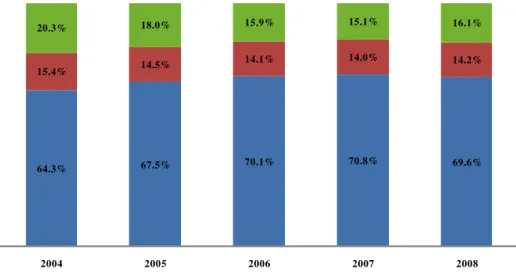
Figure 10. Operating income breakdown (before interest expense). ... 42
8
1. Introduction
Back in the first semester of 2007, few could foresee that the subprime crisis could actually lead to a worldwide financial and economic crisis with an extent not experienced since the Great Depression. In June 2007, Ben Bernanke, FED’s Chairman, said that, up to then, “the troubles in the subprime sector seemed unlikely to seriously spill over to the broader economy or the financial system”1. A month later, Bernanke stated that subprime-related losses could cost up to USD 100 billion which, in case he was correct, would indeed confirm that subprime-related losses had a rather limited impact in the financial system. However, the problems in the subprime sector turned out to be the prelude of a crisis that would have a dramatic impact in the North American financial system and which ultimately dragged the world economy into a severe crisis.
The financial crisis, which deepened in 2008, took its toll in financial institutions, mainly in the USA and Europe. The financial industry suffered significant losses related to its credit exposure and several large capital injections, in order to restore lost equity and to comply with regulatory requirements, occurred.
But, what caused such a crisis? The answer to this question lies in several factors: failures of financial supervision authorities, credit rating agencies’ inability to correctly perceive the risks involved in complex financial instruments, economic agents’ overconfidence and, of course, banks’ lending practices.
This study will focus on the factors that determined North American BHCs’ loan and lease losses in 2008. It will thus discuss the reasons behind the fact that credit loss experience was so dissimilar between North American BHCs, taking into consideration external and bank-specific factors.
The performed analysis is based on a sample comprising 349 BHCs, for which it was obtained historical financial data from the FED, based on regulatory filings that BHCs have to submit periodically2. This data forms the backbone of the bank-specific determinants of credit losses considered in this study and, since it was obtained from a single information source, it mitigates data comparability issues across all BHCs. The data used for external determinants of credit losses was collected from recognized North American public entities (BEA and FHFA) at national, regional and state levels.
1
Speech of Ben Bernanke to the 2007 International Monetary Conference in Cape Town, South Africa (June 5th 2007).
2 BHC data obtained through the NIC, which is a central repository of financial data and institution
9 This study proceeds as follows. Section 2 provides some background information on the recent evolution of the North American credit and housing markets, as well as a brief synopsis of the most relevant events concerning the credit crisis of 2007-2009. Section 2 aims to promote a brief review of the housing market crisis, discussing its importance on the beginning of the financial and economic crisis. In Section 3, a literature review is presented. This section will perform a revision of the determinants of banks’ credit loss experience presented in several relevant studies, separating between external determinants and bank-specific determinants of credit losses.
Section 4 presents the methodology and characterizes the data, describing the external and bank-specific factors considered as determinants of BHCs’ credit losses. The sample of BHCs considered in this study is based on financial institutions classified, as of December 31st 2006, in peers 1, 2 or 3, in accordance with thresholds defined by the FED3.
Section 5 presents and discusses the empirical results for the used BHCs’ sample. A set of hypotheses tests with the purpose of assessing whether credit loss experience in
2008 was similar across predefined BHCs’ groups is also performed.
Finally, in Section 6 the study’s conclusions are presented. In addition, some suggestions for further investigation are also discussed. They are a consequence of some
weakness of this study and/or some questions raised during the study’s preparation.
3 These thresholds are defined according to BHCs’ total assets – Peer 1: total assets of USD 10 billion and
10
2. Evolution of the North American Credit and Housing Markets and the 2007-2009 Credit Crisis
2.1. Evolution of the North American Credit and Housing Markets
It is common to associate the 2007-2009 credit crisis with the preceding housing market boom, which became more pronounced after 1999. The low level of interest rates observed mainly after 2001, as a response to the economic slowdown induced by
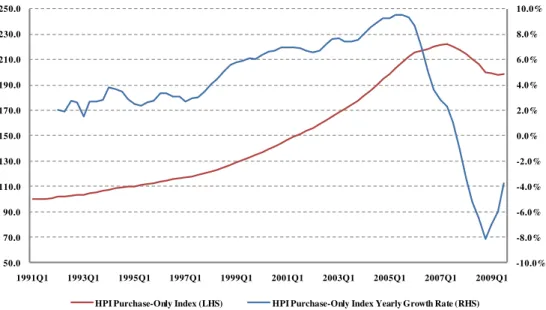
the burst of the technology stocks’ bubble and the terrorist attacks of September 11th 2001, were a catalyst for housing prices appreciation, as North American families accessed to more affordable credit conditions4. According to the FHFA’s HPI Purchase -Only Index5, the North American housing market peaked in the second quarter of 2007, having registered a CAGR of 7.3% between 2001 and 2006, which was substantially above the inflation rate for that same period6. After having reached a peak in the second quarter of 2007, the North American housing market registered a substantial contraction, with prices decreasing 8.2% in 2008 (once again, according to the FHFA’s HPI Purchase-Only Index). Based on data up to September 2009, the housing prices decline pace is decelerating in 20097. However, the correction in the housing market may still not be over.
The Government of the USA implemented several measures to mitigate the effects of the financial and economic crisis on families and companies, as well as to promote the country’s economic recovery. According to the BEA, in the third quarter of 2009 real GDP in the USA increased at an annual rate of 2.8%. This increase was preceded by periods of substantial economic contraction, namely the fourth quarter of 2008 and the first quarter of 2009, when real GDP registered an annual decrease of 5.5% and 6.6%, respectively.
4
The homeownership rate for the USA increased steadily from 66.9% at the end of 1999 to 69.2% in the second quarter of 2004, when homeownership peaked in the USA. As of September 2009, the homeownership rate for the USA was at 67.6% (source: U.S. Census Bureau).
5 The S&P/Case-Shiller Home Price Indices are also well-known among the housing market observers. In
this study, it was decided to use the FHFA’s HPI Purchase-Only Index mainly because apparently the latter has a broader geographic coverage than the S&P/Case-Shiller Home Price Indices. More detail on this matter can be found at http://www.fhfa.gov.
6 Inflation rates for the USA between 2001 and 2006 ranged from a minimum of 1.6% to a maximum of
3.4% (source: Bureau of Labor Statistics, Consumer Price Index for all urban consumers).
7
11 Figure 1 illustrates the evolution of the North American housing market prices, as measured by the FHFA’s HPI Purchase-Only Index, for the period between 1991 and September 2009. Associated with the financial and economic crisis, housing market prices in the USA decreased to levels registered in the first quarter of 2005. As of September 2009, the accumulated depreciation of housing prices since the market peak is approximately 10.7% (based on FHFA’s HPI Purchase-Only Index).
Figure 1. Evolution of the FHFA's HPI Purchase-Only Index (seasonally-adjusted). The left vertical axis illustrates the evolution of the HPI Purchase-Only Index, while the right vertical axis measures the trailing 12 month growth rate of the HPI Purchase-Only Index. Source: FHFA.
-10.0% -8.0% -6.0% -4.0% -2.0% 0.0% 2.0% 4.0% 6.0% 8.0% 10.0%
50.0 70.0 90.0 110.0 130.0 150.0 170.0 190.0 210.0 230.0 250.0
1991Q1 1993Q1 1995Q1 1997Q1 1999Q1 2001Q1 2003Q1 2005Q1 2007Q1 2009Q1
HPI Purchase-Only Index (LHS) HPI Purchase-Only Index Yearly Growth Rate (RHS)
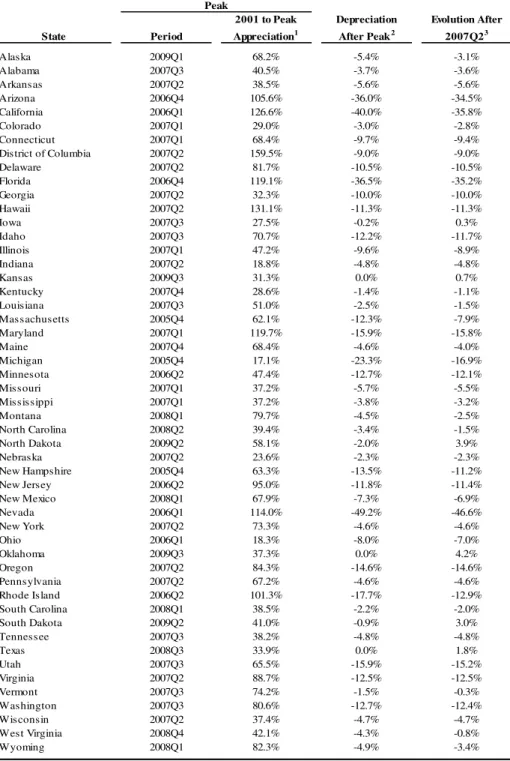
The housing market performance was significantly different across the USA. The states that registered a better performance during the housing market’s boom, registered (in general) the most relevant downward movements afterwards. Table 1 resumes housing market performance by state. The states of Arizona, California, Florida and Nevada were particularly hit in the housing market downturn, as it can be seen in Table 1. For instance, in Nevada housing prices went down to levels not seen since the first quarter of 2002, while in California the financial and economic crisis has led prices to levels near those registered in the first quarter of 20038. The housing market crisis was not so intense in the states of Iowa, Kansas, North Dakota, Oklahoma, South Dakota and Texas. In those states, housing prices were actually able to increase since June 2007
12 (period in which housing market prices peaked in the USA, as measured by the FHFA’s HPI Purchase-Only Index).
Table 1. Housing market performance by state.
Source: Own elaboration based on FHFA’s data.
Peak State Period
2001 to Peak Appreciation1
Depreciation After Peak2
Evolution After 2007Q23
Alaska 2009Q1 68.2% -5.4% -3.1%
Alabama 2007Q3 40.5% -3.7% -3.6%
Arkansas 2007Q2 38.5% -5.6% -5.6%
Arizona 2006Q4 105.6% -36.0% -34.5%
California 2006Q1 126.6% -40.0% -35.8%
Colorado 2007Q1 29.0% -3.0% -2.8%
Connecticut 2007Q1 68.4% -9.7% -9.4%
District of Columbia 2007Q2 159.5% -9.0% -9.0%
Delaware 2007Q2 81.7% -10.5% -10.5%
Florida 2006Q4 119.1% -36.5% -35.2%
Georgia 2007Q2 32.3% -10.0% -10.0%
Hawaii 2007Q2 131.1% -11.3% -11.3%
Iowa 2007Q3 27.5% -0.2% 0.3%
Idaho 2007Q3 70.7% -12.2% -11.7%
Illinois 2007Q1 47.2% -9.6% -8.9%
Indiana 2007Q2 18.8% -4.8% -4.8%
Kansas 2009Q3 31.3% 0.0% 0.7%
Kentucky 2007Q4 28.6% -1.4% -1.1%
Louisiana 2007Q3 51.0% -2.5% -1.5%
Massachusetts 2005Q4 62.1% -12.3% -7.9%
Maryland 2007Q1 119.7% -15.9% -15.8%
Maine 2007Q4 68.4% -4.6% -4.0%
Michigan 2005Q4 17.1% -23.3% -16.9%
Minnesota 2006Q2 47.4% -12.7% -12.1%
Missouri 2007Q1 37.2% -5.7% -5.5%
Mississippi 2007Q1 37.2% -3.8% -3.2%
Montana 2008Q1 79.7% -4.5% -2.5%
North Carolina 2008Q2 39.4% -3.4% -1.5%
North Dakota 2009Q2 58.1% -2.0% 3.9%
Nebraska 2007Q2 23.6% -2.3% -2.3%
New Hampshire 2005Q4 63.3% -13.5% -11.2%
New Jersey 2006Q2 95.0% -11.8% -11.4%
New Mexico 2008Q1 67.9% -7.3% -6.9%
Nevada 2006Q1 114.0% -49.2% -46.6%
New York 2007Q2 73.3% -4.6% -4.6%
Ohio 2006Q1 18.3% -8.0% -7.0%
Oklahoma 2009Q3 37.3% 0.0% 4.2%
Oregon 2007Q2 84.3% -14.6% -14.6%
Pennsylvania 2007Q2 67.2% -4.6% -4.6%
Rhode Island 2006Q2 101.3% -17.7% -12.9%
South Carolina 2008Q1 38.5% -2.2% -2.0%
South Dakota 2009Q2 41.0% -0.9% 3.0%
Tennessee 2007Q3 38.2% -4.8% -4.8%
Texas 2008Q3 33.9% 0.0% 1.8%
Utah 2007Q3 65.5% -15.9% -15.2%
Virginia 2007Q2 88.7% -12.5% -12.5%
Vermont 2007Q3 74.2% -1.5% -0.3%
Washington 2007Q3 80.6% -12.7% -12.4%
Wisconsin 2007Q2 37.4% -4.7% -4.7%
West Virginia 2008Q4 42.1% -4.3% -0.8%
Wyoming 2008Q1 82.3% -4.9% -3.4%
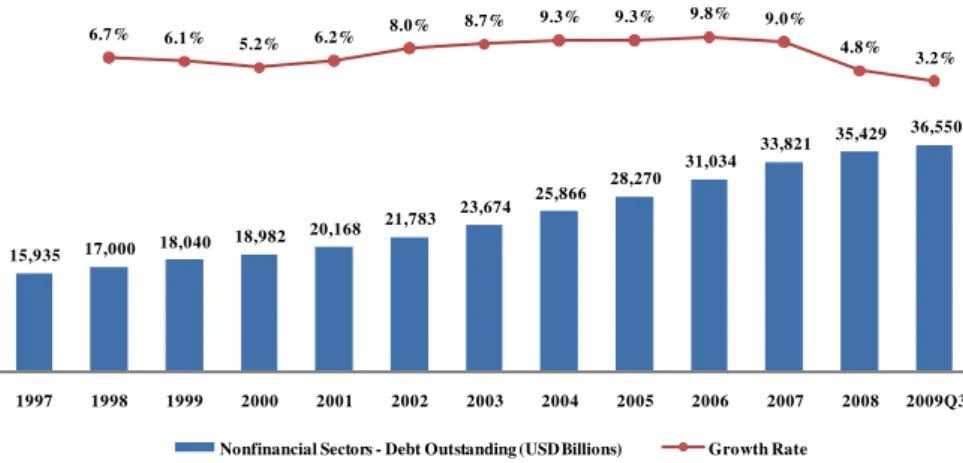
13 Similarly to the housing market, the USA also experienced a significant credit expansion in the years that preceded the financial and economic crisis, especially after 2001. Once again, this was mainly driven by lower interest rates. Between 1997 and 2006, total debt outstanding to nonfinancial sectors expanded at a CAGR of 7.7% (CAGR of 9.0% for the period 2001-2006)9. Credit to residential real estate enjoyed even more significant growth rates during that period, having total debt outstanding related to home mortgages registered a CAGR of 11.5% between 1997 and 2006 (CAGR of 13.0% for the period 2001-2006) 10.
From 2007 onwards, banks clearly changed their lending practices as a response to the developments of the financial and economic crisis, being particularly felt in the residential real estate sector. In fact, overall credit growth in the nonfinancial sectors experienced a relevant slowdown, while total debt outstanding related to home mortgages actually declined in 2008 and up to the third quarter of 2009.
Figures 2 and 3 illustrate the evolution of both total debt outstanding to nonfinancial sectors and total debt outstanding related to home mortgages, respectively, for the period between 1997 and the third quarter of 2009. Those figures show that credit lending has clearly decreased after 2007. It is interesting to note that credit growth in 2008 and 2009 (up to the third quarter) went significantly below the observed levels during the last recession (2001-2002), notwithstanding the efforts of the United States Government in trying to make more lending available to economic agents. The effects were particularly severe in the residential real estate sector, as it can be seen in Figure 3.
14
Figure 2. Evolution of total debt outstanding to nonfinancial sectors.
Source: The FED, “Flow of Funds Accounts of the United States” (3rd quarter of 2009).
15,935 17,000 18,040 18,982
20,168 21,783 23,674
25,866 28,270
31,034 33,821
35,429 36,550 6.7% 6.1% 5.2% 6.2% 8.0% 8.7%
9.3% 9.3% 9.8% 9.0%
4.8% 3.2%
1997 1998 1999 2000 2001 2002 2003 2004 2005 2006 2007 2008 2009Q3
Nonfinancial Sectors - Debt Outstanding (USD Billions) Growth Rate
Figure 3. Evolution of total debt outstanding related to home mortgages.
Source: The FED, “Flow ofFunds Accounts of the United States” (3rd quarter of 2009).
3,903 4,259 4,683
5,108 5,660
6,414 7,219
8,248 9,357
10,417 11,113 11,005 10,852 9.1% 10.0% 9.1% 10.8%
13.3% 12.5% 14.3% 13.4% 11.3% 6.7%
-1.0% -1.4%
1997 1998 1999 2000 2001 2002 2003 2004 2005 2006 2007 2008 2009Q3
Home Mortgages - Debt Outstanding (USD Billions) Growth Rate
15
Figure 4.Evolution of owners’ equity in household real estate.
Source: The FED, “Flow of Funds Accounts of the United States” (3rd quarter of 2009).
0.0% 10.0% 20.0% 30.0% 40.0% 50.0% 60.0% 70.0%
-5,000 10,000 15,000 20,000 25,000 30,000 35,000
1997 1998 1999 2000 2001 2002 2003 2004 2005 2006 2007 2008 2009Q3
Household Real Estate (USD Billions) Owners' Equity in Household Real Estate (USD Billions) Owners' Equity as a Percentage of Household Real Estate
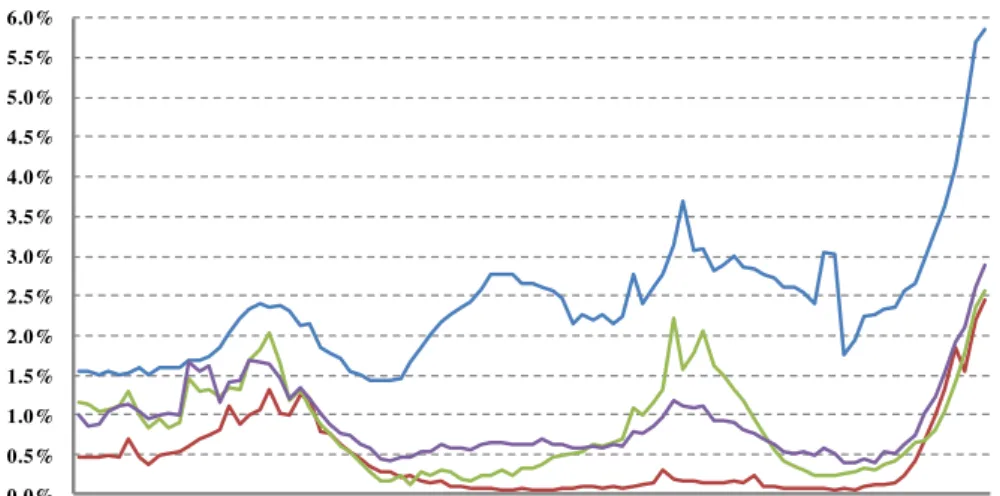
As in any other economic recession, banks’ assets quality fell considerably. Charge-offs (loans removed from banks’ balance sheets and charged against loan loss reserves) and delinquency rates (figure which accounts for loans facing repayment difficulties still registered in banks’ balance sheets) increased dramatically, especially since the beginning of 2008. This fact illustrates that difficulties initially felt in the real estate sector rapidly spread to the remainder of the economy and to less riskier borrowers. Although the economy of the USA presented signs of recovery in the third quarter of 2009, banks still faced an increase in charge-offs and delinquency rates in that same period, in general to record levels for more than 20 years, according to data from the FED. Figures 5 and 6 depict the evolution of charge-off rates and delinquency rates, respectively, for the period between 1987 and September 2009.
Consumer loans were the most charged-off business segment by North American banks in the context of the 2007-2009 credit crisis. In the third quarter of 2009, it was registered an annualized net of recoveries charge-off rate of approximately 5.9% for consumer loans, well above remaining presented business segments in Figure 5. It is also interesting to note that for real estate loans the annualized charge-off rate in the third quarter of 2009 achieved a level (circa 2.4%) corresponding to almost the double of the worst charge-off level verified in past crises for the last 23 years. This is clearly
16 According to Figure 6, delinquency rates have also increased substantially, especially from the last quarter of 2007 onwards. With the exception of C&I loans11, presented business segments achieved record levels for delinquency rates for more than 20 years. In order to better appreciate the impact of the 2007-2009 credit crisis in North
American banks’ assets quality, the average delinquency rate for total loans and leases between 1987 and September 2009 stood at approximately 3.3%, corresponding to less than half of the delinquency rate observed in the third quarter of 2009, which has reached to 7.0%. Even during the recession of 1990-1991, when the previous highest delinquency rate since 1987 was reached, total loans and leases’ delinquency rate didn’t surpass 6.2%.
Figure 5. Evolution of charge-off rates for insured United States-chartered commercial banks (seasonally-adjusted).
Charge-offs are measured net of recoveries as an annualized percentage of average loans. Source: The FED.
0.0% 0.5% 1.0% 1.5% 2.0% 2.5% 3.0% 3.5% 4.0% 4.5% 5.0% 5.5% 6.0%
1987Q1 1989Q1 1991Q1 1993Q1 1995Q1 1997Q1 1999Q1 2001Q1 2003Q1 2005Q1 2007Q1 2009Q1 Real Estate Loans Consumer Loans C&I Loans Total Loans and Leases
17
Figure 6. Evolution of delinquency rates for insured United States-chartered commercial banks (seasonally-adjusted).
Delinquency rates consider past due loans for thirty days or more and still accruing interest as well as nonaccruing loans, and are measured as a percentage of end-of-period loans. Source: The FED.
0.0% 1.0% 2.0% 3.0% 4.0% 5.0% 6.0% 7.0% 8.0% 9.0% 10.0%
1987Q1 1989Q1 1991Q1 1993Q1 1995Q1 1997Q1 1999Q1 2001Q1 2003Q1 2005Q1 2007Q1 2009Q1 Real Estate Loans Consumer Loans C&I Loans Total Loans and Leases
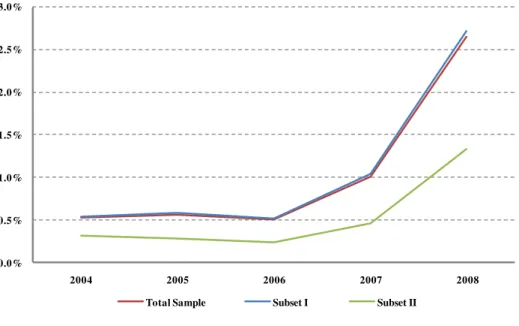
Focusing solely in mortgage loans, and based on MBA’s NDS, it is clear that delinquency rates have increased steadily from the fourth quarter of 2007 onwards. Delinquency rates for subprime loans have risen to approximately 26.4% as of September 2009, while delinquency rates for prime loans have risen to circa 6.8% as of that same date. The credit crisis turned out to have such severe consequences that even
prime loans’ delinquency rates have almost tripled compared to the average levels
18
Figure 7. Evolution of delinquency rates for mortgage loans (seasonally-adjusted). Delinquency rates consider past due loans for thirty days or more and are calculated as a percentage of the number of loans serviced (NDS reports do not collect information on the amounts of loans serviced). Source: MBA, NDS reports12.
0.0% 2.0% 4.0% 6.0% 8.0% 10.0% 12.0% 14.0% 16.0% 18.0% 20.0% 22.0% 24.0% 26.0% 28.0%
2002Q4 2003Q2 2003Q4 2004Q2 2004Q4 2005Q2 2005Q4 2006Q2 2006Q4 2007Q2 2007Q4 2008Q2 2008Q4 2009Q2
All Loans Prime Loans Subprime Loans
Not surprisingly, the states in which occurred the largest housing price declines were also generally the ones with the largest increases in delinquency rates. Table 2 presents the evolution of delinquency rates by state between June 2007 (peak for the North American housing prices) and September 2009. According to the performed analysis, delinquency rates in the states of Arizona and Nevada have more than tripled in the covered period, whilst in California it has almost tripled.
12 NDS reports are estimated to cover approximately 85% of the outstanding first-lien residential
19
Table 2. Evolution of delinquency rates for mortgage loans by state.
Delinquency rates consider past due loans for thirty days or more, and are calculated as a percentage of the number of loans serviced. Source: MBA, NDS reports.
All Loans Prime Loans Subprime Loans State 2007Q2 2009Q3 2007Q2 2009Q3 2007Q2 2009Q3
Alaska 3.2% 5.1% 2.0% 3.4% 6.8% 11.7%
Alabama 6.2% 11.1% 3.5% 7.4% 16.8% 30.7%
Arkansas 5.4% 9.0% 2.8% 5.8% 15.6% 27.2%
Arizona 3.6% 11.9% 1.8% 9.4% 10.2% 27.1%
California 3.6% 10.5% 1.9% 8.8% 12.6% 26.0%
Colorado 3.9% 6.7% 1.9% 4.3% 11.0% 19.1%
Connecticut 4.1% 8.7% 2.1% 5.6% 14.2% 28.2%
District of Columbia 3.7% 7.4% 2.2% 5.6% 13.7% 22.9%
Delaware 4.0% 8.6% 2.4% 5.5% 12.7% 25.3%
Florida 5.2% 12.2% 2.9% 9.5% 14.0% 24.2%
Georgia 6.9% 12.9% 3.5% 8.5% 17.2% 29.3%
Hawaii 2.4% 6.7% 1.4% 4.9% 8.6% 21.1%
Iowa 4.2% 6.9% 2.6% 4.6% 14.5% 25.1%
Idaho 3.1% 7.8% 1.6% 5.7% 10.2% 23.5%
Illinois 5.1% 10.5% 2.5% 7.0% 15.3% 28.9%
Indiana 7.0% 11.8% 3.6% 7.2% 16.0% 28.7%
Kansas 4.6% 7.5% 2.5% 4.9% 13.1% 23.5%
Kentucky 5.7% 9.6% 3.0% 5.8% 15.2% 25.2%
Louisiana 7.3% 10.9% 4.0% 6.8% 17.7% 27.6%
Massachusetts 4.5% 9.3% 2.6% 6.7% 17.0% 32.2%
Maryland 4.2% 10.0% 2.1% 6.9% 13.8% 29.3%
Maine 4.7% 8.8% 2.6% 6.1% 14.6% 25.1%
Michigan 7.6% 12.6% 4.0% 8.3% 20.8% 33.5%
Minnesota 3.9% 7.0% 2.2% 5.2% 14.6% 23.8%
Missouri 5.6% 9.4% 2.8% 5.9% 17.2% 29.6%
Mississippi 9.3% 14.4% 4.9% 9.3% 21.5% 34.9%
Montana 2.6% 5.3% 1.6% 3.7% 9.9% 23.2%
North Carolina 5.5% 9.7% 3.0% 6.3% 15.5% 27.7%
North Dakota 2.8% 4.0% 1.9% 2.8% 10.9% 20.6%
Nebraska 4.3% 6.4% 2.5% 4.2% 13.1% 22.6%
New Hampshire 4.3% 8.5% 2.5% 6.1% 15.1% 29.0%
New Jersey 4.3% 9.0% 2.5% 6.4% 13.5% 25.3%
New Mexico 3.7% 7.8% 2.1% 5.5% 10.9% 22.8%
Nevada 4.4% 14.0% 2.4% 12.0% 11.6% 26.4%
New York 4.5% 8.8% 2.6% 5.9% 12.1% 25.6%
Ohio 6.7% 10.7% 3.5% 6.6% 15.8% 26.6%
Oklahoma 5.3% 8.4% 2.8% 5.1% 12.5% 22.3%
Oregon 2.4% 6.6% 1.4% 4.8% 8.7% 21.9%
Pennsylvania 5.6% 9.2% 3.0% 5.7% 15.0% 26.5%
Rhode Island 5.0% 10.3% 2.6% 7.5% 16.5% 30.2%
South Carolina 5.7% 9.9% 3.3% 6.8% 15.6% 26.9%
South Dakota 3.0% 4.5% 2.0% 2.9% 12.0% 21.0%
Tennessee 6.6% 11.1% 3.0% 6.6% 17.3% 30.4%
Texas 6.5% 9.8% 2.9% 5.3% 14.7% 25.2%
Utah 3.5% 8.4% 1.9% 6.0% 8.6% 23.6%
Virginia 3.7% 7.7% 1.9% 5.2% 13.4% 26.5%
Vermont 3.2% 5.5% 2.0% 4.1% 13.0% 24.3%
Washington 2.6% 6.9% 1.4% 4.8% 9.4% 25.1%
Wisconsin 4.0% 7.7% 2.2% 5.1% 14.7% 27.4%
West Virginia 6.8% 10.3% 4.5% 7.3% 18.1% 27.0%
Wyoming 2.5% 5.5% 1.4% 3.3% 9.4% 21.7%
20
Figure 8. Evolution of housing prices and mortgage loans’ delinquency rates across
North American states between June 2007 and September 2009.
Each dot refers to a North American state. The equation and the R-squared displayed on the chart are for the linear regression between the change of the FHFA’s HPI Purchase -Only Index and the evolution of mortgage loans’ delinquency rate. Source: Own elaboration based on data provided by FHFA and MBA.
y = -0.1298x + 0.0312 R² = 0.7442
0.0% 2.0% 4.0% 6.0% 8.0% 10.0% 12.0%
-50.0% -40.0% -30.0% -20.0% -10.0% 0.0% 10.0%
D
el
in
q
u
en
cy
R
ate
Evol
u
ti
on
Be
tw
ee
n
2007Q
2
-2009Q
3
HPI - Purchase-Only Index: Change Between 2007Q2 - 2009Q3
In this section it was presented a brief analysis of the recent evolution of the North American credit and housing markets, as well as the existing relation between housing
prices’ depreciation and the increase of mortgage loans’ delinquency rates. In the next section it will be presented a brief synopsis of the most relevant facts concerning the credit crisis of 2007-2009.
2.2. The 2007-2009 Credit Crisis
21 information, with special focus on the analysis performed by the Federal Reserve Bank of St. Louis13.
Time Period Events
1st semester of 2007
February 2007: HSBC announces that its credit losses for 2006 would be 20% higher than initially expected, as a result of housing market difficulties in the USA. This constituted the first major sign of difficulties in the North American subprime market. Also in February 2007, the Federal Home Loan Mortgage Corporation
(“Freddie Mac”) announces that it would cease buying riskier
subprime mortgages;
April 2007: New Century Financial, one of the top subprime lenders in the USA, files for protection from creditors (“Chapter 11”);
June 2007: Bear Stearns suspends redemptions in two investment funds.
2nd semester of 2007
August 2007: American Home Mortgage, once one of the Top 10 mortgage lenders in the USA, files for Chapter 11. European bank BNP Paribas suspends three investment funds worth EUR 2 billion, due to problems in the North American subprime market. As a result, the credit markets freeze, which leads the ECB to inject EUR 95 billion into the euro area banking system;
September 2007: The Bank of England is authorized to provide liquidity support for Northern Rock, UK’s fifth-largest mortgage lender, after the bank’s request for emergency financial support;
October 2007: Ben Bernanke warns housing market crisis will lower GDP growth forecasts for the USA in 2008;
December 2007: Joint action of the FED, the ECB and from the central banks of Canada, Switzerland and UK, with the purpose of stabilizing the credit markets.
1st semester of 2008
January 2008: The World Bank projects global economic growth to slow down as a result of the credit crisis. Global stock markets fall
13 “The Financial Crisis: A Timeline of Events and Policy Actions”. Document available at
22
Time Period Events
sharply and as a response the FED lowers interest rates by 75 basis points, which was followed by an additional interest rate cut of 50 basis points only a few days later. Still in January 2008, Bank of America announces the acquisition of Countrywide Financial, a large North American lender that was facing financial difficulties since the beginning of the second semester of 2007;
February 2008: The UK’s Government announces the
nationalization of Northern Rock;
March 2008: JPMorgan Chase announces the acquisition of Bear Stearns, at that time the fifth-largest investment bank in the USA, in a deal backed by the Federal Reserve Bank of New York;
April 2008: The IMF estimates potential losses from the credit crisis to reach at least USD 945 billion and alerts to the growing contagion to other sectors.
2nd semester of 2008
July 2008: The Government of the USA announces several measures to support Freddie Mac and the Federal National
Mortgage Association (“Fannie Mae”). Still in July 2008, IndyMac Bank, F.S.B. is closed by the OTS;
23
Time Period Events
Wachovia Corporation. In Europe, Fortis was partially nationalized in a joint move by the Netherlands, Belgium and Luxembourg, Bradford & Bingley was nationalized by the UK’s Government and Belgium, France and Luxembourg intervened in Dexia;
October 2008: Governments worldwide announce plans to intervene in the financial system. In the USA, the House of Representatives approves a USD 700 billion plan (known as the “Troubled Asset
Relief Program”), with the purpose of acquiring toxic assets from financial institutions and which included a USD 250 billion facility to acquire stakes in North American banks in the form of preferred stock investments. Capital injections in banks worldwide continue: the UK’s Government invests a total of GBP 37 billion in Royal Bank of Scotland, Lloyds TSB and HBOS. Iceland, one of the most severely hit countries by the credit crisis of 2007-2009, takes control of its banking system, by nationalizing the country’s most relevant banks. Back to the USA, Wells Fargo acquires Wachovia
Corporation, thus frustrating Citigroup’s move in the end of the
previous month, and PNC Financial Services Group Inc. acquires National City Corporation;
November 2008: The IMF approves a USD 16.4 billion loan to Ukraine and a USD 2.1 billion loan to Iceland. The Government of the USA injects USD 20 billion in Citigroup, after its shares lost more than 60% of its value in only one week. Additionally, the FED announces a USD 800 billion plan aimed to stabilize the financial system and to make more lending available to consumers, while the European Commission presents a EUR 200 billion economic recovery plan. Still in November 2008, the Federal Reserve Board approves the acquisition of Merrill Lynch by Bank of America;
24
Time Period Events
intervenes in GMAC (the financial arm of General Motors). 1st semester
of 2009
January 2009: The Irish Government nationalizes the Anglo Irish Bank, while the Government of the USA invests a further USD 20 billion in Bank of America;
March 2009: The Government of the USA invests a further USD 30 billion in AIG and the FED announces that it will buy approximately USD 1.2 trillion worth of debt in order to stimulate
lending and promote the country’s economic recovery;
April 2009: G20 leaders reach an agreement, with measures worth USD 1.1 trillion, to help global economic recovery. The IMF raises its global estimate of losses related to the 2007-2009 credit crisis to USD 4 trillion and warns that banks worldwide may need USD 1.7 trillion in additional capital injections;
May 2009: The results of the stress tests performed on North American banks indicate that ten of the largest 19 banks need a total of approximately USD 75 billion in extra capital;
June 2009: General Motors files for Chapter 11. On a more positive tone, ten of the largest banks that received capital injections from the Government of the USA announce that they will be able to return the funds previously received. With the purpose of preventing future financial crises, the Government of the USA announces a reform of the banking system regulation.
2nd semester of 200914
July 2009: General Motors gets restructured and emerges from bankruptcy protection. The Government of the USA will own 61% of the Company;
August 2009: Fannie Mae requests an additional USD 10.7 billion from the Treasury Department;
November 2009: CIT Group, Inc. files for Chapter 11 and Fannie Mae requests an additional USD 15 billion from the Treasury Department.
25 The 2007-2009 credit crisis had a severe and worldwide impact, both in terms of economic performance and financial system regulation. The banking system underwent a profound change – in the USA several banks went bankrupt or, otherwise, were acquired in order to avoid their collapse, the Government took control of several financial institutions and the investment banking industry ceased to operate and/or exist as it was long been known. Financial and economic conditions deteriorated mainly after
Lehman Brothers’ bankruptcy, which had a tremendous effect in economic agents’
confidence. Governments worldwide announced large intervention plans in order to mitigate the effects of the financial and economic crisis, which consequently led to an escalation of their public deficits and of their public debt stocks.
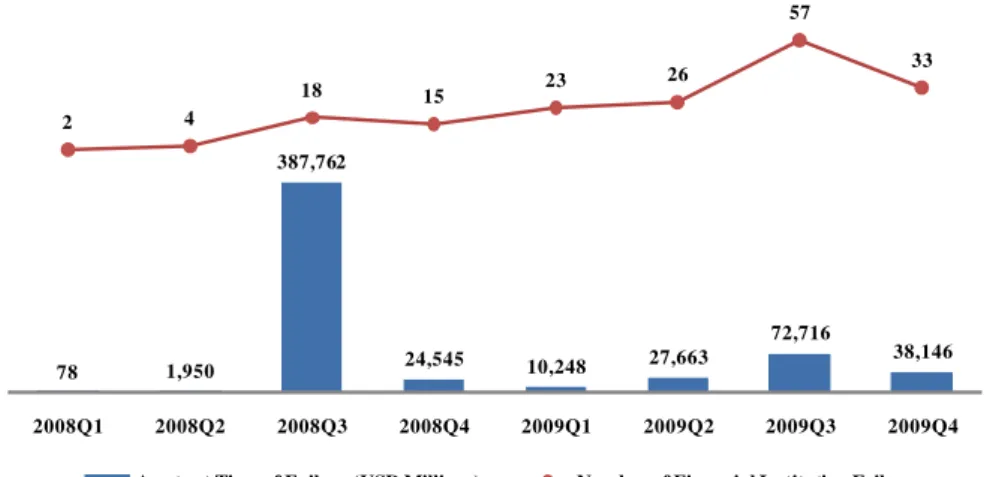
Figure 9 depicts the evolution of financial institution failures in the USA between January 2008 and November 2009, considering commercial banks, thrifts and credit unions. The third quarter of 2008 is clearly influenced by the failure of the Washington Mutual Bank, which had total assets of approximately USD 353,070 million15. According to data obtained from iBanknet, between January 2008 and November 2009 it was registered a total of 178 financial institution failures, with corresponding total assets of USD 563,109 million. Figure 9 shows that financial institution failures increased substantially from the third quarter of 2008 onwards.
Figure 9. Evolution of financial institution failures in the USA between January 2008 and November 2009.
Figures include commercial banks, thrifts and credit unions. Source: iBanknet.
78 1,950
387,762
24,545 10,248 27,663
72,716
38,146
2 4
18 15 23 26
57
33
2008Q1 2008Q2 2008Q3 2008Q4 2009Q1 2009Q2 2009Q3 2009Q4 Assets at Time of Failure (USD Millions) Number of Financial Institution Failures
15 This figure includes both Washington Mutual Bank (with total assets of USD 307,022 million) and
26
3. Literature Review
The determinants of credit losses used in its empirical modeling can be generally classified into two major classes – external and bank-specific factors. External factors are mainly related to economic indicators, such as GDP growth and changes in the unemployment rate, while bank-specific factors used to model credit losses include net interest margin, cost-to-income ratio and loan portfolio growth. Researchers tend to use both external and bank-specific factors as determinants of credit losses, based on the assumption that each bank’s performance is dependent of intrinsic factors, but also of potential systematic issues arising from macroeconomic conditions.
3.1. External Determinants of Credit Losses
Hess, Grimes and Holmes (2008a) used GDP growth and both the level and change of unemployment rate as external macroeconomic factors to model credit losses of Australasian banks for the period between 1980 and 2005. While all factors did have
the expected effects on banks’ credit losses with a lag of one year (i.e., banks’ credit losses increased with lower GDP growth, with higher levels of unemployment rates and positive changes in unemployment rates), they have concluded that the unemployment rate level was the most relevant external determinant of Australasian banks’ credit losses. GDP growth and change of unemployment rate were highly negatively correlated and as a consequence those variables weren’t included jointly in the same regression. The authors also used as external determinants of Australasian banks’ credit losses the return on the national share index, changes in the housing price index and changes in the consumer price index16. The first two variables were found to have a negative impact on banks’ credit losses, i.e., higher returns on the national share index and increases in the housing price index were associated with lower credit losses. Additionally, the return on the national share index had a greater explanatory power of Australasian banks’ credit losses than changes in the housing price index. Although with limited significance, changes in the consumer price index were found to have a positive association with credit losses, having estimation results also shown that the
16 The return on the national share index and changes in the housing price index were used as proxies for
27 effects of this external factor tended to increase in time (i.e., contemporaneous changes had a reduced impact on credit losses, but it tended to increase with longer lags).
GDP growth and change of the unemployment rate were also used by Głogowski (2008) as external determinants of Polish banks’ credit losses for the period between 1997 and 2006, having been concluded that those factors had the expected effects on credit losses. Additionally, the author analyzed if Polish banks’ credit losses could also be influenced by adverse changes in the exchange rate, due to associated higher costs of loan repayments to households17. It was concluded that changes in the exchange rate
didn’t influence credit losses, even when it is taken into consideration each bank’s share of foreign exchange loans. Głogowski (2008) also used as external determinants real interest rates and the employment level, having found evidence that an increase of the former and a decrease of the latter were associated with higher credit losses.
Quagliariello (2004) used static and dynamic panel models in order to study Italian banks for the period between 1985 and 2002, in terms of loan loss provisions and flow of new nonperforming loans. The author found that Italian banks tend to reflect smaller credit losses during phases of economic expansion, but still GDP growth is only significant if lagged by one and two years (being the latter’s coefficient larger), thus suggesting that economic cyclical impacts tend to be delayed. A negative association between credit losses and unemployment rate changes was found by the author, suggesting that an increase of the unemployment rate would result in lower credit losses. This finding was unexpected and according to the author a possible explanation for such could be a potential overlapping between unemployment rate changes and GDP growth in what concerns to the capture of the business cycles’ effects on credit losses.
Quagliariello (2004) also used as external determinants of credit losses interest rates on long term Treasury bonds, stock market’s level of appreciation or depreciation
and the spread between loans and deposits’ interest rates for the Italian banking system.
It was found a negative association between credit losses and long term interest rates of Treasury bonds, thus suggesting that this variable is likely to be a proxy for the business cycle, since interest rates are normally higher in phases of economic expansion, when credit losses are typically lower18. The stock market’s level of appreciation or
17 Polish banks have a significant share of foreign exchange loans to households, so the author analyzed
the potential impact related to that fact.
18
28 depreciation was used as a proxy for financial markets’ conditions. The author found a
“boom and bust pattern”, which means that a continued upward market phase precedes a steep decline of asset prices. Accordingly, the author found different signs for the lagged and the contemporaneous coefficients (the former assumed a negative sign while the latter had a positive one). Lagged interest rate spreads between loans and deposits had a positive association with credit losses, implying that larger spreads between loans and deposits are symptomatic of increased default risk (and thus of higher credit losses) and/or anticipate economic cyclical downturns. It is worth mentioning that, as stated before, this variable was calculated for the Italian banking system and therefore the used methodology doesn’t consider each bank’s specific conditions. Quagliariello (2004) used exactly the same determinants to study the flow of new nonperforming loans, having found evidence of significant positive associations between the dependent variable and interest rates on long term Treasury bonds and unemployment rate changes. Estimation results also demonstrated that the flow of new nonperforming loans had significant negative associations with GDP growth and interest rate spreads between loans and deposits.
The determinants of credit losses were also studied by Pain (2003), for a sample of UK’s commercial and mortgage banks for the period between 1978 and 2000. It was found evidence of a negative association between GDP growth (both domestic and world GDP growth for commercial banks and domestic GDP growth only for mortgage banks) and credit losses, while the unemployment rate was found to be not significant. Real interest rates were found to have a positive association with credit losses, thus in accordance with Głogowski’s (2008) conclusions. Influence on credit losses of capital and income gearing in the household and corporate sectors were also studied, having these factors found to be not significant19. The author also tested the statistical significance of asset price levels (foreign exchange rates, equity prices and real estate prices), having those variables also proved to be not significant.
In order to model nonperforming loans of Spanish banks for the period between 1984 and 2002, Jiménez and Saurina (2006) used as external determinants of nonperforming loans20 GDP growth and real interest rates. The authors found a negative
19 The author obtained evidence that if capital and income gearing in the household and corporate sectors
were to be significant, then GDP growth and real interest rates would become not statistically significant.
20
29 influence of GDP growth and a positive effect of real interest rates (i.e., the stock of nonperforming loans increases with lower GDP growth and higher real interest rates).
Salas and Saurina (2002) used panel data to analyze the determinants of nonperforming loans of Spanish commercial and savings banks for the period between 1985 and 1997. The authors found a significant negative association between GDP growth rate (both contemporaneous and one-year lagged coefficients) and nonperforming loans. It was also used as external determinants of the dependent variable the families’ indebtedness ratio (as measured by families’ total liabilities over GDP) and firms’ debt-to-equity ratio (as measured by firms’ total liabilities over their respective market values). Both variables were found to be significant only for savings banks and their impact on nonperforming loans was dissimilar – the families’
indebtedness ratio had a negative influence on nonperforming loans, while the firms’
debt-to-equity ratio had a positive effect on the dependent variable. The authors
expected both variables’ coefficients to be positive and therefore the negative sign for
the families’ indebtedness ratio was somewhat difficult to interpret. The authors
suggested that it could be due to the fact that families’ debt is normalized by GDP and
as a consequence it could be capturing the effects of the economic cycle. Finally, it was introduced a dummy variable with the purpose of analyzing the impact of regulatory changes introduced in 198821. As expected by the authors, it was found evidence of a positive association between this variable and nonperforming loans (which was tested for savings banks only).
Credit loss experience was also studied by Sinkey and Greenawalt (1991), considering a sample of 154 North American commercial banks for the period between 1984 and 1987. Two model specifications were considered by the authors – a model with a broad definition of credit losses (which considered as credit losses the sum of net charge-offs and nonperforming loans) and a model with a narrower definition of credit losses (which considered as credit losses net charge-offs only).
Only one external determinant of credit losses was used by Sinkey and Greenawalt (1991) –each bank’s location, in order to account for economic differences across regions. The analysis was performed using dummy variables, having the authors concluded for the existence of significant credit loss differences for banks of two
21Spanish central bank’s regulation 22/1987 introduced
30 regions of the USA in comparison to money-center banks for the model with a broad definition of credit losses (Southwest banks had higher credit losses in comparison to money-center banks, while Midwest banks’ credit losses were lower). For the model with a narrower definition of credit losses, estimation results revealed significant credit loss differences between money-center banks and Southwest banks only.
3.2. Bank-Specific Determinants of Credit Losses
As bank-specific determinants of credit losses, Hess, Grimes and Holmes (2008a) considered each bank’s share of total private sector loans, pricing of risks as measured by net interest margins, bank assets’ growth rate, cost-to-income ratio and earnings before taxes and provisions (the latter variable was used as a proxy to study banks’ potential income smoothing practices). It was found a positive association between
banks’ sizes (as measured by each bank’s share of total private sector loans) and credit losses, thus indicating higher credit losses for larger banks. Nevertheless, the coefficient of this variable was generally significant only for the full sample of Australasian banks, i.e., for the country sub-samples this variable tended to be not significant.
Higher net interest margins were found to have a negative association with credit losses for the current and the two-year lagged terms, although generally not a significant one, since the two-year lagged term was the only one to be statistically significant, and only for the full sample of Australasian Banks (i.e., for the country sub-samples it proved to be not significant, thus demonstrating that net interest margins seemed to have little explanatory power). Bank assets’ growth rates tended to be statistically significant only for lagged terms (generally, for lags of two or more years), having the authors found a positive association between lagged terms of this variable and credit losses (current terms’ coefficients of bank assets’ growth rates were negative, though not significant). Cost-to-income ratio was used as a cost efficiency proxy. It was found a significant positive association between credit losses and banks’ current cost-to-income ratios and negative coefficients for cost-to-income ratios’ lagged terms (although the latter were generally not significant). Therefore the authors concluded that high and increasing cost-to-income ratios were associated with higher credit losses22.
22
31 Concerning earnings before taxes and provisions, Hess, Grimes and Holmes (2008a) found evidence of an income smoothing pattern, given the positive association between the current terms of this variable and credit losses. Additionally, the lagged
terms’ coefficients of earnings before taxes and provisions tended to be negative and frequently significant, which may indicate that credit losses may be recognized later in case of low earnings in a particular year23.
In his study, Głogowski (2008) has used as bank-specific determinants of credit losses in his model final specifications each bank’s capital adequacy ratio’s deviation from sector median, the share of housing loans in loans to households, the share of loans to households in total loans to the nonfinancial sector, loan growth rate’s deviation from sector mean and dummy variables to account for each bank’s business profile, seasonality and regulatory changes adopted in 2004 and 200524. It was found that higher credit losses were associated to banks with lower capital levels (although its influence proved to be significant only for short time lags). This variable was used in order to test the moral hazard hypothesis, i.e., the possibility that banks with lower capital ratios may lend to lower creditworthiness borrowers with the purpose of increasing returns in the short term, although usually at the expense of their loan portfolios’ credit risk profile.
Głogowski (2008) also concluded that banks with higher shares of loans to households were the ones to present higher credit losses, which was unexpected, especially because studies performed in developed countries tend to demonstrate that loans to households are, in general, less risky than corporate loans. His finding can nevertheless be explained by the share of housing loans in loans to households, which is significantly higher, for instance, in euro area countries in comparison to Poland. The author also found evidence of a negative association between the share of housing loans in loans to households and credit losses, which indicates that housing loans are relatively less risky assets. Banks with higher loan growth rates (compared to the sector mean) were found to have higher credit losses, while the banks’ business profile proved
23Evidence of provisions for credit losses being used to stabilize banks’ net income was also found by
other authors, including Arpa, Giulini, Ittner and Pauer (2001), Bikker and Hu (2002), Bikker and Metzemakers (2003), Cavallo and Majnoni (2001), Hasan and Wall (2003) and Quagliariello (2004). In contrast, Ahmed, Takeda and Thomas (1999) didn’t find a statistically significant evidence of provisions for credit losses being used as an income smoothing technique.
24
32 to have minor impact on credit losses25. Finally, the effects of regulatory changes were considered to be uncertain, given that the statistical significance of the respective dummy variables tended to vary between model specifications.
Quagliariello (2004) used as bank-specific determinants of credit losses each
bank’s performing loans’ growth rate, the return on assets, the stock of nonperforming loans and the flow of new nonperforming loans. It was found a negative association between credit losses and performing loans’ growth rate, thus diverging from
conclusions of Głogowski (2008) on this matter. Quagliariello (2004) suggests that higher loan growth rates should not be immediately understood as a sign of upcoming higher credit losses, since credit growth may result from both demand and supply factors. Thus, Quagliariello (2004) concludes, it is not straightforward that banks registering higher loan growth rates are necessarily accepting lower creditworthiness borrowers. The author re-estimated his model using the difference between each bank’s loan growth rate and the average loan growth rate for the Italian banking system, and the resulting coefficient still remained negative. Comparing to other researchers’ results, a possible explanation for the author’s conclusions may be the fact that he used only a one-year lagged loan growth rate coefficient, which eventually did not allow for
sufficient “time” for nonperforming loans to emerge.
A positive association between credit losses and return on assets was found by Quagliariello (2004), suggesting that banks tend to use income smoothing techniques. Concerning the stock of nonperforming loans and the flow of new nonperforming loans, the author found evidence of a positive association between both variables and credit
losses, thus suggesting (as expected) that banks’ credit losses tend to reflect their portfolios’ risk profile. Concerning the flow of new nonperforming loans, only two bank-specific determinants turned out to be statistically significant: each bank’s one -year lagged performing loans’ growth rate (negative association with the dependent variable) and cost-to-income ratio (positive association with the dependent variable for the contemporaneous coefficient and negative association with the dependent variable for the one-year lagged coefficient26). The author also used as proxies for each bank’s
25
The author found that credit losses were on average lower for specialized banks. In contrast, universal banks had a relatively higher sensitivity to unemployment rate changes, while corporate banks tended to have a comparatively higher sensitivity to GDP growth.
26
33 risk taking behavior interest income measured as a percentage of total assets and the ratio of equity capital to total assets, having both variables proved to be not significant.
In order to study credit losses of UK’s commercial and mortgage banks for the period between 1978 and 2000, Pain (2003) used as bank-specific variables each bank’s overall credit growth, net interest margins, the share of loans to sectors characterized by riskier credit profiles, the loan portfolio’s concentration (as measured by the Herfindahl index), the ratio of secured lending to households as a percentage of total loans, cost-to-income ratio, the number of employees per branch and the share of total assets as a percentage of UK’s banking sector total assets. In what concerns each bank’s overall
credit growth, once more it wasn’t found evidence that a rapid loan growth could imply higher credit losses, given that in some model specifications the lagged coefficient of this variable was found to be significantly negative (but still quite small). The author decided not to continue with overall credit growth as a determinant of credit losses in
his study since the negative coefficient could be a result of credit demand’s fall when
overall economic conditions are worsening. That variable was replaced with lagged M4 lending. The author found aggregate lending growth rate to be statistically significant, thus suggesting that banks experiencing loan portfolio growth are prone to higher credit
losses if other banks’ loan portfolios are also increasing.
Net interest margins were found to be statistically significant only for mortgage banks, having estimation results revealed a positive association with credit losses. The ratio of secured lending to households (loans secured against residential real estate) as a percentage of total loans was also found to be significant only for mortgage banks, having estimation results revealed a negative association between this variable and credit losses, thus suggesting that collateral can mitigate credit losses for mortgage banks. The share of loans to riskier credit profile sectors27 was statistically significant for commercial banks only, having shown the expected sign (i.e., positive association with credit losses). The author has also found evidence that commercial banks with less diversified loan portfolios were associated to higher credit losses, thus proving the benefits of portfolio diversification. Cost-to-income ratio proved to be clearly significant for mortgage banks (having estimation results revealed a negative association between this variable and credit losses), whilst for commercial banks it had
27
34 little effect on credit losses. Finally, the number of employees per branch and the share of each bank’s total assets as a percentage of UK’s banking sector total assets were both found to be not significant.
Particular attention was given to loan portfolio growth rate by Jiménez and Saurina (2006), concerning bank-specific determinants of Spanish banks’ nonperforming loans for the period between 1984 and 2002. The authors found evidence that loan portfolio growth rates lagged four years have a significant positive effect on nonperforming loans, while loan portfolio growth rates lagged two or three years proved to be not statistically significant28. Jiménez and Saurina (2006) also used
each bank’s loan portfolio concentration by region and industry (as measured by the Herfindahl index) as bank-specific determinants of nonperforming loans. They found evidence that higher region concentration was associated to higher levels of nonperforming loans, while industry concentration was not statistically significant. Additionally, and similar to conclusions of Pain (2003) for UK’s mortgage banks, the authors found that collateralized loans to households had a negative effect on nonperforming loans (i.e., higher shares of fully collateralized loans to households as a percentage of total loans were associated to banks with lower ratios of nonperforming loans). The authors also analyzed the potential relevance of each bank’s market share on nonperforming loans, which revealed to be not significant.
On another study performed on Spanish banks’ determinants of nonperforming loans, Salas and Saurina (2002) used as bank-specific variables the loan portfolio growth rate, the branch network growth rate, cost-to-income ratio, the share of loans without collateral to total loans of the private sector, the share of assets over total assets of the Spanish banking system (i.e., including commercial and savings banks), the net interest margin, the ratio of capital to total assets, the market share (based on the proportion of branches in each Spanish province, which was used as a proxy for each
bank’s market power) and risk premium (measured as the difference between each
bank’s interest income over total assets and the interbank interest rate). Loan portfolio growth rate had a significant positive effect only for savings banks (and only for the three-year lagged coefficient), while the branch network growth rate proved to have a
28 Clair (1992), Foos, Norden and Weber (2009) and Keeton (1999) also found evidence that prior higher