Licence Creative Commom
CC
RBCDH
1 Universidade Federal de Sergipe, Lagarto, SE. Brasil.
2 Universidade Federal da Bahia. Escola de Nutrição. Salvador, BA. Brasil.
3 Universidade Estadual de Feira de Santana, Feira de Santana, BA. Brasil.
4 Universidade Federal da Bahia. Faculdade de Medicina, Salvador, BA. Brasil.
Received: 11 September 2013 Accepted: 19 March 2014
Anthropometric indicators associated with
hypertriglyceridemia in the prediction of
visceral fat
Indicadores antropométricos associados a
hipertrigliceridemia na predição de gordura visceral
Carolina Cunha de Oliveira1
Anna Karla Carneiro Roriz2
Pricilla de Almeida Moreira2
Michaela Eickemberg2
Magali Teresopolis Reis Amaral3
Luiz Carlos Santana Passos4
Lílian Barbosa Ramos2
Abstract– he accumulation of visceral fat is strongly associated with cardiometabolic changes. Alternative methods, such as the association between anthropometric indicators and hypertriglyceridemia, are used as the best estimate for the accumulation of visceral fat, preventing cardiovascular diseases. he aim of this study was to evaluate the association of anthropometric indicators with hypertriglyceridemia in the prediction of visceral fat in men and women. his was a cross-sectional study conducted with 192 individuals, of both genders, submitted to anthropometric evaluation (sagittal abdominal diameter [SAD], waist circumference [WC], and waist-hip ratio [WHR]), serum dosage of triglycerides (TG), and computed tomography scan, in order to measure the visceral adipose tissue (VAT) area. Descriptive analysis, Pearson’s Correlation, and multiple linear regression were performed. Anthropometric indicators had high correlation with the VAT area (p=0.000). Regardless of serum TG levels, individuals with high values of anthropometric indicators had excess VAT area (p<0.05). For every centimeter increased in SAD, there was an average increase of 12.46 cm² in the VAT area. he study showed that both SAD and WC were good indicators to explain the variability in the VAT area, independently of changes in TG levels, making it possible to identify individuals with a risk of developing cardiovascular diseases.
Key words: Anthropometry; Cardiovascular diseases; Computed tomography; Hyper-triglyceridemia; Intra-abdominal fat.
Anthropometric indicators and visceral fat Oliveira et al.
INTRODUCTION
he accumulation of adipose tissue in the abdominal region, especially of visceral type, is related to a series of cardiometabolic changes, including dyslipidemia, resistance to insulin, and development of cardiovascular
diseases (CVD)1,2.
Examinations of tomographic images or magnetic resonance for the quantiication of visceral adipose tissue (VAT) are considered the gold
standard in the evaluation of lipid metabolism disorders3. However, their
use is limited due to their relatively high cost and diicult execution. As a result, only few clinical studies use this technique. Conversely, anthropo-metric indicators are the alternative methods most widely used to estimate
excess visceral fat4,5.
Over the last few years, the association between hypertriglyceridemia and waist circumference (WC) has been widely used as an initial, low cost, simple screening method to identify patients likely to be characterized by a cluster of metabolic syndrome features such as fasting hyperinsulinemia, high apolipoprotein B, and an increased proportion of small low density lipoprotein (LDL) particles (the atherogenic metabolic triad). Moreover, the simultaneous analysis of WC and hypertriglyceridemia may be able
to distinguish between visceral adiposity and subcutaneous adiposity1,2,6.
However, few studies have associated serum triglycerides (TG) with sagittal abdominal diameter (SAD) and waist-hip ratio (WHR) in the prediction
of visceral fat – traditionally, only WC is assessed1,2,6.
he present study uses the gold standard method (computed tomogra-phy [CT]) for the quantiication of VAT. In addition, it collects anthropo-metric measures, such as SAD, which has been shown to be the best
predic-tor of intra-abdominal fat4,5,7. Based on these data, this study evaluated the
association between anthropometric indicators and hypertriglyceridemia in the prediction of visceral fat in men and women.
METHODOLOGICAL PROCEDURES
Subjects and Study Design
his was a cross-sectional study performed at the School of Nutrition of the Universidade Federal da Bahia during the irst quarter of 2009 with a sample of 192 individuals stratiied by gender, age and body mass (estimated
by body mass index [BMI]), according to a previous publication7. hese
people were randomly selected from health centers or from the general community based on the following inclusion criteria: age > 20 years old and BMI < 40 kg/m.
All individuals were submitted to anthropometric, biochemical and computed tomography (CT) examinations for the assessment of the VAT area. Measurements for each individual were taken in the same week to prevent oscillations in weight, body composition, and distribution of body fat and/or in the individual’s lipid proile.
Anthropometric evaluation
Anthropometric evaluation was performed by a properly trained team and comprised the measurement of weight, height, hip circumference,
and WC, obtained according to the techniques proposed by Lohman et
al.8. Waist circumference was measured at the midpoint between the lower
costal margin and the iliac crest, using a measuring tape made of inelastic synthetic material. he reading was made at the moment of expiration. Hip circumference was obtained at the pubic symphysis level, with the individual wearing light clothes and the tape encircling the hip at the most prominent part between the waist and the thigh. he reading was carried out to the nearest millimeter. WC was classiied as high when >90 cm for male and >80 cm for female, according to the criteria suggested by the International
Diabetes Federation9 for ethnic South American groups. Waist-hip ratio
(WHR) was obtained by dividing individuals’ WC by their hip
circumfer-ence and was classiied as high when > 1.00 for men and > 0.85 for women10.
he SAD was measured according to the technique proposed by
Kahn11, i.e., it was veriied with the help of a portable abdominal calibrator
(Sliding-beam – Holtain, Ltd., Dyfed.Wales, U.K.) and measured with the individual in supine position, with the arms relaxed alongside the body and legs extended. he ixed caliper of the calibrator was placed under the individual’s back and the sliding caliper was brought up to the abdominal point between the iliac crests, at the level of the umbilicus. he reading was taken to the nearest millimeter, at the end of expiration. he cut-of point for high SAD was deined as > 20cm, according to what has been
demonstrated by previous studies4,7,12.
All anthropometric measurements were made in duplicate. he coef-icient of variation was calculated to assess the inter- and intra-examiner variability of the anthropometric measures (inter-class coeicient >0.90).
Laboratorial Evaluation
Serum TG levels were quantiied by a colorimetric assay carried out at a private laboratory with samples collected ater a 12-hour overnight, using a kit manufactured by Ortho-Clinical Diagnostics. Serum TG levels >150mg/
dL were considered to be high9.
Tomographic Study
Anthropometric indicators and visceral fat Oliveira et al.
he examination was performed ater 4 hours of fasting, with the individual lying in the dorsal recumbent position and the arms extended overhead. No barite or organo-iodized contrasts were used.
A lateral topogram was taken for precise identiication of the location of the L4-L5, followed by a single axial tomography slice in this location, with slice thickness of 10mm and exposition time of three seconds. he external limits of the WC were outlined using an electronic cursor, which then calculated the total waist area. Next, the area of visceral abdominal fat was determined by the delimitation of the abdominal cavity, taking as its limits the rectus abdominis, internal oblique and quadratus lumborum
muscles13. A tomography sotware with radiographic parameters of 140kV
and 45mA, applying a density of -50 and -150 HounsieldsUnities to
iden-tify the adipose tissue. A VAT area >130cm² was considered as a risk factor
for the development of cardiovascular diseases14.
Statistical Analysis
Statistical analyzes were performed using the sotware Statistical Package for Social Sciences (SPSS), version 16.0. Descriptive analysis of the variables was expressed as mean and standard deviation. he distribution of continu-ous variables was assessed by the Kolmogorov-Smirnov non-parametric
test. Average results of the analyzed variables were compared using Pearson
correlation and non-rated t-test for independent samples. Multiple linear regression was performed to assess the inluence of anthropometric indi-cators, age, gender, and triglycerides on the estimation of visceral fat. he signiicance level was set at less than 5%.
Ethical Aspects
his study was approved by the Research Ethics Committee of the School of Nutrition of UFBA (CEPNUT/UFBA), declaration number 01/09. Addi-tionally, all participants provided a written informed consent to participate in this study, ater it was approved by the ethics committee.
RESULTS
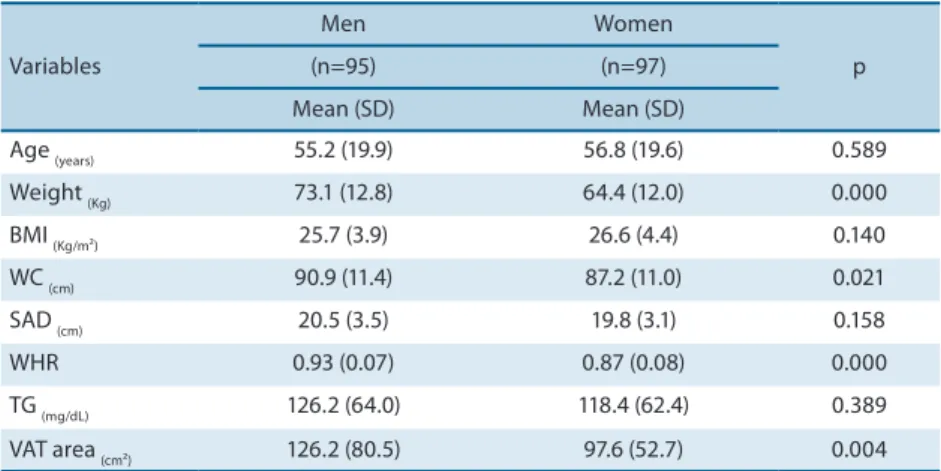
Of the 192 individuals between 21 and 95 years old, there were 95 men and 97 women. Table 1 shows clinical and biochemical data of study subjects. It can be observed that mean values for the variables weight, WC, WHR, and VAT area were signiicantly diferent between genders (p<0.021), being higher among men.
Variables
Men Women
p
(n=95) (n=97)
Mean (SD) Mean (SD)
Age (years) 55.2 (19.9) 56.8 (19.6) 0.589
Weight (Kg) 73.1 (12.8) 64.4 (12.0) 0.000
BMI (Kg/m²) 25.7 (3.9) 26.6 (4.4) 0.140
WC (cm) 90.9 (11.4) 87.2 (11.0) 0.021
SAD (cm) 20.5 (3.5) 19.8 (3.1) 0.158
WHR 0.93 (0.07) 0.87 (0.08) 0.000
TG (mg/dL) 126.2 (64.0) 118.4 (62.4) 0.389
VAT area (cm²) 126.2 (80.5) 97.6 (52.7) 0.004
SD: standard deviation; BMI: body mass index; WC: waist circumference; SAD: sagittal abdominal diameter; WHR: waist-hip ratio; TG: triglycerides; VAT: visceral adipose tissue.
Table 2. Correlation coeicient between anthropometric indicators, TG, and VAT area according to gender. Salvador, Bahia, Brazil, 2009.
Men
WC SAD WHR TG VAT
WC - 0.875† 0.671† 0.351† 0.771†
SAD 0.875† - 0.552† 0.375† 0.762†
WHR 0.703† 0.552† - 0.390† 0.730†
TG 0.351† 0.375† 0.390† - 0.362†
VAT area 0.771† 0.762† 0.730† 0.362†
-Women
WC - 0.834† 0.671† 0.242* 0.677†
SAD 0.834† - 0.442† 0.250* 0.652†
WHR 0.671† 0.442† - 0.376† 0.648†
TG 0.242* 0.250* 0.376† - 0.444†
VAT area 0.677† 0.652† 0.648† 0.444†
-WC: waist circumference; SAD: sagittal abdominal diameter; WHR: waist-hip ratio; TG: triglycerides; VAT: visceral adipose tissue. †. Correlation is signiicant at the 0.01 level. *. Correlation is signiicant at the 0.05 level.
As seen in Table 3, individuals with high values of anthropometric indicators (WC, SAD and WHR) and hypertriglyceridemia showed higher mean values for VAT area in both genders, with higher values among males (p<0.02).
Anthropometric indicators and visceral fat Oliveira et al.
Table 3. Descriptive analysis of the VAT area according to anthropometric indicators combined with TG levels for men and women. Salvador, Bahia, Brazil, 2009.
Variables
VAT area
Men Women
p Mean (SD) Mean (SD)
WC+TG
High WC and TG 187.2 (62.0) 133.71 (40.6) 0.003 High WC/low TG 169.1 (84.6) 107.17 (46.7) 0.001 Low WC/high TG 109.8 (32.4) 101.44 (36.6) 0.675 Low WC and TG 65.3 (38.7) 35.7 (24.8) 0.001
SAD+TG
High SAD and TG 178.9 (64.7) 140.9 (43.7) 0.044 High DAS/low TG 171.6 (87.2) 125.5 (52.1) 0.021 Low SAD/high TG 113.2 (36.0) 106.7 (27.8) 0.687 Low SAD e TG 68.7 (40.5) 64.4 (37.8) 0.615
WHR+TG
High WHR and TG 211.4 (35.4) 131.5(39.4) <0.001 High WHR/low TG 193.8 (81.2) 109.9 (48.7) <0.001 Low WHR/high TG 140.7 (64.3) 110.3(48.7) 0.340 Low WHR and TG 81.3 (57.9) 53.8 (38.8) 0.026
VAT: visceral adipose tissue; WC: waist circumference; SAD: sagittal abdominal diameter; WHR: waist-hip ratio; TG: triglycerides.
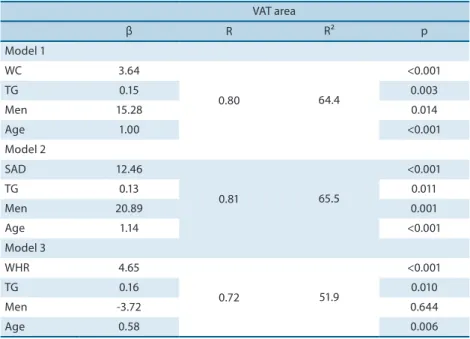
Table 4. Results of multiple linear regression between VAT area and anthropometric variables, TG, age and gender. Salvador, Bahia, Brazil, 2009.
VAT area
β R R² p
Model 1
WC 3.64
0.80 64.4
<0.001
TG 0.15 0.003
Men 15.28 0.014
Age 1.00 <0.001
Model 2
SAD 12.46
0.81 65.5
<0.001
TG 0.13 0.011
Men 20.89 0.001
Age 1.14 <0.001
Model 3
WHR 4.65
0.72 51.9
<0.001
TG 0.16 0.010
Men -3.72 0.644
Age 0.58 0.006
VAT: visceral adipose tissue; WC: waist circumference; SAD: sagittal abdominal diameter; WHR: waist-hip ratio; TG: triglycerides
DISCUSSION
Most studies about visceral fat as measured by CT15,16 use serum TG levels
only to present the metabolic proile of the study population or relate these levels to other biochemical parameters. However, there is scientiic
evi-dence1,6,17 proposing hypertriglyceridemia as a marker of metabolic changes
cardiovascular diseases by creating the concept of “hypertriglyceridemic waist”. However, it is important to highlight that diferences between genders and age groups must be considered.
Similarly to other studies4,15,18,this investigation found that males
showed signiicantly higher mean values for VAT area and WC as compared to females. Excess body fat is associated with aspects such as life style, genetic factors and, among men, especially with the secretion of steroid hormones and the local density of their receptors, which decide the speciic sexual characteristics of body fat regional distribution leading to higher
concen-tration of abdominal adipose tissue and higher visceral fat accumulation19.
he analysis of the correlation between anthropometric indicators and VAT area made it possible to observe that WC and SAD had a similar cor-relation for the male gender. In a study with Italians aged from 27 to 78 years
old, Zamboni et al.20 found higher correlations for the male gender, with
r=0.80 (p<0.001) for WC, r=0.86 (p<0.001) for SAD, and r=0.82 (p<0.01)
for WHR. In contrast to these results, a study conducted by Sampaio et al.4
with Brazilians aged from 20 to 83 years old observed better correlations for WC (r=0.77; p<0.01) and SAD (r=0.80; p<0.01) among the female gender.
Despite being low, the correlation between serum TG levels and VAT area was slightly better in females. his result agrees with indings by
De-sprés et al. 21,who used CT to quantify abdominal and hip fat in a female
sample. hese authors observed a higher correlation between increased abdominal fat and increased TG levels than between hip fat and TG levels.
he results of our study show that individuals withhigh values of
an-thropometric indicators and hypertriglyceridemia had higher mean values for the VAT area in both genders. In a cohort study with men and women
with diabetes, Sam et al.6 observed that individuals with higher WC and
hypertriglyceridemia had higher mean values for VAT volume.
When analyzing the inluence of variables such as anthropometric indicators, serum TG levels, gender, and age on the VAT area, this study observed that, in the presence of other variables, SAD was the best factor to explain the variability in the VAT area, although model 1, which included WC, was able to explain 64.4% of the variability in VAT area, a value very close to that obtained with the SAD (65.5%).
Our study shows that anthropometric measures alone, without taking serum TG levels into account, are able to predict excess visceral fat and also
cardiovascular risk. Our results agree with those by Stevens et al.22, who
suggestedthat WC and SAD should be the anthropometric parameters of
choice when the aim is to estimate VAT area and evaluate the individuals’
cardiovascular risk proile. In addition, Riserus et al.23 stated that SAD was
the best cardiovascular predictor when compared to other conventional anthropometric parameters.
Anthropometric indicators and visceral fat Oliveira et al.
men. Such results demonstrate diferent aspects in the body composition
and distribution of fat in men and women24, therefore indicating that the
WHR have a better correlation with the subcutaneous adipose tissue than with the visceral adipose tissue. It is important to point out that, unlike WC and SAD, the WHR is an index, so it presented very low values, rang-ing from 0.68 to 1.09.
In a linear regression model including gender, age, and anthropometric
indicators (WC, SAD and BMI), Onat et al.15 found that WC showed the
best correlation with the VAT area in the whole study sample, followed by age among women. It is important to mention that these authors did not include serum TG levels in their model of analysis.
Some methodological limitations must be mentioned, e.g., this is a cross-sectional study whose results do not make it possible to establish causal links. Furthermore, sample stratiication by gender, age and body mass limited the use of diferent statistical tests, which could better explain how the relationship between anthropometric measures and hypertriglyc-eridemia may be used to indicate excess visceral fat.
We concluded that anthropometric indicators showed high correla-tion with the VAT area, especially WC and SAD among men. Serum TG levels were poorly associated with the VAT area. Additionally, regardless
of serum TG levels, individualswho had high measures of anthropometric
indicators had excess VAT. SAD and WC were good indicators to explain the variability in VAT area, making it possible to identify individuals at risk of developing cardiovascular diseases. Hence, these indicators may be considered simple screening tools for the identiication of individuals at risk for cardiometabolic changes. In view of this, anthropometric indicators can and should be widely used in clinical practice and population studies to identify cardiovascular risk, independently of changes in laboratory parameters (such as TG levels).
Acknowledgments
We gratefully acknowledge the contributions of Hospital Universitário Professor Edgar Santos, Salvador, state of Bahia, Brazil. his project was supported by the Conselho Nacional de Desenvolvimento Cientíico e Tecnológico (CNPq).
REFERENCES
1. Després JP, Lemieux I, Bergeron J, Pibarot P, Mathieu P, Larose E, et al. Abdominal Obesity and the Metabolic Syndrome: Contribution to Global Cardiometabolic Risk. Arterioscler hromb Vasc Biol 2008; 28(6): 1039-49.
2. Lemieux I, Poirier P, Bergeron J, Almerás N, Lamarche B, Cantin B, et al. Hyper-triglyceridemic Waist: A useful screening phenotype in preventive cardiology? Can J Cardiol 2007; 23 (B): 23-31.
3. Després JP, Lemieux I. Abdominal obesity and metabolic syndrome. Nature 2007;
444(14): 881-7.
4. Sampaio LR, Simões EJ, Assis AMO, Ramos LR. Validity and Reliability of the
Corresponding author
Carolina Cunha de Oliveira Universidade Federal de Sergipe, Núcleo de Nutrição
Avenida Padre Alvares Pitangueira, 248 – Centro. 49.000-000. Lagarto, Sergipe, Brasil E-mail: [email protected] 23(1): 107-18.
6. Sam S, Hafner S, Davidson MH, D’Agostino RB, Feinstein S, Kondos G, et al.
Hypertriglyceridemic Waist Phenotype Predicts Increased Visceral Fat in Subjects With Type 2 Diabetes. Diabetes care 2009; 32(10): 1916-20.
7. Roriz AKC, Oliveira CC, Moreira PA, Eickemberg M, Medeiros JM, Sampaio
LR. Methods of predicting visceral fat in adults and older adults: a comparison between anthropometry and computerized tomography. Arch Latinoam Nutr 2011; 61(1): 5-12.
8. Lohman TG; Roche AF; Martorell R. Anthropometric standardization reference
manual. Illinois: Human Kinetics Books. 1988.
9. Alberti KG, Zimmet P, Shaw J. IDF Epidemiology Task Force Consensus Group. he
metabolic syndrome-a new worldwide deinition. Lancet 2005; 366(9491):1059-62.
10. World Health Organization (WHO). Obesity: preventing and managing the global
epidemic. Geneva: Program of Nutrition, Family and Reproductive Health. 1998.
11. Kahn HS, Austin H, Williamson DF, Arensberg D. Simple anthropometric indices
associated with ischemic heart disease. J Clin Epidemiol 1996; 49(9): 1017-124.
12. Duarte Pimentel D, Portero-McLellan KC, Maestá N, Corrente JE, Burini RC. Accu-racy of sagittal abdominal diameter as a predictor of abdominal fat among Brazilian adults: a comparation with waist circumference. Nutr Hosp 2010; 25(4): 656-61.
13. Seidell JC, Oosterlee A, hijssen MA, Burema J, Deurenberg P, Hautvast JG, et al. Assessment of intra-abdominal and subcutaneous abdominal fat: relation between anthropometry and computed tomography. Am J Clin Nutr 1987; 45(1): 7-13.
14. Després JP, Lamarche B. Efects of diet and physical activity on adiposity and body fat distribution: implications for the prevention of cardiovascular disease. Nutr Res Rev 1993; 6(1): 137-59.
15. Onat A, Avci GS, Barlan MM, Uyarel H, Uzunlar B, Sansoy V. Measures of
ab-dominal obesity assessed for visceral adiposity and relation to coronary risk. Int J Obes Relat Metab Disord 2004; 28(8): 1018-25.
16. Fox CS, Massaro JM, Hofmann U, Pou KM, Maurovich-Horvat P, Vasan RS, et al.
Abdominal visceral and subcutaneous adipose tissue compartments: association with metabolic risk factors in the Framingham Heart Study. Circulation 2007; 116(1): 39-48.
17. Arsenault BJ, Lemueux I, Després JP, Wareham NJ, Kastelein JJP, Khaw K-T, et al. he hypertriglyceridemic-waist phenotype and the risk of coronary artery disease: results from the EPIC-Norfolk Prospective Population Study. CMAJ 2010; 182(13): 1427-32.
18. Kim JA, Choi CJ, Yum KS. Cut-of Values of Visceral Fat Area and Circumference: Diagnostic Criteria for Abdominal Obesity in a Korean Population. J Korean Med Sci 2006; 21(6): 1048-53.
19. Seidell JC, Visscher TLS. Body weight and weight change and their health implica-tions for the elderly. Eur J Clin Nutr 2000; 54(Suppl 3):33-9.
20. Zamboni M, Turcato E, Armellini F, Kahn HS, Zivelonghi A, Santana H, et al.
Sagittal abdominal diameter as a practical predictor of visceral fat. Int J Obes Relat Metab Disord 1998; 22(7): 655-60.
21. Després JP, Moorjani S, Ferland M, Trembaly A, Lupien PJ, Nadeau A, et al. Adipose tissue distribution and plasma lipoprotein levels in obese women: importance of intra-abdominal fat. Arteriosclerosis 1989; 9(2): 203-10.
22. Stevens J, Mcclain JE, Truesdale KP. Selection of measures in epidemiologic studies of the consequences of obesity. Int J Obes 2008; 32(3): 60-6.
23. Risérus U, Faire U, Berglund L, Hellénius M-L. Sagittal Abdominal Diameter as
a Screening Tool in Clinical Research: Cutofs for Cardiometabolic Risk. J Obe 2010;pii: 757939.