DOI: http://dx.doi.org/10.5007/1980-0037.2014v16n5p504
original article
Licence Creative Commom
CC
RBCDH
1 Universidade Federal de Santa Catarina. Programa de Pós--Graduação em Educação Física. Florianópolis, SC. Brasil. 2 Universidade Federal de Santa Catarina. Programa de Pós--Graduação em Saúde Coletiva. Florianópolis, SC. Brasil.
Received: 17 October 2013 Accepted: 27 January 2014
Anthropometric indicators in older adults
from Florianópolis: a population-based
study conducted in 2002 and 2010
Indicadores antropométricos em idosos de Florianópolis:
estudo populacional em 2002 e em 2010
Aline Mendes Gerage1
Simone Teresinha Meurer1
Eleonora D’Orsi2
Tânia R. B. Benedetti1
Abstract – he objective of this study was to describe and compare speciic anthropometric indicators in older adults from Florianópolis who participated in two population-based studies conducted in 2002 and 2010. A total of 865 older adults in 2002, and 1,657 older adults in 2010 were assessed for weight, height, body mass index (BMI), waist circumfer-ence (WC), and waist-to-height ratio (WHtR). Signiicant increases in body weight of 3.0 kg for men and 4.9 kg for women were identiied from 2002 to 2010 (P < 0.05). he BMI also increased in both genders (+0.9 kg/m2 for men and +1.6 kg/m2 for women), while
height increased only in women (+1.5 cm) (P < 0.05). No signiicant diferences were observed for WC or WHtR. BMI classiication revealed an increase in the prevalence of overweight/obesity in both genders (P < 0.05). However, when the subjects were classiied based on WC and WHtR, no signiicant diference was observed between the two time points in either gender, highlighting the high percentage of older adults (> 70%) with inadequate WC and WHtR in 2002 as well as in 2010. he results suggest an increase in weight and BMI from 2002 to 2010 in older adults from Florianópolis. Furthermore, the prevalence of overweight/obesity characterized by BMI increased in women and men, whereas WC and WHtR remained unchanged between 2002 and 2010.
Key words: Aging; Anthropometry; Time.
Resumo– O objetivo do presente estudo foi descrever e comparar alguns indicadores antropométricos em idosos de Florianópolis em 2002 e em 2010, a partir de dois estudos populacionais. Para tanto, 865 idosos em 2002 e 1657 idosos em 2010, de ambos os sexos, foram avaliados quanto à massa corporal, estatura, índice de massa corporal (IMC), circun-ferência de cintura (CCint) e razão cintura estatura (RCEst). Acréscimos estatisticamente signiicantes de 3,0 e 4,9 kg no peso corporal foram identiicados, respectivamente, para homens e mulheres, de 2002 para 2010 (P < 0,05). O IMC também aumentou em ambos os sexos (+0,9 kg/m2 para homens e + 1,6 kg/m2 para as mulheres), enquanto a estatura
Population aging is a phenomenon that has been observed worldwide over the last decades, mainly as a result of the demographic transition characterized by declining fertility rates in conjunction with a reduction in infant mortality. Furthermore, the burden of morbidity and mortality
has shited to the elderly population, with a predominance of morbidity1.
In Brazil, a signiicant increase in the number of people aged 60 years or older was observed over the period from 2001 to 2011. In absolute terms,
this number increased from 15.5 to 23.5 million persons (+3.1%)1.
Projec-tions indicate that the elderly population will correspond to approximately 19% of the Brazilian population in 2050, whereas the young population tends to decrease2.
his transition in the Brazilian population age composition is also
closely related with Brazil’s social and economic development3. In this
regard, if, on the one hand, advances in urban sanitation measures, nutri-tional conditions and educanutri-tional levels have improved the general living conditions of the population, on the other hand, these advances contributed to the adoption of an increasingly inadequate lifestyle, including changes in eating habits and physical activity levels4,5. hese lifestyle changes have
favored the emergence of chronic noncommunicable diseases such as obe-sity, one of the major risk factors for the development of cardiovascular diseases6, which leads the list of causes of death among older adults7.
It is therefore important to monitor the health of older adults, includ-ing the evolution of nutritional status, so that public health measures for disease prevention and health promotion in this population can be implemented or restructured. In this respect, representative studies of the elderly population need to be conducted in diferent regions of the country in order to observe possible temporal changes in nutritional status, and to adopt measures that minimize or reverse the increase in morbidity and mortality due to cardiovascular diseases. he use of anthropometric meas-ures seems to be an interesting option when the objective is to evaluate a large number of subjects, since these are simple and low cost methods that provide important obesity-related indicators8.
herefore, the objective of the present study was to describe and compare speciic anthropometric indicators in older adults from Florianópolis who participated in two population-based studies conducted in 2002 and 2010.
METHODOLOGICAL PROCEDURES
his study was a panel study composed of two home-based population surveys, conducted in the municipality of Florianópolis, Santa Catarina, Brazil, in 2002 and 2010. he samples consisted of older adults aged 60 years or older who lived in the municipality.
Anthropometry of older adults from Florianópolis Gerage et al.
municipality of Florianópolis”9, which was approved by the Ethics
Com-mittee of the Federal University of Santa Catarina (Permit No. 051/2001). In that year, there were 28,816 older adults in Florianópolis, corresponding to 8.4% of the total population, distributed in 12 districts and 460 census tracts. All but 20 census tracts were investigated (barracks and military bases: 2; prison facilities: 2; nursing homes: 2; household sectors: 3, and tracts with less than 50 people: 11). he sample was deined in a probabil-istic manner and stratiied according to census tract and gender. One older adult at the beginning of each census tract and another in the middle were
interviewed. A formula for sample size calculation was applied10, which
indicated a minimum number of 788 older adults to be interviewed. In 2009/2010, the sample comprised 1,657 older adults (1,059 women and 598 men) who participated in a comprehensive survey about the health conditions of older adults in Florianópolis, called EpiFloripa Idoso11. he
study was approved by the local Ethics Committee (352/2008) and was conducted between the second half of 2009 and the irst half of 2010. he 60+ population of Florianópolis comprised 44,460 people in 2009, cor-responding to 10.8% of the total population.
he sample size of the EpiFloripa Idoso study was calculated assuming a population of 44,460 older adults, a prevalence of leisure-time physical activity of 26%11, a sampling error of 4%, a 95% conidence interval, and a
design efect of 2.6. To this number, 20% was added for losses and refusals and 15% for association studies. Calculation indicated a minimum number of 1,604 older adults to be interviewed.
he sample was obtained by two-stage cluster sampling. In the irst stage, 420 urban census tracts were stratiied according to income deciles of the household head and eight tracts per decile were drawn (total of 80 census tracts). he sampling units of the second stage were the systemati-cally selected households. he number of inhabited dwellings ranged from 61 to 725. To reduce the variability between the number of households in each census tract, some of them were grouped and others were split observing the corresponding income decile. he initial coeicient of vari-ation thus changed from 52.7% (n = 80 tracts) to 35.2% (n = 83 tracts). It was estimated that 60 households should be visited per census tract to ind 20 older adults. All older adults living in the selected households were considered eligible for the study. In 2009/2010, only the urban population was interviewed since it accounted for 96.2% of the population residing in the municipality of Florianópolis. Institutionalized older adults were excluded both in 2002 and in 2010. Subjects who could not be interviewed ater four attempts (including night time and weekends) were deined as losses, and subjects who refused to answer the questionnaire by choice were considered refusals. No replacements were made.
he BMI was classiied according to criteria deined by the World Health Organization12: low weight: < 18 kg/m2; normal weight: 18.5 to
24.9 kg/m2; overweight: 25 to 29.9 kg/m2, and obesity: > 30 kg/m2. he low
and normal weight categories and overweight and obese categories were grouped. Speciically, the low weight category was grouped because of the low prevalence in the sample studied (< 2%).
he cut-of values suggested by the Brazilian Guidelines for Obesity13
were used for the classiication of WC. According to these criteria, a circum-ference ≤ 90 cm for men and ≤ 80 cm for women is considered adequate. he
classiication of Pitanga and Lessa14 was adopted for WHtR, which deines
a ratio ≤ 0.52 for men and ≤ 0.53 for women as adequate, demonstrating that WC cannot be greater than half the height.
All participants received detailed information about the study proce-dures and signed the informed consent form.
For statistical analysis of continuous variables, the Kolmogorov-Smirnov test was irst applied to evaluate the normality of the data. Once conirmed, descriptive statistics was used and the results are expressed as the mean and standard deviation. Levene’s test was used to determine the homogeneity of variances and, if this assumption was conirmed, the
Student t-test for independent samples was applied to compare the
anthro-pometric variables in 2002 and 2010. Categorical variables are reported as relative and absolute frequency and the chi-squared test was used for comparison of proportions. All analyses were performed using the SPSS 17.0 program, adopting a P value < 0.05.
RESULTS
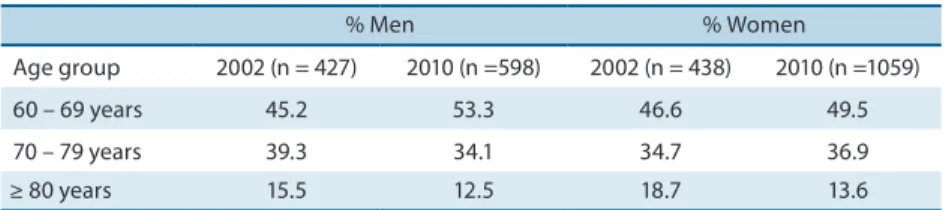
Table 1 shows the percentage of men and women who participated in the study in 2002 and 2010 according to age group.
Table 1. Percentage of men and women according to age group in 2002 and 2010 (Florianópolis-SC, Brazil).
% Men % Women
Age group 2002 (n = 427) 2010 (n =598) 2002 (n = 438) 2010 (n =1059)
60 – 69 years 45.2 53.3 46.6 49.5
70 – 79 years 39.3 34.1 34.7 36.9
≥ 80 years 15.5 12.5 18.7 13.6
here was a predominance of women and subjects in the 60-69 years age group in 2002 and 2010.
he anthropometric indicators of men and women in 2002 and 2010 are shown as continuous variables in Table 2.
In men, body weight (+3 kg) and BMI (+0.9 kg/m2) increased
Anthropometry of older adults from Florianópolis Gerage et al.
No signiicant diferences were observed for WC or WHtR.
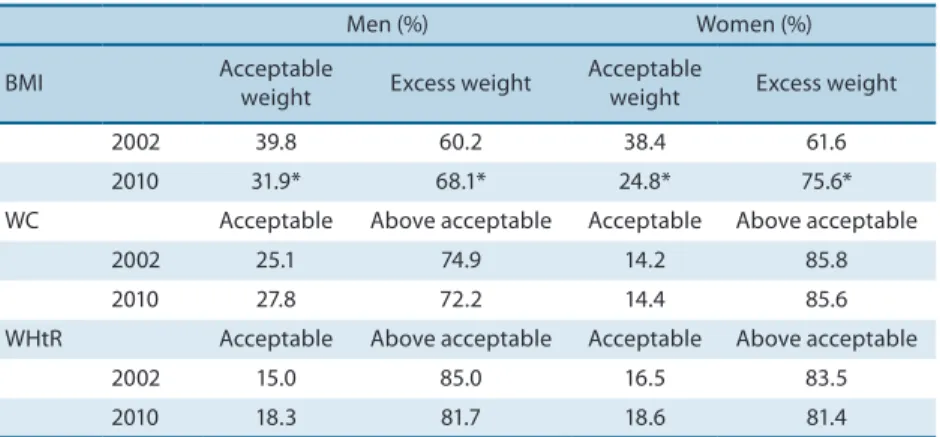
Table 3 shows the percentage of men and women classiied according to BMI, WC and WHtR in 2002 and 2010.
Table 2. Anthropometric indicators of older adults from Florianópolis in 2002 and 2010.
Men P Women P
2002 2010 2002 2010
Body weight (kg) 71.9 ± 13.8 74.9 ± 14.2 <0.01 62.2 ± 13.0 67.1 ± 13.8 <0.01
Height (cm) 165.8 ± 7.8 166.7 ± 7.4 0.05 151.9 ± 7.3 153.4 ± 7.1 <0.01
BMI (kg/m2) 26.0 ± 4.0 26.9 ± 4.2 <0.01 26.9 ± 5.0 28.5 ± 5.5 <0.01
WC (cm) 96.7 ± 12.3 96.2 ± 12.1 0.06 91.7 ± 12.2 92.2 ± 13.4 0.50
WHtR 0.58 ± 0.1 0.58 ± 0.1 0.17 0.61 ± 0.08 0.60 ± 0.09 0.71
Values are the mean ± standard deviation. BMI: body mass index; WC: waist circumference; WHtR: waist-to-height ratio.
Table 3. Classiication of anthropometric indicators in male and female older adults (Florianópolis, 2002 and 2010).
Men (%) Women (%)
BMI Acceptable
weight Excess weight
Acceptable
weight Excess weight
2002 39.8 60.2 38.4 61.6
2010 31.9* 68.1* 24.8* 75.6*
WC Acceptable Above acceptable Acceptable Above acceptable
2002 25.1 74.9 14.2 85.8
2010 27.8 72.2 14.4 85.6
WHtR Acceptable Above acceptable Acceptable Above acceptable
2002 15.0 85.0 16.5 83.5
2010 18.3 81.7 18.6 81.4
BMI: body mass index; WC: waist circumference; WHtR: waist-to-height ratio. * P < 0.05 (chi-squared test).
Among men, the percentage of older adults classiied as excess weight
based on BMI was higher in 2010 (P < 0.05). No signiicant diference
be-tween the two years of study was observed when the subjects were classiied according to WC or WHtR. Similar to the indings obtained for men, the percentage of women classiied as excess weight based on BMI was higher
in 2010 (P < 0.05). Classiication according to WC and WHtR showed no
signiicant diference between 2002 and 2010. However, it should be noted that the percentage of male and female older adults with WC (> 70% men and > 80% women) and WHtR (> 80%) above acceptable levels was high both in 2002 and in 2010.
Analysis of BMI classiication into the four categories (low weight, normal weight, overweight, and obesity) showed that, in 2002, most women were normal weight and overweight, whereas in 2010 most women were overweight and obese (Table 4). he same was not observed for men.
Low weight (< 18 kg/m2)
1.8 1.2
Normal weight (18 – 24.99 kg/m2)
37.4 24.7
Overweight (25 – 29.99 kg/m2)
38.1 40.6
Obesity
(≥ 30 kg/m2) 22.6 33.5
BMI: body mass index.
DISCUSSION
he main inding of the present study was the increase in body weight and BMI in male and female older adults from Florianópolis between 2002 and 2010. Female height, and the percentage of male and female older adults classiied as excess weight based on BMI also increased. he alarming fact is that all anthropometric indicators used classiied the majority of older adults as excess weight or above acceptable levels for health, both in 2002 and in 2010. his situation was further aggravated in 2010 when BMI was used for this classiication.
Despite the scarcity of national and international studies evaluating the long-term evolution of nutritional status, particularly in older adults, some comparisons can be made. Data from a national survey, the Telephone-Based Surveillance of Risk and Protective Factors for Chronic Diseases (Vigilância de Fatores de Risco e Proteção para Doenças Crônicas por Inquérito Tel-efônico - VIGITEL), indicate an increase in the prevalence of excess weight from 200615 to 20104 among Brazilian adults in general, and among adults
from Florianópolis in particular (40.4 vs. 46.3%). Among people aged 65 years or older, this prevalence increased from 53.1 to 58.4% in Brazil. In 2011, the results showed a small increase among adults from Florianópolis (48.2%) and a slight reduction among those aged 65 years or older (55.7%)5.
Similar results for men, but diferent results for women, have been
reported in another study16 which evaluated birth cohort efects on the
nutritional status of older adults aged 71 to 81 years, who participated in the 1997 and 2008 Bambuí (Minas Gerais, Brazil) cohort study of aging. he proportion of overweight, BMI and WC of older adults born in 1916-1926 (old cohort) was compared to those of older adults born in 1927-1937 (recent cohort). Increases in BMI, proportion of overweight and WC were observed in men of the recent cohort, whereas a reduction in WC was seen among women. hese results demonstrated a cohort efect on the worsen-ing of anthropometric measures among men, but not among women. he authors of the study believe that these diferences over time are associated with cultural, behavioral and environmental changes. Furthermore, they suggested that the diferences between genders are related to the fact that
Anthropometry of older adults from Florianópolis Gerage et al.
to changes in dietary and physical activity habits. Similar to the indings
of the Bambuí cohort study, Eiben et al.18 observed an increase in body
weight, BMI and WC, as well as in the prevalence of overweight/obesity, among 70-year-old Swedish men and women born in 1930 when compared to those born in 1901, although the impact of time was greater for men.
In the present study no diferences between genders, as generally re-ported in other studies16,18, were observed. his inding is probably related
to cultural diferences between countries and/or regions of Brazil. In Florianópolis, concerns regarding health, esthetics, physical activity, and diet might be independent of gender. However, such speculation deserves further investigation.
Inadequate dietary habits and insuicient physical activity seem to explain the changes observed over time (2002 vs. 2010), irrespective of
gen-der. his hypothesis is supported by another study19 which, using VIGITEL
data, identiied worsening of diet quality in the Brazilian population over the period from 2007 to 2009. Furthermore, the proportion of leisure-time physically active older adults in Florianópolis was 29.7% in 2009/201011, a
low rate but slightly higher than that observed in 2002 (25.7%)9.
However, when data from Florianópolis were analyzed, comparison of
the VIGITEL results obtained in 200615 and 20104 indicate improvement
in the dietary habits of adults (≥ 18 years). he prevalence of fruit and vegetable consumption 5 days a week or more increased slightly from 35.7 to 39.3%, whereas the consumption of red meat with excess fat decreased from 33.3 to 31.7%. With respect to the prevalence of suicient leisure-time physical activity among adults from Florianópolis, an increase was observed from 10.5% in 2006 to 16.3% in 2010. herefore, despite a slight increase in physical activity levels and improvement in dietary habits, the results of the present study indicate that these changes are still insuicient to afect anthropometric indicators in such a way as to reduce overweight/ obesity in the population studied. However, the VIGITEL survey does not provide data on physical activity and dietary habits speciically for older adults from Florianópolis, which therefore deserve further investigation.
With respect to the assessment of nutritional status, it is important to remember that imaging techniques such as magnetic resonance
imag-ing, computed tomography and dual-energy X-ray absorptiometry20 are
alternatives that provide more accurate estimates of body fat accumula-tion. However, their application to a large number of subjects and clinical diagnoses is limited by the high cost of the devices and methodological sophistication8. In this respect, anthropometry is a good strategy to
evalu-ate excess body fat, especially in population studies. Diferent indicators have been proposed to determine the association between excess weight and cardiovascular risk factors8.
such as bone or muscle mass, and not necessarily an increase in fat mass, but this speculation also needs to be conirmed. Furthermore, the BMI is less associated with high coronary risk22, and there is no global consensus
about the best acceptable BMI cut-of for health in the elderly population23.
According to the literature, indicators of central or abdominal obesity,
such as WC, are more associated with high coronary risk24 and
mortal-ity risk25 than overall obesity indicators, irrespective of age and gender.
Coutinho et al.25 suggested that the classiication of overweight and obesity
based on BMI does not necessarily indicate a higher mortality risk in the absence of abdominal obesity. his demonstrates the importance of the use of BMI in conjunction with other indicators of abdominal obesity, such as WC, when the objective is to monitor the health of older adults or of individuals in general. his is probably related to the fact that excessive accumulation of abdominal fat is associated with diferent metabolic disor-ders, such as glucose intolerance, hyperinsulinemia, diabetes, hypertension, and altered plasma concentrations of lipids and lipoproteins, generally
found in conjunction with coronary diseases26.
Another indicator that is gaining importance in epidemiological studies is WHtR. Studies have shown that this indicator is strongly associated with diferent cardiovascular risk factors8,13,27. Haun et al.8 indicated WHtR to
be a better predictor of high coronary risk than WC.
In the present study, the only indicator of obesity that increased from 2002 to 2010 was BMI, suggesting an increase in generalized obesity over time, but not necessarily an increase in coronary risk, especially when the “obesity paradox” is considered. According to this theory, overweight/ obesity (diagnosed based on BMI) is a protective factor for some chronic diseases, including cardiovascular diseases, and physical inactivity or low cardiorespiratory itness is a more important risk factor than obesity28.
he literature also pointed out the importance of calf and arm cir-cumference (indicators of muscle mass/sarcopenia) measurement in older adults. Tsai et al.29 showed that calf circumference is more efective in
pre-dicting mortality risk in older adults than BMI. he results of that study indicated that low calf and arm circumference values are more associated with mortality risk than low BMI values in subjects aged 65 to 74 years. Additionally, a high BMI was not a good predictor of mortality risk.
Anthropometry of older adults from Florianópolis Gerage et al.
CONCLUSIONS
In summary, the results of the present study showed an increase in body weight and BMI from 2002 to 2010 among female and male older adults from Florianópolis. he percentage of older adults with overweight/obesity, classiied based on BMI, increased among women and men. No alterations in WC or WHtR were observed between 2002 and 2010. hese indings indicate the need for new disease prevention and health promotion meas-ures or programs that speciically encourage the adoption of a healthy lifestyle (diet and physical activity) by older adults from Florianópolis. Furthermore, it is important that already existing measures and programs are revised and restructured, to account for the relationship between the increased prevalence of obesity and the occurrence of other diseases, such as hypertension and diabetes30.
REFERENCES
1. IBGE. Pesquisa Nacional por Amostra de Domicílios - PNAD de 2011. Rio de Janeiro, 2011, 31:1-135.
2. Carvalho JAM, Rodrígues-Wong LL. A transição da estrutura etária da população brasileira na primeira metade do século XXI. Cad Saúde Pública 2008;24(3):597-605. 3. Malta DC, Castro AM, Gosch CS, Cruz KAC et al. A Política Nacional de Promoção
da Saúde e a agenda da atividade física no contexto do SUS. Epidemiol Serv Saúde 2009;18(1):79-86.
4. Secretaria de Vigilância em Saúde, Ministério da Saúde. VIGITEL Brasil 2010. Vigilância de fatores de risco e proteção para doenças crônicas por inquérito tel-efônico. Brasília: Ministério da Saúde, 2011; Available from: < http://bvsms.saude. gov.br/bvs/publicacoes/vigitel_2010.pdf> [2013 Dec 1].
5. Secretaria de Vigilância em Saúde, Ministério da Saúde. VIGITEL Brasil 2011. Vigilância de fatores de risco e proteção para doenças crônicas por inquérito tel-efônico. Brasília: Ministério da Saúde. 2012; Available from: < http://bvsms.saude. gov.br/bvs/publicacoes/vigitel_brasil_2011.pdf> [2013 Dec 1].
6. Lavie CJ, Milani RV, Ventura HO. Obesity and cardiovascular disease: risk factor, paradox, and impact of weight loss. J Am Coll Cardiol 2009;53:1925-32.
7. Ministério da Saúde. Secretaria Executiva. Datasus. Informações de Saúde. Estatís-ticas vitais. 2012. Available from: <http://tabnet.datasus.gov.br/cgi/tabcgi.exe?sim/ cnv/obt10uf.def> [2013 Feb 1].
8. Haun DR, Pitanga FJG, Lessa I. Razão cintura/estatura comparado a outros indica-dores antropométricos de obesidade como preditor de risco coronariano elevado. Rev Assoc Med Bras 2009;55(6):705-11.
9. Benedetti TRB, Borges LJ, Petroski EL, Gonçalves LHT. Atividade física e estado de saúde mental de idosos. Rev Saúde Publica 2008;42(2):302-7.
10. Barbetta PA. Estatística aplica às ciências sociais. 5th ed. Florianópolis: UFSC, 2003. 11. Giehl MWC, Schneider IJC, Corseuil HX, Benedetti TRB, d’Orsi E. Atividade física
e percepção do ambiente em idosos: estudo populacional em Florianópolis. Rev Saúde Pública 2012;46(3):516-25.
12. Word Health Organization. Risk factor: obesity. 2009. Available from: http://www. who.int/cardiovascular_diseases/en/cvd_atlas_09_obesity.pdf [2013 Feb 1]. 13. Associação Brasileira para o Estudo da Obesidade e da Síndrome Metabólica.
Diretrizes brasileiras de obesidade. 2009/2010. Available from: http://www.abeso. org.br/pdf/diretrizes_brasileiras_obesidade_2009_2010_1.pdf [2014 Jan 30]. 14. Pitanga FJG, Lessa I. Razão cintura-estatura como discriminador do risco
Corresponding author
Aline Mendes Gerage
Rua Mediterrâneo, 145 apto. 301 - Córrego Grande.
CEP: 88037-610 – Florianópolis, SC. Brasil.
E-mail: [email protected]
efônico. Brasília: Ministério da Saúde, 2007; Available from: < http://bvsms.saude. gov.br/bvs/publicacoes/relatorio_vigitel_2006_marco_2007.pdf> [2013 Dec 1]. 16. Sales ADF, César CC, Lima-Costa MF, Caiafa WT. Birth cohort diferences in
anthropometric measures in the older elderly: the Bambuí Cohort Study of Aging (1997 and 2008). Cad Saúde Pública 2011;Suppl.3:S418-26.
17. Capilheira MF, Santos IS. Fatores individuais associados à utilização de consultas médicas por adultos. Rev Saúde Pública 2006;40:436-43.
18. Eiben G, Dey DK, Rothenberg E, Steen B, Björkelund C, Bengtsson C, et al. Obesity in 70-year-old Swedes: secular changes over 30 years. Int J Obesity 2005;29:810-7. 19. Souza AM, Bezerra IN, Cunha DB, Sichieri R. Avaliação dos marcadores de consu-mo alimentar do VIGITEL (2007-2009). Rev Bras Epidemiol 2011;14(1)Suppl.44-52. 20. Erselcan T, Candan F, Saruhan S, Ayca T. Comparison of body composition analysis
methods in clinical routine. Ann Nutr Metab 2000;44:243-8.
21. Sánchez-García S, García-Peña C, Duque-López MX, Juárez-Cedillo T, Cortés-Núñez AR, Reyes-Beaman S. Anthropometric measures and nutritional status in a healthy elderly population. BMC public health 2007;7(2):1-9.
22. Pitanga FJG, Lessa I. Associação entre indicadores antropométricos de obesi-dade e risco coronariano em adultos na ciobesi-dade de Salvador. Rev Bras Epidemiol 2007;10(2):239-48.
23. Silva DAS. Peril sociodemográico e antropométrico de idosos de grupos de con-vivência. Estud Interdiscipl Envelhec 2011,16(1):23-39.
24. Rezende FAC, Rosado LEFPL, Franceschinn SCC, Rosado GP, Ribeiro RCL. Apli-cabilidade do índice de massa corporal na avaliação da gordura corporal. Rev Bras Med Esporte 2010;16(2):90-4.
25. Coutinho T, Goel K, Corrêa de Sá D, Carter RE, Hodge DO, Kragelund C, et al. Combining body mass index with measures of central obesity in the assessment of mortality in subjects with coronary disease: role of “normal weight central obesity”. J Am Coll Cardiol 2013;61(5):553-60.
26. Després JP, Pouliot MC, Moorjani S, Nadeal A, Tremblay A, Lupien PJ, hériault G, Bouchard C. Loss of abdominal fat and metabolic response to exercise training in obese women. Am J Physiol 1991;261(24):E159-67.
27. Ashwell M, Hsieh SD. Six reasons why the waist-to-height ratio is a rapid and efec-tive global indicator for health risks of obesity and how its use could simplify the international public health message on obesity. Int J Food Sci Nutr 2005;56:303-7. 28. McAuley PA, Blair SN. Obesity paradoxes. J Sports Sci 2011;29(8):773-82. 29. Tsai AC, Chang TL. he efectiveness of BMI, calf circumference and mid-arm
circumference in predicting subsequent mortality risk in elderly Taiwanese. Br J Nutr 2011;105(2):275-81.