DOI: http://dx.doi.org/10.5007/1980-0037.2014v16n5p494
original article
Licence Creative Commom
CC
RBCDH
1 Universidade Estadual do Sudoeste da Bahia. Departamento de Saúde. Núcleo de Estudos em Epidemiologia do Envelhecimen-to. Jequié, BA. Brasil
2 Universidade Federal de Santa Catarina. Programa de Pós-Gradu-ação em EducPós-Gradu-ação Física. Centro de Desportos. Florianópolis, SC. Brasil.
Received: 29 October 2013 Accepted: 3 March 2014
Anthropometric reference values for
community-dwelling older adults from
northeastern Brazil
Valores antropométricos de referência para idosos
residentes em comunidade do nordeste Brasileiro
Adriano Rodrigues Brandão Correia1
Raildo da Silva Coqueiro1
Mateus Carmo Santos1
João de Souza Leal Neto1,2
Bruno Morbeck de Queiroz1,2
Aline Rodrigues Barbosa1,2
Marcos Henrique Fernandes1
Abstract– he aging process is continuous and irreversible and is characterized by physi-ological and structural alterations and changes in body composition. he aim of this study was to report anthropometric reference values for community-dwelling older adults from northeastern Brazilaccording to gender and age group. his cross-sectional study used data from an epidemiological population-based study involving 316 older adults. he following measures and anthropometric indicators were evaluated: weight, height, body mass index (BMI), triceps skinfold (TSF), waist circumference, arm circumference, calf circumference, and arm muscle circumference (AMC). All data are reported as means, standard deviations, and percentiles. Comparisons between age groups were performed using one-way ANOVA. he study included 173 women (54.7%) and 143 men (45.3%). Body weight and BMI were higher in younger women (60-64 years) compared to older ones (80 years or older). Arm circumference, TSF and AMC were lower in women aged ≥ 75 years compared to women aged 60-64 years. For men, arm circumference and AMC were lower in the oldest age group (≥ 80 years) compared to the youngest group (60 to 74 years). hese diferences were signiicant. he present study indicates that changes in body measures occur diferently between genders with advancing age. he reduction in muscle mass and body fat is more prominent in women than in men and anthropometric changes are more noticeable in the older age group.
Key words: Aging; Anthropometry; Elderly health; Nutritional status; Reference values.
Physiological and structural alterations and changes in body composition occur during the process of aging, which involve a reduction in height,
muscle mass and bone mass and an increase in body fat1,2. Body weight
increase until about 75 years of age3-5 and the pattern of body fat
distribu-tion undergoes changes characterized by a reducdistribu-tion in subcutaneous fat
and an increase in visceral and intramuscular fat6.
Body measures relect the general health and well-being of individu-als and populations and are widely used for the evaluation of nutritional status based on anthropometric measures and indicators. Anthropometry is a method of determining body measures that can be easily applied in clinical practice, health services and epidemiological studies since it is
noninvasive and inexpensive7.
In the 1990s, the World Health Organization published
recommenda-tions8 for each country to develop its own anthropometric reference data
in view of the diversity among populations in terms of genetic, environ-mental, socioeconomic, cultural, lifestyle, and health conditions, among
others9. Anthropometric reference values were published for the elderly
population of the United States3, Italy9 and Ireland10 in order to distinguish
this population and to accurately evaluate anthropometric characteristics
and nutritional status. Studies conducted in Chile11, Cuba5 and Mexico12
reported anthropometric reference data for the elderly population of their respective capitals.
In Brazil, a literature search (Scopus, Medline and Lilacs) identiied four studies reporting anthropometric reference values for noninstitution-alized older adults from speciic localities, including three cross-sectional studies and one longitudinal study. he cross-sectional studies involved
older adults living in the cities of São Paulo4, Joinvile13 and Fortaleza14.
he follow-up study was conducted in São Paulo15. However, the study
conducted in Fortaleza14 reported only indicators of fat and muscle mass.
hese studies provided reference data that could be used in clinical practice and surveillance studies of elderly populations with similar characteristics.
Since Brazil is a large, multiracial country characterized by cultural, economic and social diversity, anthropometric studies conducted in difer-ent localities, in addition to relecting regional characteristics, may serve as a reference for similar populations. herefore, the objective of the present study was to report anthropometric reference values for noninstitutional-ized older adults from a small town in the northeastern region of Brazil according to age and gender.
METHODOLOGICAL PROCEDURES
Participants
Anthropometric values for older adults Correia et al.
behaviors and health conditions of older adults from Lafaiete Coutinho, Bahia”. Data regarding the characteristics of the municipality studied,
population and data collection have been published previously16 and will
be summarized briely.
he study population was identiied by a census (January 2011) and all subjects aged 60 years or older who lived in the urban area (n = 355) were contacted to participate in the study. he households were localized based on data from the Family Health Strategy (Estratégia Saúde da Família) program, which covers 100% of the municipality. A total of 316 subjects (89%) participated in the study; 17 (4.8%) subjects refused to participate and 22 (6.2%) could not be localized ater three home visits on alternate days and were considered to be losses.
he data were collected in two steps: irst, a home interview was con-ducted and then the anthropometric measurements were performed at the two Family Health Units of the municipality. he second step was scheduled at an interval of 1 to 3 days ater the home interview.
he study protocol was approved by the Ethics Committee of Uni-versidade Estadual do Sudoeste da Bahia (Permit No. 064/2010) and was conducted in accordance with the Declaration of Helsinki of the World Medical Association.
Anthropometry: procedures and instruments
he anthropometric data were collected by three students of the Physical Education course who received theoretical and practical training in order to standardize the anthropometric techniques. he precision and accu-racy of the examiners had been conirmed prior to data collection in 20 volunteers by the analysis of inter- and intraexaminer technical errors of
measurement17. All examiners showed precision and accuracy compatible
with those of experienced examiners.
Body weight was measured with a portable digital scale (Zhongshan Camry Electronic scale, G-Tech Glass 6, China), with the subject barefoot and wearing minimum clothing. Height was measured as described by
Frisancho18 using a compact portable stadiometer (Wiso, China).
he circumference parameters were measured with an inelastic an-thropometric tape and triceps skinfold (TSF) was measured with a skinfold caliper (WCS, Brazil). Waist circumference was measued at the level of the umbilical scar. Arm and calf circumferences were measured as described
by Callaway et al.19. TSF was obtained according to Harrison et al.20. All
anthropometric measurements, except for body weight, were obtained in triplicate and the mean values were used for analysis. he body mass index
[BMI = body weight (kg)/height2 (m2)] and arm muscle circumference
[AMC = arm circumference – π x TSF] were calculated.
Statistical analysis
65-and Tukey’s 65-and Bonferroni’s tests (multiple comparisons) were used to determine diferences between the means of the anthropometric variables according to age group. he level of signiicance was set at 5% (α = 0.05). All analyses were performed using the IBM SPSS Statistics sotware for Windows (IBM SPSS. 21.0, 2012, IBM Corp., Armonk, NY).
RESULTS
A total of 173 women (54.7%) ranging in age from 60 to 103 years (74.9 ± 10.0 years) and 143 men ranging in age from 60 to 105 years (73.4 ± 9.4 years) were studied. All measurements were performed on subjects who were able to walk. Bedridden subjects (n = 5) and wheelchair users (n = 2) were excluded and 12 subjects refused to perform the measurements.
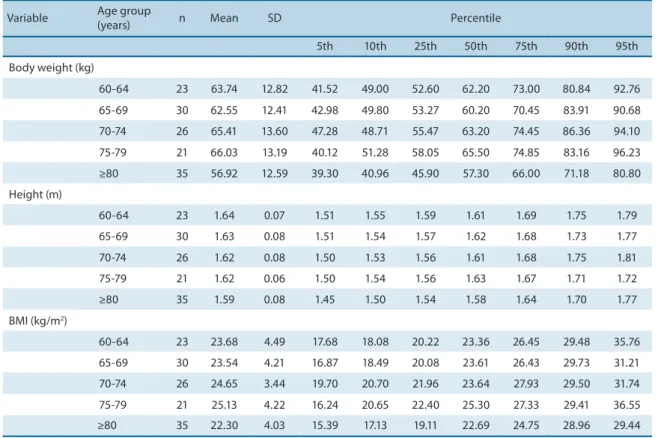
Table 1 (women) and Table 2 (men) show the body weight, height and BMI (means, standard deviations and percentiles) according to age group. Body weight and BMI were higher in women aged 60-64 years when com-pared to women aged 80 years or older. When women of the youngest age group (60-64 years) were compared to the oldest age group (≥ 80 years), the
reductions in the values of the 2nd quartile were 17.5% (10.8 kg) and 17.9%
(5 kg/m2) for body weight and BMI, respectively. No diferences between
age groups were observed for body weight and BMI in men and for height in men or women.
Table 1. Body weight, height and body mass index of women ≥ 60 years.
Variable Age group
(years) n Mean
† SD Percentile
5th 10th 25th 50th 75th 90th 95th
Body weight (kg)*
60-64 29 62.17a 12.61 43.10 47.30 53.00 61.80 70.05 81.00 90.10
65-69 28 55.41ab 13.69 34.83 40.00 45.85 55.90 64.00 71.34 88.04
70-74 31 56.79ab 11.29 38.74 40.98 50.40 56.40 63.00 72.90 82.02
75-79 24 56.52ab 8.97 43.10 44.95 49.12 55.45 64.12 68.75 75.55
≥80 49 51.40b 10.35 34.30 36.90 44.55 51.00 58.05 65.80 72.15
Height (m)
60-64 29 1.51 0.07 1.35 1.40 1.48 1.51 1.55 1.58 1.64
65-69 28 1.49 0.06 1.38 1.40 1.45 1.50 1.53 1.58 1.59
70-74 31 1.49 0.06 1.38 1.42 1.44 1.48 1.53 1.58 1.60
75-79 24 1.48 0.06 1.35 1.41 1.45 1.49 1.53 155 1.57
≥80 50 1.47 0.06 1.37 1.38 1.42 1.47 1.52 1.53 1.58
BMI (kg/m2)*
60-64 29 27.34a 5.25 19.97 20.68 22.92 27.94 32.15 34.36 37.40
65-69 28 24.77ab 5.31 16.19 18.65 21.17 24.40 27.63 32.61 37.77
70-74 31 25.63ab 4.94 16.66 19.00 22.59 25.38 29.22 32.68 34.75
75-79 24 25.69ab 3.40 20.29 21.78 22.64 25.18 28.07 30.80 33.02
≥80 49 23.88b 4.96 16.03 17.83 20.36 22.94 26.84 30.73 32.65
SD, standard deviation; BMI, body mass index. * p ≤ 0.05, signiicant diference in mean values between age groups (analysis of variance). † Means followed
Anthropometric values for older adults Correia et al.
Table 2. Body weight, height and body mass index of men ≥ 60 years.
Variable Age group
(years) n Mean SD Percentile
5th 10th 25th 50th 75th 90th 95th
Body weight (kg)
60-64 23 63.74 12.82 41.52 49.00 52.60 62.20 73.00 80.84 92.76
65-69 30 62.55 12.41 42.98 49.80 53.27 60.20 70.45 83.91 90.68
70-74 26 65.41 13.60 47.28 48.71 55.47 63.20 74.45 86.36 94.10
75-79 21 66.03 13.19 40.12 51.28 58.05 65.50 74.85 83.16 96.23
≥80 35 56.92 12.59 39.30 40.96 45.90 57.30 66.00 71.18 80.80
Height (m)
60-64 23 1.64 0.07 1.51 1.55 1.59 1.61 1.69 1.75 1.79
65-69 30 1.63 0.08 1.51 1.54 1.57 1.62 1.68 1.73 1.77
70-74 26 1.62 0.08 1.50 1.53 1.56 1.61 1.68 1.75 1.81
75-79 21 1.62 0.06 1.50 1.54 1.56 1.63 1.67 1.71 1.72
≥80 35 1.59 0.08 1.45 1.50 1.54 1.58 1.64 1.70 1.77
BMI (kg/m2)
60-64 23 23.68 4.49 17.68 18.08 20.22 23.36 26.45 29.48 35.76
65-69 30 23.54 4.21 16.87 18.49 20.08 23.61 26.43 29.73 31.21
70-74 26 24.65 3.44 19.70 20.70 21.96 23.64 27.93 29.50 31.74
75-79 21 25.13 4.22 16.24 20.65 22.40 25.30 27.33 29.41 36.55
≥80 35 22.30 4.03 15.39 17.13 19.11 22.69 24.75 28.96 29.44
SD, standard deviation; BMI, body mass index.
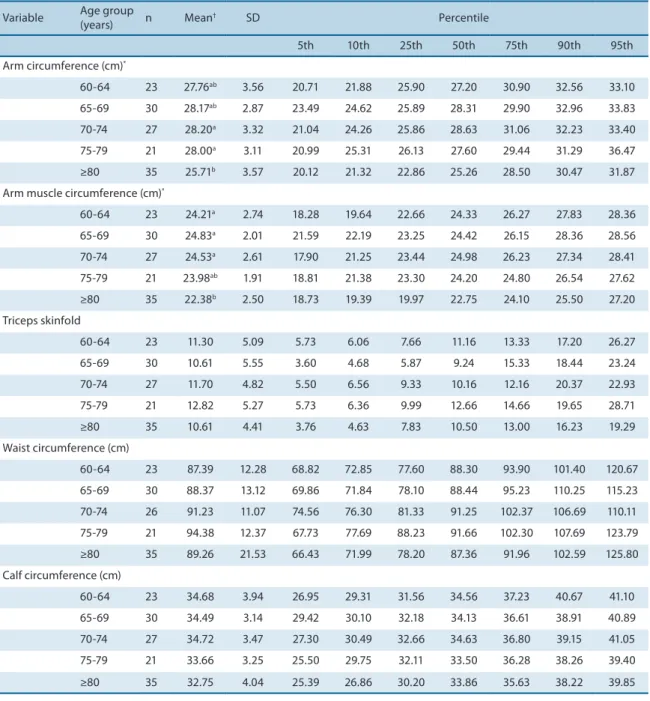
he distributions (means, standard deviations and percentiles) for arm circumference, AMC, TSF and waist and calf circumferences are shown in Tables 3 and 4 for women and men, respectively. In women, arm circumference and AMC were higher in the age group of 60-64 years compared to women aged ≥75 years and ≥80 years, respectively. In men, a signiicant diference was observed for arm circumference, with higher values in the age group of 70-79 years compared to the oldest adults (≥ 80 years). AMC was higher in men aged 60-74 years when compared to the oldest age group (≥ 80 years).
here was a signiicant diference in TSF and calf circumference ac-cording to age group in women. Reductions in these two parameters were observed at 75 years and 80 years, respectively.
DISCUSSION
A literature search (Scopus, Medline, Lilacs) indicates that this is the irst population-based household study conducted in northeastern Brazil which reports gender- and age-speciic reference values (means and percentiles) of the main anthropometric measures and indicators for noninstitutional-ized older adults.
signiicantly between age groups. A signiicant diference in arm circumfer-ence and AMC was observed in both genders.
Female body weight difered between the age group of 60-64 years and the oldest age group (≥ 80 years), with a diference of 10.7 kg (17.3%). he same reduction was not observed in men. hese results difer from studies
conducted in Brazil4,15 and in other countries3,5,9-11, which demonstrated weight
reductions in both genders.
he present results showed no changes in height with increasing age in
men or women. Similar results have been reported by Cheserek et al.12 and
Mastroeni et al.13 in an international and a national study, respectively.
How-ever, the results difer from those reported in studies conducted in Italy9,
Variable Age group
(years) n Mean
† SD Percentile
5th 10th 25th 50th 75th 90th 95th
Arm circumference (cm)*
60-64 29 30.65a 4.36 24.33 25.23 27.28 30.60 33.50 30.96 41.43
65-69 28 28.38ab 4.43 20.14 22.56 25.60 27.91 31.32 35.81 37.44
70-74 31 28.31ab 3.66 22.10 23.05 25.93 28.30 30.03 35.07 35.91
75-79 24 27.63b 2.20 23.08 24.86 26.08 27.61 29.25 30.39 32.15
≥80 51 25.97b 4.34 18.29 20.78 22.86 25.96 29.03 31.67 33.93
Arm muscle circumference (cm)*
60-64 29 22.65a 2.14 18.65 19.79 21.47 22.07 24.18 25.63 26.76
65-69 28 21.54ab 2.36 17.52 18.43 20.03 21.26 22.54 24.60 27.48
70-74 31 21.46ab 2.21 16.72 18.15 20.24 21.53 23.29 23.73 24.73
75-79 24 21.45ab 1.84 17.94 18.28 20.55 21.53 22.73 23.97 24.94
≥80 50 20.79b 2.45 16.57 17.40 19.15 20.83 22.06 24.54 26.19
Triceps skinfold (mm)*
60-64 29 25.49a 9.55 12.33 14.00 16.66 23.83 31.33 38.50 46.74
65-69 28 21.81ab 8.56 6.97 9.66 15.53 22.66 29.08 32.31 37.33
70-74 31 21.82ab 7.04 12.06 13.27 16.16 21.83 25.66 33.80 36.90
75-79 24 19.71b 5.94 11.66 12.74 16.16 17.99 22.99 29.24 34.70
≥80 50 16.78b 8.16 4.06 6.55 11.16 15.74 21.66 27.68 34.95
Waist circumference (cm)
60-64 29 96.36 12.44 75.13 80.30 87.59 95.13 106.08 116.40 119.58
65-69 28 90.84 12.73 68.56 75.87 80.85 91.09 98.65 105.52 117.72
70-74 31 96.68 13.06 71.72 79.54 85.70 96.30 107.56 112.72 118.46
75-79 23 97.89 10.14 76.51 83.34 91.23 100.33 104.33 109.66 114.21
≥80 49 93.44 13.08 70.88 72.76 84.11 93.76 101.33 111.33 115.16
Calf circumference (cm)*
60-64 29 34.70a 2.75 30.38 30.93 32.58 34.86 36.61 38.33 40.50
65-69 28 32.93ab 3.39 26.87 28.51 31.05 32.41 34.34 38.37 40.95
70-74 31 33.71a 3.02 28.28 29.22 31.40 33.66 36.26 37.05 39.59
75-79 24 32.52ab 2.43 27.50 29.55 30.83 32.21 34.10 36.03 37.22
≥80 51 30.75b 3.75 23.31 24.72 28.10 30.80 33.46 35.53 36.85
SD, standard deviation. * p ≤ 0.05, signiicant diference in mean values between age groups (analysis of variance). † Means followed by diferent
Anthropometric values for older adults Correia et al.
Ireland10, Chile11, Cuba5 and São Paulo4, which showed a shorter height in
older seniors compared to younger ones. he diferences between results can be attributed to the peculiar characteristics of the older adults studied, or to the sample size of those studies which involved a larger number of participants, thus guaranteeing greater statistical power.
A signiicant reduction in BMI was only observed for women aged ≥ 80 years, a inding also demonstrated in previous studies conducted in
Brazil4 and in other countries5,9-11. Considering the cut-of values adopted
by the Food and Nutritional Surveillance System (Sistema de Vigilância
Table 4. Anthropometric values obtained for men ≥ 60 years.
Variable Age group
(years) n Mean† SD Percentile
5th 10th 25th 50th 75th 90th 95th
Arm circumference (cm)*
60-64 23 27.76ab 3.56 20.71 21.88 25.90 27.20 30.90 32.56 33.10
65-69 30 28.17ab 2.87 23.49 24.62 25.89 28.31 29.90 32.96 33.83
70-74 27 28.20a 3.32 21.04 24.26 25.86 28.63 31.06 32.23 33.40
75-79 21 28.00a 3.11 20.99 25.31 26.13 27.60 29.44 31.29 36.47
≥80 35 25.71b 3.57 20.12 21.32 22.86 25.26 28.50 30.47 31.87
Arm muscle circumference (cm)*
60-64 23 24.21a 2.74 18.28 19.64 22.66 24.33 26.27 27.83 28.36
65-69 30 24.83a 2.01 21.59 22.19 23.25 24.42 26.15 28.36 28.56
70-74 27 24.53a 2.61 17.90 21.25 23.44 24.98 26.23 27.34 28.41
75-79 21 23.98ab 1.91 18.81 21.38 23.30 24.20 24.80 26.54 27.62
≥80 35 22.38b 2.50 18.73 19.39 19.97 22.75 24.10 25.50 27.20
Triceps skinfold
60-64 23 11.30 5.09 5.73 6.06 7.66 11.16 13.33 17.20 26.27
65-69 30 10.61 5.55 3.60 4.68 5.87 9.24 15.33 18.44 23.24
70-74 27 11.70 4.82 5.50 6.56 9.33 10.16 12.16 20.37 22.93
75-79 21 12.82 5.27 5.73 6.36 9.99 12.66 14.66 19.65 28.71
≥80 35 10.61 4.41 3.76 4.63 7.83 10.50 13.00 16.23 19.29
Waist circumference (cm)
60-64 23 87.39 12.28 68.82 72.85 77.60 88.30 93.90 101.40 120.67
65-69 30 88.37 13.12 69.86 71.84 78.10 88.44 95.23 110.25 115.23
70-74 26 91.23 11.07 74.56 76.30 81.33 91.25 102.37 106.69 110.11
75-79 21 94.38 12.37 67.73 77.69 88.23 91.66 102.30 107.69 123.79
≥80 35 89.26 21.53 66.43 71.99 78.20 87.36 91.96 102.59 125.80
Calf circumference (cm)
60-64 23 34.68 3.94 26.95 29.31 31.56 34.56 37.23 40.67 41.10
65-69 30 34.49 3.14 29.42 30.10 32.18 34.13 36.61 38.91 40.89
70-74 27 34.72 3.47 27.30 30.49 32.66 34.63 36.80 39.15 41.05
75-79 21 33.66 3.25 25.50 29.75 32.11 33.50 36.28 38.26 39.40
≥80 35 32.75 4.04 25.39 26.86 30.20 33.86 35.63 38.22 39.85
SD, standard deviation. * p ≤ 0.05, signiicant diference in mean values between age groups (analysis of variance). † Means followed by diferent
as low weight, this condition is present in both genders in an important
proportion of the population. Values < 22 kg/m2 were observed for P10 (age
groups: 60-64, 70-74 and 75-79 years) and P25 (age groups: 65-69 and ≥ 80 years) among women, and particularly for P25 among men. his inding might be related to the poor health indicators and socioeconomic
condi-tions of the population studied22.
In both genders, mean arm circumference was signiicantly lower in the older age groups, ≥ 75 years (women) and ≥ 80 years (men),
suggest-ing a reduction with increassuggest-ing age as identiied in other studies4,5,10,11.
his reduction is due to a loss of subcutaneous fat and muscle mass with
advancing age23.
With respect to muscle mass indicators, signiicant diferences in AMC with increasing age were observed in men and women, in agreement with
other studies4,5. Calf circumference was only reduced in women, although
other authors have observed a reduction in this measurement in both
genders4,5. Calf circumference and AMC are estimates of muscle reserves.
A reduction in muscle mass is associated with sarcopenia which, in turn,
can reduce functional capacity and increase the risk of falls24.
he results showed that the diferences in TSF occurred only in women and ater 75 years of age, following the same trend as observed for arm
circum-ference. hese indings agree with Corish and Kennedy10 who, studying Irish
older adults, suggested that the reduction in fat mass is more intense in women
than in men. However, studies conducted in Chile11, Cuba5 and Brazil4 have
shown a reduction in TSF in both genders. TSF is an indicator of body adiposity
and is recommended for the assessment of nutritional status in older adults7.
Male and female waist circumference did not show signiicant changes as a function of age. Analysis of the cut-of values related to cardiovascular
risk25 (≥ 88 cm for women and ≥ 102 cm for men) showed an increased
risk for developing cardiovascular diseases in women on P25 for waist circumference (age group of 75-79 years) and especially on P50 (other age groups). In men, this condition was observed for P75 (age groups of 70-74 and 75-79 years) and P90 (age groups of 60-64, 65-69 and ≥ 80 years), indi-cating a lower prevalence of central obesity among men. It should be noted that the risk values were established for adults younger than 60 years and no reference values are available for older adults. he high prevalence of inadequate waist circumference among women might be explained by the postmenopausal period, which is characterized by a decrease in estrogen
and a consequent increase in abdominal fat26.
he design of the present study does not permit to determine how the anthropometric variables studied would afect the anthropometric char-acteristics of these older adults. In this respect, the cross-sectional design of the study limits inferences about body changes. However, the results are consistent with those of longitudinal studies.
Anthropometric values for older adults Correia et al.
nutritional status of older adults designed to establish public policies in communities with characteristics similar to those of the population studied.
CONCLUSION
he anthropometric data obtained here can be used as reference values for the older adults studied and for populations with similar characteristics. he present study indicates that changes in body measures occur diferently between genders with advancing age.
Acknowledgements
We thank the Municipal Health Department of Lafaiete Coutinho, Bahia, and the older adults who participated in the study. he inancial support of Universidade Estadual do Sudoeste da Bahia - UESB (Grants 117/2009 and 011/2010) and Fundação de Amparo a Pesquisa do Estado da Bahia - FAPESB (Grant PPP0070/2011) is acknowledged.
REFERENCES
1. Nair KS. Aging muscle. Am J Clin Nutr 2005;8(5)1:953-63.
2. Goodpaster BH, Park SW, Harris TB, Kritchevsky SB, Nevitt M, Schwartz AV, et al. he loss of skeletal muscle strength, mass, and quality in older adults: the health, ag-ing and body composition study. J Gerontol A Biol Sci Med Sci 2006;61(10):1059-64.
3. Kuczmarski MF, Kuczmarski RJ, Najjar M. Descriptive anthropometric reference data for older Americans. J Am Diet Assoc 2000;100(1):59-66.
4. Barbosa AR, Souza JMP, Lebrão ML, Laurenti R, Marucci MF. Anthropometry of el-derly residents in the city of São Paulo, Brazil. Cad Saúde Pública 2005;21(6):1929-38.
5. Coqueiro RS, Barbosa AR, Borgatto AF. Anthropometric measurements in the elderly of Havana, Cuba: Age and sex diferences. Nutrition 2009;25(1):33-9.
6. Sepe A, Tchkonia T, homou T, Zamboni M, Kirkland JL. Aging and regional diferences in fat cell progenitors - a mini-review. Gerontology 2011;57(1):66-75.
7. World Health Organization. Physical status: the use and interpretation of anthro-pometry. Report of a WHO Expert Committee. World Health Organ Tech Rep Ser 1995;854:1-452.
8. de Onis M, Habicht JP. Anthropometric reference data for international use: rec-ommendations from a World Health Organization Expert Committee. Am J Clin Nutr 1996; 64(4):650-8.
9. Perissinotto E, Pisent C, Sergi G, Grigoletto F, Enzi G. Anthropometric measure-ments in the elderly: age and gender diferences. Br J Nutr 2002; 87(2):177-86.
10. Corish CA, Kennedy NP. Anthropometric measurements from a cross-sectional survey of Irish free-living elderly subjects with smoothed centile curves. Br J Nutr 2003; 89(1):137-45.
11. Santos JL, Albala C, Lera L, Garcia C, Arroyo P, Perez-Bravo F, et al. Anthro-pometric measurements in the elderly population of Santiago, Chile. Nutrition 2004;20(5):452-7.
12. Velasquez-Alva MC, Irigoyen CME, Zepeda ZM, Sanchez MVM, Garcia JL, Cis-neros MP, et al. Anthropometric measurements of sixty-year and older Mexican urban group. J Nutr Health Aging 2003; 7:1-5.
13. Mastroeni MF, Mastroeni SS, Erzinger GS, Marucci MFN. Antropometria de idosos residentes no município de Joinville-SC, Brasil. Rev Bras Geriatr Gerontol 2010;13(1):29-40.
Corresponding author
João de Souza Leal Neto Universidade Estadual do Sudoeste da Bahia.
Departamento de Saúde. Núcleo de Estudos em Epidemiologia do Envelhecimento.
Av. José Moreira Sobrinho, S/N, Jequiezinho,
45206-190 - Jequié - BA, Brasil. E-mail: [email protected]
(health, well-being, and aging). J Obes 2013;2013:695496.
16. Leal Neto JS, Coqueiro RS, Freitas RS, Fernandes MH, Oliveira DS, Barbosa AR. Anthropometric indicators of obesity as screening tools for high blood pressure in the elderly. Int J Nurs Pract 2013;19(4):360-7.
17. Pederson D, Gore C. Erros de medição em antropometria. In: Norton K, Olds T. Antropométrica. Porto Alegre: Artmed; 2005.
18. Frisancho AR. Anthropometric standards for the assessment of growth and nutri-tional status. Ann Arbor: he University of Michigan Press; 1990.
19. Callaway WC, Chumlea WC, Bouchard C, Himes JH, Lohman TG, Martin AD, et al. Circumferences. In: Lohman TG, Roche AF, Martorell R; editors. Anthropometric Standardization Reference Manual. Champaign: Human Kinetics, 1988; p. 39-54.
20. Harrison GG, Buskirk RE, Carter JEL, Johnson FE, Lohman TG, Pollock ML, et al. Skinfold thicknesses. In: Lohman TG, Roche AF, Martorell R, editors. Anthropo-metric standardization reference manual. Champaign, Illinois: Human Kinetics, 1988. p.55-70.
21. Sistema de Vigilância Alimentar e Nutricional/SISVAN. Brasil. 2008. Available from:<http://www.fag.edu.br/professores/fabiana/Est%E1gio%20ESCOLA/pro-tocolo_sisvan.pdf> [2013 Jan 1].
22. Instituto Brasileiro de Geograia e Estatística (IBGE). IBGE Cidades: Brasil.2010; Available from: <www.ibge.gov.br/cidadesat/xtras/peril.php?codmun=291870> [2013 Jul 16].
23. Bufa R, Floris GU, Putzu PF, Marini E. Body composition variations in ageing. Coll Antropol 2011;35(1):259-65.
24. Fielding RA, Vellas B, Evans WJ, Bhasin S, Morley JE, Newman AB, et al. Sarco-penia: an undiagnosed condition in older adults. Current consensus deinition: prevalence, etiology, and consequences. J Am Med Dir Assoc 2011;12(4):249-56.
25. Han TS, van Leer EM, Seidell JC, Lean ME. Waist circumference action levels in the identiication of cardiovascular risk factors: prevalence study in a random sample. BMJ 1995;311(7017):1401-5.