BRAZILIAN SECTOR
Clezio M. Denardini,
1Mangalathayil A. Abdu,
2José H. A. Sobral
3 Recebido em 14 mar. ,2003 / Aceito em 20 fev., 2004Received Mar. 14, 2003 / Accepted Feb. 20, 2004
ABSTRACT
We carried out an equatorial electrojet campaign in December 1999, using the RESCO coherent backscatter radar at São Luís, at the geomagnetic equator. In this paper we selected the period from December 11 through December 19, which covers both relatively disturbed and quiet days. For this period 16 spectrograms were obtained for each day of observation with each spectrogram corresponding to one range gate. The first gate corresponds to 97.4-km height while the last gate corresponds to 115.6-km and they were sampled at 2.6-km intervals. Daily Range Time Intensity maps were generated for this period. Through the analysis of the spectrograms and considering the enhancements in the equatorial electrojet observed in the evening of some days, it was possible to observe three distinct regions as identified earlier by Pfaff and others (1987) and Kudeki and others (1987). Indeed, our observations agree with the Condor Equatorial Electrojet Campaign results. We have used the auroral activity indexes AU and AL as well as the equatorial ring current index Dst to evaluate the response of the equatorial electrojet to magnetic disturbances.
Keywords: 3-meter Ionospheric Irregularities, Two-Stream Instabilities, Gradient Drift Instabilities, Equatorial Electrojet, Coherent Back-scatter Radar.
RESUMO
Em dezembro de 1999 realizou-se uma campanha de coleta de dados do eletrojato equatorial, usando-se o radar de espalhamento coerente (RESCO), em São Luís, sob o equador magnético. Neste artigo, selecionamos o período de 11 a 19 de dezembro, que cobre uma etapa magneticamente calma e outra relativamente perturbada. Para este período, 16 espectrogramas foram obtidos a cada dia de observação, onde cada espectrograma corresponde a uma faixa de amostragem em altura. A primeira faixa de amostragem esta centrada em 97,4 km de altitude, enquanto a última corresponde à altura central de 115,6 km, e cada faixa possui uma extensão de 2,6 km. Mapas Diários de Variação Temporal de Intensidade foram gerados para o referido período. Pela análise dos espectrogramas e considerando a intensificação do eletrojato equatorial ao entardecer de alguns dias, foi possível observar três regiões distintas como já foi mencionado por Pfaff et al (1987) e Kudeki et al (1987). Na verdade, nossas observações concordam com os resultados da Campanha Condor de observação do eletrojato. Usamos os índices de atividade auroral AU e AL, além do índice Dst, relacionado à corrente anelar, para avaliar a resposta do eletrojato equatorial às perturbações magnéticas. Palavras-chave: Irregularidades Ionosféricas de três metros, instabilidades de dois feixes, instabilidades do tipo deriva de gradiente, eletrojato equatorial, radar de espalhamento coerente.
1 Instituto Nacional de Pesquisas Espaciais - Divisão de Aeronomia CEA. Av. Dos Astronautas, 1758 12201-970, São José dos Campos, SP, Brasil Fone: (12) 3545-7156 Fax: (12)
3945-6990 E-mail: [email protected].
2 Instituto Nacional de Pesquisas Espaciais Divisão de Aeronomia CEA. Av. Dos Astronautas, 1758 12201-970, São José dos Campos, SP, Brasil Fone: (12) 3545-7149 Fax: (12)
3945-6990 E-mail: [email protected].
3 Instituto Nacional de Pesquisas Espaciais Divisão de Aeronomia CEA. Av. Dos Astronautas, 1758 12201- 970, São José dos Campos, SP, Brasil. Fone: (12) 3545-7147 Fax: (12)
fluctuations in the local plasma density called plasma irregularities. The main characteristics of these irregularities are: (a) they are magnetic field aligned; (b) they have larger extensions along the magnetic field line than parallel to it; and (c) they have been observed during day and night, except during sunrise and sunset. We have used the RESCO coherent backscatter VHF radar at the equatorial station São Luís (2.33° S; 44.2° W; dip: -0.5 °), to investigate the behavior of the 3-m irregularities in the Brazilian sector during quiet and disturbed conditions.
THE 50 MHZ VHF RADAR SYSTEM
The RESCO 50 MHz coherent back-scatter radar was developed and constructed at INPE for the EEJ investigation and has been fully operational at São Luís - SLZ since 1999 when EEJ 3-meter plasma irregularity observations started being routinely carried out according to the International Geophysical Calendar days or some time based on emerging requirements. The basic features of the radar system details at the time the data set used in the present work was collected were: a) Modular transmitter system consisting of 8 phase locked transmitters; b) Attainable total peak power: 120 kW;
c) Antenna system for transmission and reception: coaxial collinear broadside array of 16 antennas, each antenna having 48 dipoles aligned in magnetic North-South; and
d) Two-way beam widths: ~5o E-W plane and ~2.5o N-S plane,
settable in east-west plane.
In December 1999, the radar was operated to investigate the daytime EEJ 3-meter plasma irregularities using the following operational mode:
a) Peak power: ~40 kW;
(
)
2 sin / 2
radar irregularity
λ λ
θ
= , (1)
with θ being the angle between the wave vectors of the transmitted
radar signal and the backscattered echo. In case of monostatic radar,
such as RESCO, θ is equal to 180º. Hence, we will find that coherent
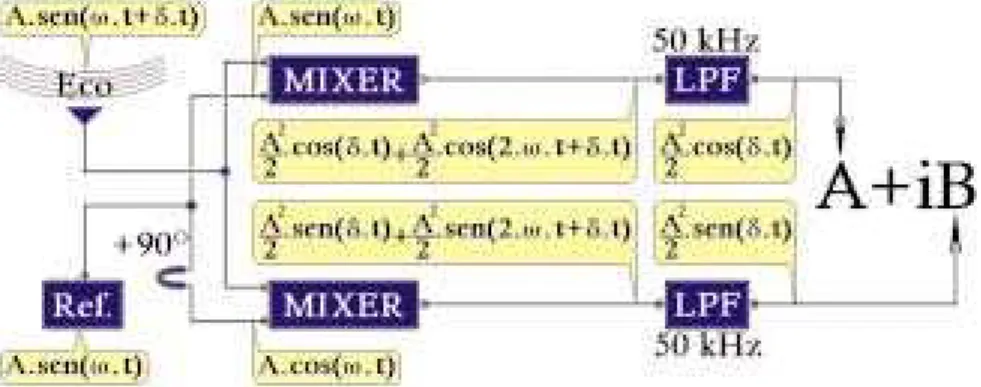
backscattered echoes will be received by the RESCO radar when 3-meter plasma irregularities are present in the electrojet. Besides indicating the presence of these irregularities, backscattered echoes carry information about the Doppler effect caused by the westward drift of these instabilities. Figure 1 illustrates how the Doppler frequencies are obtained from one single echo, using the RESCO acquisition system.
According to this illustration, backscattered echoes received by the antenna array are split into two identical signals. These signals are compared with the reference signals through two-phase coherent detectors which provide in-phase and quadrature signals containing the Doppler deviation in the radar frequency. Each mixed signal passes through individual 50 kHz low-pass filters in order to remove the high frequency components. The two resulting signals are the real and the imaginary component of the Doppler effect. The two components of the complex signal are sampled in time, which also corresponds to sample in height provided that the electromagnetic wave travels at the light speed. These are called range gate samples. The on-line process finished with these samples is stored in a binary file. This data processing repeats for each transmitted pulse. After 1024 pulses the binary file is closed and another file is initiated until the system is tuned off. Usually, a binary file corresponds to 6 s of radar operation, and the radar is frequently operated from 0800 to 1900 LT.
Data Analysis begins with an off-line FFT analysis. 1024-sample sets from the same range gate are processed individually. Each FFT
processing provides one spectral distribution of the Doppler frequencies for a given range gate (height). After analyzing all sets of 1024 samples from one range gate in each binary file acquired we have a time series of spectra. Repeating this procedure for all samples we will have several time series of spectra, each one corresponding to one range gate sounded by the RESCO radar. These series of spectra are plotted as contour color maps called spectrograms, where the x-axis corresponds to time, the y-axis corresponds to the Doppler frequency and the color scale gives the amplitude of the Fourier component. By integrating in frequency each spectrogram we are able to obtain the time variation of echo power received at the height in which the spectrogram corresponds. Now, daily Range Time Intensity (RTI) map can be obtained by grouping the time variation of echo power received per height and time. Thus, RTI maps are contour color maps with the x-axis corresponding to time, the y-axis corresponding to the height where the echo where sampled and the color scale giving the amplitude of the echo power.
RESULTS AND DISCUSSION
In December 1999 RESCO coherent backscatter VHF radar has been operated in an equatorial electrojet campaign during daytime using the switching beam operational mode. We have stored echoes from the EEJ during several days, from which we selected six representative days: three disturbed days (December 11, 12 and 13) and others three
considered calm days (December 15, 16 and 17). Notice that the transition from disturbed to calm period occurred in one week only.
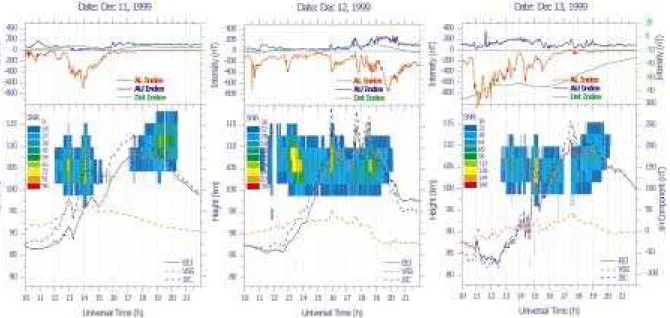
In this section we summarize and discuss the results we obtained during the 1999 Campaign. In figure 2 we present the three disturbed days. For each day, the top panel shows 1-minute resolution auroral indices AL (red line) and AU (blue line) referred to the left scale, and the
hourly ring current index Dst (green line) referred to the right scale. The
bottom panel shows the daily RTI map superimposed to the magnetic
field H-component variation (that is, the ∆H variation with respect to
the midnight values of the H-component) over two sites: Jicamarca
(12° S, 76.9° W, dip: 1°) in Peru, and Vassouras (22.4° S, 43.7° W, dip: -34°) in Brazil. The bottom panel also shows the disturbed effect
obtained from the difference between Jicamarca and Vassouras H
-component variation.
The auroral indices of the three disturbed days are marked by several episodes of intensification and decay that are characteristics of
sub-storms, while the Dst increase that characterizes a magnetic storm
event occurred only on December 13. On December 12 we emphasize the three sub-storms: at 1300 UT (morning local time), at 1500 UT (around local midday), and at 1915 UT (later in the local noon). During the first one we see no correlation between the auroral indices and the disturbed effect; nevertheless, we certainly see correlation between the auroral indices and the backscattered power from the EEJ irregularities. In the evening no correlation is observed either with the RTI map. Figure 1 Illustration of the real time data processing to obtain the Doppler effect from a single echo, which was backscatter by the 3-meter plasma irregularities
and received at the RESCO radar antenna array.
Figure 2 Range Time Intensity (RTI) maps from three disturbed days: December 11th, 12th and 13th. The top panel of each graph shows the auroral indices
(AU and AL) and the ring current index (Dst). The bottom panel shows the RTI map superimposed by the horizontal component of the Earth magnetic field measured with magnetometer at Vassouras (red dashed curve) and Jicamarca (blue dashed curve).
The black line also superimposed to the RTI map is the EEJ estimated effect.
Figura 2 ` Mapa de variação temporal de intensidade (RTI) dos três dias perturbados: 11, 12 e 13 de dezembro. O gráfico superior de cada figura mostra a variação dos índices aurorais (AU e AL) e do índice da corrente anelar (Dst). Os gráficos inferiores mostram o mapa RTI sobreposto pela componente horizontal do campo magnético terrestre medido com magnetômetros em Vassouras (linha vermelha tracejada) e Jicamarca (linha azul tracejada).
A linha preta, também sobreposta ao mapa RTI, é o efeito perturbado estimado.
However, around midday we observe an excellent correlation among the auroral indices, the disturbed effect, and backscattered power. The characteristics of these correlations during this day can be explained by the variation of the ionospheric conductivity throughout the day. Earlier in the morning and latter in the noon the ionospheric conductivity is very low compared with that around midday, when the ionization rate is very high. This low conductivity in these periods strongly decreases or totally inhibits the effects of field propagations and, in some cases.
On December 13 a strong magnetic storm (-1000 nT) starts at 1045 UT and continues until almost 1400 UT. It seems also that two other storms start during its recovery phase. The variation in the auroral
indices and disturbance H-component during 1000-1700 UT on
December 13 are shown blown out in figure 3 for more detailed examination of the correlation between these two parameters. In the upper panel of this figure the daily variation of 1-minute auroral index on December 13 is superimposed to that of December 14, a very quiet
day. In the lower panel of this figure the disturbance H-component
variation on December 13 over Jicamarca is compared with that of December 14 taken as a reference quiet day curve. These curves may
not represent the absolute values of the H-component variation over
Jicamarca due to the use of Vassouras data to generate these difference curves as explained before. But the longitude separation between these two stations is small enough to yield the correct magnitude of the disturbed EEJ current fluctuations for this longitude sector as has been shown by Abdu et al. (2003).
In this figure we can see that the first, second, and third storms start around 1045 UT, 1400 UT and 1515 UT, respectively as marked by the vertical dashed lines. The second vertical dashed line marks the beginning of the recovery phase of the first storm. The main points of
the comparison between the AE and the ∆H variation can be noted as
follows: (a) an initial increase in ∆H that occurred around 1100 UT
ABDU et al., 1997; ABDU et al., 1998); (b) the subsequent depletion
observed in ∆H seams to be caused by a westward electric filed caused
by the disturbance dynamo (MAZAUDIER; VENKATESWARAN, 1990); and (c) during the other two events of AE intensification, starting near
1400 UT and 1500 UT, the ∆H responds with an opposite/ambiguous
phase relationship. This latter point and the related aspect of the 3-meter irregularity generation discussed above appear to be important questions to be recognized in the study of EEJ response to PP electric fields associated with AE activity. When the second storm (-600 nT) starts, its effect in the EEJ is not clear. It seems that an oscillation in the electric field begins and is amplified when the third storm (-400 nT) is triggered. Somehow, despite the second storm intensity being lower than the first, its disturbance effect is more pronounced than the first one, with respect to the amplitude variation during the disturbed period. The same happens with the third storm in comparison with the second one indicating that a superposition effect may be taking place.
On December 11 (left graph of figure 2) an AE intensification (of ~200 nT) had onset at 1200 UT (0900 LT) which coincided with a minor increase in the 3-meter echo at the start of the RTI map on this day. The event that had duration of ~4 hours was structured by series
of short-lived enhancements and decay phases. We identify the more noticeable ones around 1200, 1300, 1400 and 1430 UT which are
associated with corresponding structures in the H-component and the
3-meter echo power. The AE increases of relatively larger amplitudes
(1300 and 1400 UT) produce correspondingly larger amplitudes of H
increases and 3-meter irregularity power as compared the relatively weaker AE increases (1200 and 1430 UT) that produced much weaker effects in both. It may be noted further that the larger AE increases are also associated with significant broadening of the irregularity echo region. It may be verified further that the decreasing phase of the AE indices that followed each of these increases produced corresponding decrease
in the H-component and 3-meter echo power. This behavior suggests
that AE increases (decreases) in these cases were associated with prompt penetration disturbance electric fields (PP electric fields of eastward (westward) polarity that caused generation (decay) of 3-meter
irregularities and enhancement (decay) in H-component. With respect
to the complete disappearance of the EEJ echoes after midday, we need the measurements of thermospheric winds at the EEJ altitudes to confirm that the neutral atmosphere itself caused it. But the absence of perturbations in the horizontal component of the magnetic field gives Figure 3 Evolution of the sequence of storms (top panel) seen in the auroral index, which happened on December 13th, 1999 (blue line), related with
magnetometer data (bottom panel). And the auroral index and the magnetometer data for December 14th, 1999 (red line), which is a very quiet day.
Figura 3 ` Evolução da seqüência de tempestades (gráfico superior) vista no índice auroral, a qual ocorreu dia 13 de dezembro de 1999 (linha azul), relacionada com dados de magnetômetros (gráfico inferior). A linha vermelha mostra a variação do índice auroral e os dados de magnetômetros
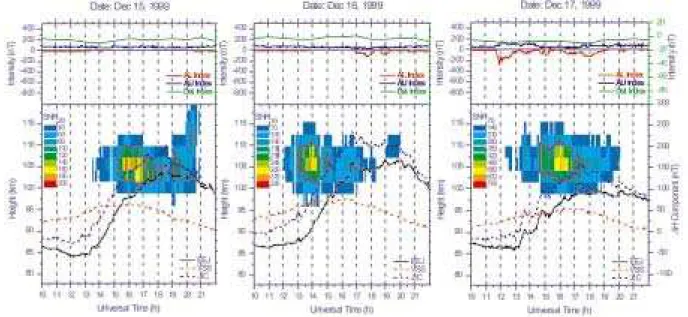
These RTI maps illustrate the day-to-day variability in the EEJ format and intensity. We observe that there is no repetition in the time when the maximum power scattering is observed. The event occurred after midday on December 15, before midday on December 16 and spread around midday on December 17. The main difference between the RTI patterns of the disturbed days and those of the quiet days is that in the latter case they are characterized by larger echo power with
December 15, and to a lesser degree on the 16. This aspect is being
investigated further. Although considered a quiet day in this work, the December 17 does present some minor AE disturbances whose effect on
3-meter irregularities and ∆H have largest amplitudes near midday in
agreement with such results discussed before.
Figure 5 shows three graph composed by five spectrograms each one from the disturbed period: December 11, 12 and 13, while figure 6
Figure 4 Range Time Intensity (RTI) maps from three quiet days: December 15th, 16th and 17th. The top panel of each graph shows the auroral indices (AU and
AL) and the ring current index (Dst). The bottom panel shows the RTI map superimposed by the horizontal component of the Earth magnetic field measured with magnetometer at Vassouras (red dashed curve) and Jicamarca (blue dashed curve). The black line also superimposed to the RTI map is the EEJ estimated effect.
Figura 4 ` Mapa de variação temporal de intensidade (RTI) dos três dias calmos: 15, 16 e 17 de dezembro. O gráfico superior de cada figura mostra a variação dos índices aurorais (AU e AL) e do índice da corrente anelar (Dst). Os gráficos inferiores mostram o mapa RTI sobreposto pela componente horizontal do campo magnético terrestre medido com magnetômetros em Vassouras (linha vermelha tracejada) e Jicamarca (linha azul tracejada). A linha preta, também sobreposta
shows other three similar graphs from the calm period: December 15, 16 and 17. Each daily spectrogram is the set of all one-minute averaged Doppler spectra calculated for the corresponding range gate as explained in the previous section. Each one cover 2.6-km height ranging from 98.7 to 111.7 km. The height indicated in the left bottom corner of
each graph corresponds to the center height of the range gate where the spectrogram was obtained.
In this set of graphs it is possible to identify three distinct regions. There is an upper region where almost only Farley-Buneman instabilities are observed and a lower region where there is great predominance of Gradient Drift instabilities. And also, there is like an intersection region
Figure 6 Set of spectrograms from three calm days: December 15th, 16th and 17th, corresponding to the RTI maps from Figure 4.
Figura 6 ` Conjunto de espectrogramas para os três dias calmos: 15, 16 e 17 de dezembro, correspondentes aos mapas RTI da Figura 4.
Figure 5 Set of spectrograms from three disturbed days: December 11th, 12th and 13th, corresponding to the RTI maps from Figure 2.
instability velocities after around 1500 UT. In fact, this apparent effect is not real. The rising in the EEJ irregularities seen in the RTI map is responsible for it. This rising observed in the EEJ in the Brazilian sector as well as the lowering in the instability velocities is discussed in the paper from Abdu and others (2002).
CONCLUSIONS
This work intends to demonstrate the diversity of phenomena in the EEJ and their variability in the Brazilian sector. Indeed, a quantitative work is in progress and some aspects discussed here can be better verified. However, the present work gives us a good indication of some important aspects of the EEJ during quiet and disturbed conditions from a 1-week campaign data.
During quiet conditions: (1) large degree of variability of the EEJ current strength and irregularity power are observed over São Luís even under quiet conditions during the period of this study; (2) there are marked day-to-day variations; and (3) there is poor correlation
between the ∆H and the EEJ backscattered power and the agreements
are believed to be due to the EEJ itself. The characteristics of the variability of the EEJ current strength would suggest the role of neutral winds over extended geographic area in the South American sector. The lack of data on the neutral winds does not however permit a confirmation of this possibility on a quantitative basis.
For disturbed conditions: (1) during periods of sub-storm like auroral electrojet intensification the transient changes in the EEJ are clearly correlated with the variations in the AE indices; (2) at noon (morning / evening) hours the modulations effect are more (less) pronounced due to the high (low) ionospheric conductivity; (3) isolated event preceded by quiet conditions seems to produce more clear responses; (4) when two or more events occur in sequence the effects in
(2) an upper region of predominance of Farley-Buneman irregularities; and (3) and intermediate region where both spectral signatures could be equally identified. We also observed differences in height of Gradient Drift scattering regions between quiet and disturbed conditions. During quiet days the lower (Gradient Drift) region was observed below about 100 km; the intermediate region (where both types of irregularities could be found) between 102 and 105 km, and the higher (Farley-Buneman) region was observed over about 110 km. During disturbed days echoes with the Gradient Drift irregularities signatures tended to be observed at higher altitudes, depending on the disturbance conditions. The lower region was observed below about 100 - 102 km. The intermediate region was observed about 102 - 108 km, and the higher region was observed over about 110 km.
REFERENCES
ABDU, M. A. et al. Equatorial disturbance dynamo electric field longitudinal structure and spread F: a case study from GUARA/EITS
campaigns. Geophysical Research Letters, Washington DC, v. 24, n. 13,
p. 1707-1710, 1997.
______ et al. DP 2 electric field fluctuations in the dusk-time dip
equatorial ionosphere. Geophysical Research Letters, Washington DC,
v. 25, n. 9, p. 1511-1514, 1998.
______ et al. Equatorial electrojet irregularities investigations of using a 50 MHz backscatter radar and a digisonde at São Luís: some initial
results. Journal of Atmospheric and Solar-Terrestrial Physics, Amsterdam,
v. 64, n. 12-14, p. 1425-1434, 2002.
______ et al. Equatorial electrojet 3-m irregularity dynamics during magnetic disturbances over Brazil: results from the new VHF radar at
São Luís. Journal of Atmospheric and Solar-Terrestrial Physics,
BALSLEY, B. B. Evidence of the nighttime current reversal in the equatorial
electrojet. Annales de Geophysical, Toulouse, v. 22, p. 406-470, 1966.
fasc. 3
COHEN, R.; BOWLES, K. L.; CALVERT, W. On the nature of equatorial
slant sporadic E. Journal of Geophysical Research, Washington, DC, v.
67, n. A3, p. 965-972, 1962.
FEJER, B. G. Natural ionospheric plasma waves. In: KOHL, H.; RÜSTER,
R.; SCHLEGER, K. (Ed.). Modern ionospheric science, MaxPlank Institute
for Aeronomy, Katlenburg-Lindau: Germany. Cap. 8, p. 216-273.1996
______; KELLEY, M. C. Ionospheric irregularities. Reviews of Geophysics
and Space Physics, Washington, DC, v. 18, n. 2, p. 401-454, 1980.
FORBES, J. M. The equatorial electrojet. Reviews of Geophysics and Space
Physics, Washington, DC, v. 19, n. 3, p. 469-504, 1981.
GONZALES, S. A. et al. Equatorial electric fields during magnetically disturbed conditions 2. Implications of simultaneous auroral and
equatorial measurements. Journal of Geophysics Research, Washington,
DC, v. 84, n. A10, p. 5803-5812, 1979
KUDEKI, E. et al. The condor equatorial electrojet campaign: radar results.
Journal of Geophysical Research, Washington, DC, v. 92, n. A12, p.
13561-13577, 1987.
MAZAUDIER, C.; VENKATESWARAN, S. V. Delayed ionospheric effects of the geomagnetic storm of march 22, 1979 studied by the sixth
coordinated data analysis workshop (CDAW-6). Annales Geophysicae,
Toulouse, v. 8, p. 511-518, 1990.
MATSUSHITA, S. Intense Es ionization near the magnetic equator. Journal
of Geomagnetism and Geoelectricity, Washington, DC, v. 3, p. 44, 1951.
PFAFF, R. F. et al. Electric field and plasma density measurements in the
strongly driven daytime equatorial electroje: 1. The unstable layer and
the gradient drift waves. Journal of Geophysical Research, Washington
DC, v. 92, n. A12, p. 13578-13596, 1987.
REDDY, C. A. The equatorial electrojet: a review of the ionospheric and
geomagnetic aspects. Journal of Atmospheric and Terrestrial Physics,
Amsterdam, v. 43, n. 5/6, p. 557-571, 1981.
______. The equatorial electrojet. Pure and Applied Geophysics, Berlin,
v. 131, n. 3, p. 486-508, 1989.
SASTRI, J. H.; RAO, J. V. S. V.; RAMESH, K. B. Penetration of polar electric field to the nightside dip equator at times of geomagnetic sudden
commencements. Journal of Geophysics Research, Washington DC, v.