Article
Printed in Brazil - ©2018 Sociedade Brasileira de Química*e-mail: nilson.assuncao@gmail.com #These authors contributed equally to this work.
Morpho/Proteomic Comparative between High Grade Pleomorphic Sarcoma and
Metastasis Diagnosed in an Old Captive Common Hippo
Adriana R. Silva,a,# José T. J. G. de Lacerda,b,# Bernadete Faria,b Isabela W. da Cunha,c
Vitor P. de Andradec and Nilson A. Assunção*,a,b
aInstituto de Ciências Ambientais, Químicas e Farmacêuticas, Universidade Federal de São Paulo,
04039-032 Diadema-SP, Brazil
bEscola Paulista de Medicina, Universidade Federal de São Paulo, 04023-062 São Paulo-SP, Brazil
cDepartamento de Patologia, A.C. Camargo Cancer Center, 01509-010 São Paulo-SP, Brazil
Old age is a risk factor for cancer development in humans and animals, and studies have shown that tumors in animals are acceptable models for studying human cancers, considering the similarities between their factors. This work was conducted in a 53-year-old captive female common hippo (Hippopotamus amphibious) with a left leg tumor and metastatic mass. Histopathological and immunohistochemical analyses were carried out with a final diagnosis of a high grade pleomorphic sarcoma. A proteomic study using mass spectrometry was added in order to identify further aspects of the primary tumor and metastasis which could improve our understanding, and each tissue showed a proteomic profile indicative of its pathologic state with significant differences between healthy tissue, primary and metastatic tumors. Low levels of β-actin in primary tumors were identified, and this may be associated with a possible consequence of cytoskeleton dynamic modification. In metastatic tissue, these dynamics may be affected by the presence of HSP chaperone 60.
Keywords:Hippopotamus amphibious, high grade pleomorphic sarcoma, cytoskeleton,
β-actin, mass spectrometry
Introduction
Oncogenic phenomena in animals include a wide variety of benign and malignant tumors that develop during the life of the animal and have several health consequences.1
Species with large bodies tend to have a lower cancer rate, which seems to indicate the presence of complex tumor detection systems (Peto’s paradox).2 To illustrate this
paradox, in contrast with humans, who have only two copies of the TP53 tumor suppressor gene, elephants, the largest of the land mammmals, have 20 copies of the TP53 gene. This allows for extra efficiency in their systems, enabling the correction of DNA damage or inducing apoptosis in mutated cells. As a result, only 3% of elephants develop cancer.3,4
Despite some comparative cancer and lifespan analyses between wild and zoo animals showing that captive animals
were susceptible to cancer and decreased longevity.5,6
Tidière et al.7 revealed that mammals from zoo populations
generally lived longer than their wild counterparts (84% of species). Of particular interest, the common hippopotamus (Hippopotamus amphibius), a robust mammal with an estimated 40-year lifespan in nature and with slow pace of life, has increased longevity in captivity.7-9 The relationship
between life expectancy and environment may be associated with the low caloric diet and reduced metabolism present in captive animals, which slows ageing and the appearance of cancer cases. This is also true for humans.10,11
Paradoxically, the exceptional longevity these captive animals exhibit can be associated with cancer due to several factors such as telomere shortening, increased cellular senescence, accumulation mutation of DNA in stem and progenitor cells required for active replenishment during the lifespan of the organism, mutations in tumor suppressor genes and metabolic changes.12-14
molecular processes and identification of biomarkers.15,16
Thus, the objective of this study was to differentiate the proteomes of healthy skeletal muscle, high grade pleomorphic sarcoma and heart metastasis diagnosed in a common hippo, located at a zoo, with high longevity, and to identify possible biomarkers responsible for the development and progression of these conditions.
Experimental
Animal aspects and samples collection
The animal under examination was a female common
hippo (Hippopotamus amphibious) aged 53 years
presenting with prolonged anorexia and weight loss. Clinical and radiological examinations of the posterior and upper limbs revealed severe bone disease and osteoarthritis of both metacarpophalangeal joints. During autopsy, a 27 cm pink to gray main tumor mass attached to the left tibial crest near the cranial epiphysis was detected. There were also several white to gray nodules in the lungs (2 to 5 cm), heart (0.5 to 1.0 cm), mesenteric lymph nodes (1.5 cm) and liver (12 cm). Tissue samples were collected from a primary tumor present in the paw, healthy skeletal muscle around the tumor, and metastatic tissue from heart. All the samples remained at −80 °C until the time of the test.
Histopathological and immunohistochemical analysis
Samples were fixed in 10% neutral buffered formalin, embedded in paraffin, sectioned at 4 µm, and stained with hematoxylin and eosin (H&E). Immunohistochemistry was also performed on tumor sections according to a previously described protocol.17 Based on histological findings, primary
antibodies were used to detect antigens from mesenchymal tissues with Vimentin (V9), muscle with Desmin (D33) and
α-SMA (1A4), histiocytes with CD 34 (QBEnd 10), CD45
(2B11-PD7/26) (DakoCytomation, Glostrup, Denmark) and Lysozyme (polyclonal), neuroendocrine tissues with S100 (polyclonal) and epithelial tissues with cytokeratin cocktail (AE1AE3), and EMA (E29). All antibodies used were from DakoCytomation, Denmark. Normal tissues from the hippopotamus were used as negative and positive controls for the reactions.
Sample preparation for proteomic analysis
Samples (500 mg) were ground in liquid nitrogen, homogenized and solubilized in 500 µL of lysis buffer
(25 mmol L−1 Tris base pH 8.5, 1% Triton X, 4% CHAPS,
1 mmol L−1 phenylmethylsulfonyl fluoride) with 750 µL
of protease inhibitor (Roche, Basel, Switzerland). The homogenate was centrifuged at 5000 rpm at 4 °C for 10 min with 125 µL of trichloroacetic acid containing 80 mmol L−1
dithiothreitol (DTT). The supernatant was discarded, and the precipitate was washed with 500 µL of ice-cold acetone containing 20 mmol L−1 DTT and centrifuged at 13,000 rpm
at 4 °C for 10 min; the washing and centrifugation steps were repeated 3 times. The supernatant was discarded and the precipitate was dried by evaporation and resuspended in extraction buffer (40 mmol L−1 Tris base pH 8.5 containing
7 mol L−1 urea, 2 mol L−1 thiourea, 4% CHAPS and
65 mmol L−1 DTT), and solubilized at 300 rpm overnight
at 4 °C. The sample was centrifuged at 13,000 rpm at 4 °C for 10 min, and detergent was removed from the supernatant with Pierce Detergent Removal Spin Columns (Thermo Fisher Scientific Inc., USA) according to the manufacturer’s recommendations. Total protein was determined using the Bradford method.18
Proteins were reduced with 5 mmol L−1 DTT for 30 min
at 56 °C, then alkylated with 14 mmol L−1 iodoacetamide
for 30 min in the dark. Proteins were further reduced with 5 mmol L−1 DTT for 30 min at 56 °C, with the addition of
50 mmol L−1 NH
4HCO3 plus CaCl2 1 mmol L−1 (100 µL) for
pH adjustment and reduction of self-enzymatic proteolysis. The chemicals used were purchased from Sigma-Aldrich, USA. The samples were subjected to enzymatic digestion overnight at 37 °C with trypsin 1:50 (m/m) (sequencing-grade modified trypsin, Promega, USA), and the reaction was quenched with the addition of 0.1% trifluoroacetic acid (TFA).
Nano high performance liquid chromatography tandem mass spectrometry (HPLC-MS/MS) analysis
The solutions containing the eluted peptides were concentrated in a SpeedVac at 20 °C and resuspended in 2% acetonitrile + 0.1% formic acid. Concentrates were injected into ultra-high performance liquid chromatography systems (UHPLC) Nano-Advance (Bruker Daltonics, Germany) in a reverse phase C18 column 150 × 0.1 mm at a flow of
0.1 mL min−1 and injection volume of 5 µL. Formic acid
gradients consisted of 0.1% formic acid in water (solvent A) and 0.1% formic acid in acetonitrile 95% (solvent B), with an initial concentration of 2% solvent B and a gradual increase to 10-90% solvent B over 120 min. The MS data was acquired with a micrOTOF QII mass spectrometer (Bruker Daltonics, Germany). The acquisitions were made in the range of m/z 200-1500, with the following parameters: quadrupole ion energy 6.0 eV; collision energy 12 eV s−1;
rate was 5.0 kHz frequency 2 GHz with flight tube 8600 V, reflector 1700 V, 1700 V detector source, TOF 2140 V detector and collision energy 8 keV. The MS/MS spectra were obtained by collision-induced dissociation (CID).
Bioinformatics analysis
The MS/MS spectra were analyzed using Peaks Studio 7.0 software (Bioinformatics Solutions, Waterloo, Canada) for de novo analysis and multi-round database search.19
Based on the low number of proteins available in the
hippopotamus database, the de novo sequenced peptides
with average local confidence (ALC) scores ≥ 50% were
selected for database searches against Mammalian databases from UniProt20 in the first round and NCBI21 in the second
round. The MS/MS spectra were carried out with precursor mass tolerance of 10 ppm, fragment mass tolerance of 0.5 Da, trypsin as specific-enzyme, with up to 02 missed cleavages and 01 non-specific, carbamidomethylation on cysteine (+57.02) as fixed modification, oxidation on methionine (+15.99 Da) as the variable modification and false discovered rate (FDR) < 5%.
Peptides with length of amino acids ≥ 6 and ALC ≥ 65% obtained by de novo analysis not matching any sequence in the database searches were submitted to homology search in BLAST analysis22 using the sequence presets against the
UniprotKB (Mammalian) database and hits E-values < 2 was used as the limit parameter.
PANTHER analysis was used to classify protein function23 in healthy, tumor and metastasis tissues based
on Gene Ontology (GO) terms. The percentage values were therefore normalized to a total value of 100%.
Results and Discussion
High grade pleomorphic sarcoma diagnosed by the morpho-immunological aspects
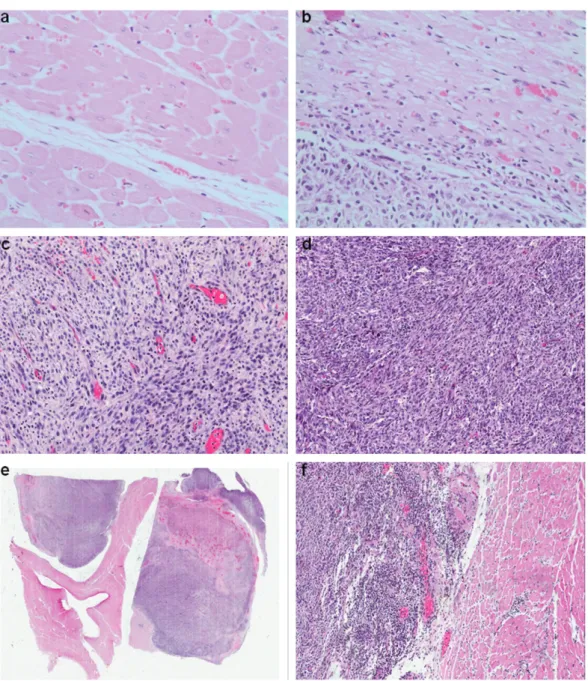
The tumor was composed of plump spindle cells forming fascicular and storiform patterns, with admixed bizarre pleomorphic and multinucleated giant cells on a background of mononuclear inflammatory cells. There were an average of three mitotic figures per 10 high power fields and bizarre mitoses were common. The cystic, gritty areas seen grossly proved to be foci of myxoid degeneration, necrosis and mineralization. The tumor was high positive for vimentin, had patchy SMA staining and was negative for all other markers, consistent with a high grade pleomorphic sarcoma, not otherwise specified (Figure 1).
Many of these tumors showed focal immunoreactivity for smooth muscle actin, but stains for desmin and h-caldesmon
are typically negative.24 The high grade undifferentiated
pleomorphic sarcoma (UPS) manifests in a broad range of histologic appearances, although the most common form consists of a mixture of storiform and pleomorphic areas, and it is diagnosed when no identifiable specific line of differentiation exists, excluding dedifferentiated types of pleomorphic sarcomas (diagnosis of exclusion). Overall, the morphologic and immunohistochemical results described are consistent with a conclusive diagnosis of this tumor type.25
Protein profiling describes differences in pathological status between tissues
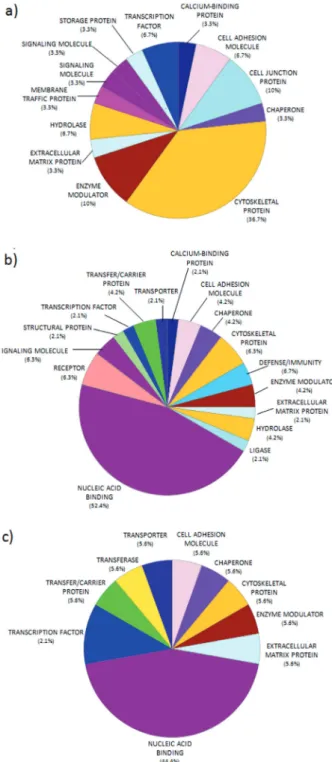
Currently, little information about the proteome of common hippos exists, but MS/MS analysis enables the observation of the proteomic changes in the different tissues, which can be compared to differentiate the physiopathological status among them. Of the proteins identified, 25 were found in healthy skeletal muscle, 27 in primary tumors, and 15 in metastatic tumors (Supplementary Information); uncommon characteristics were shown between normal and tumor tissues based on protein class annotated in GO terms. These differences were observed mainly by the number of proteins associated to the cytoskeleton, in healthy tissue (36.7%), which decreased in the pathological tissues. Meanwhile, proteins identified in primary and metastasis tumors revealed enrichment for nucleic acid binding, which is absent in normal tissue (Figure 2).
The nucleic acid binding PANTHER protein class includes RNA and DNA binding proteins, helicases and nucleases. The abundance of these proteins differentially encoded in malignant samples may suggest altered
transcriptional activity in tumor samples.26 Evidence
suggests that activated nucleic acid binding proteins might play a vital role in cell growth, abnormal cell proliferation, and metastasis, and may form a network center during carcinogenesis.27
Thus, when comparing diseased and control tissues, it is relevant to consider the amount associated with the GO category as well as the number and function of the proteins. The normal muscle sample was characterized by structural proteins related to contractile muscle function, the formation of microtubules, and the composition/maintenance of the cytoskeleton, with effects on cell division. These proteins included actin, myosin, tropomyosin, titin, filamin, dynein, receiver skeletal protein tyrosine kinase, protein kinase PAK 3, microtubule-associated protein ASPM (abnormal spindle microtubule) and various isoforms.28-31 The presence
The primary tumor had proteins in common with healthy tissue, but with a peculiar proteome. Proteins associated with DNA damage were detected along with a possible mutation in a protein commonly found in healthy tissue, which may elucidate the cellular mechanism of the protein. Excess soluble histone proteins is an indicative of damage to the nucleosome, which impacts DNA replication and may negatively affect the repair of the DNA molecule.32,33
An increase in protein synthesis by the methionyl-tRNA synthetase enzyme is also related to oncogenesis,34 as is
an increase in the transcription factor that binds the EFL 1 promoter, responsible for increasing transcription in tumors and during angiogenesis.35,36
Some proteins that act to restore homeostasis were also
detected, including the DNA repair protein PMS237 and
CTCF tumor suppressor,38 as well as proteins involved in
stress response, including the small chaperone crystalline
alpha39 and the chaperone HSP 60.40 The presence of
vimentin was detected; this protein was associated with the cytoskeleton in tumor cells and is responsible for increasing adhesion and metastasis, but it is poorly expressed during myogenesis in normal cells.41,42 The different intracellular
dynamics and tissue organization in tumors could also be observed in changes in the levels of TMPRSS matriptase, which increases collagen degradation and the effects of iron exposure.43,44
of tumors which do not require anchoring.46 The initiator of
transcription factor 2 alpha (GCN2) is a protein expressed in the absence of nutrients. It is related to various pathways of tumor progression and angiogenesis47,48 and increases
fibroblast growth factor.49
The efrin A2 receptor is associated with oncogenesis and with the progression of metastatic growth factors, such as fibroblast growth factor.50 Proteins involved in
cell proliferation were also found, including GSG2, a kinase responsible for mitotic histone production51 and
guanine nucleotide exchange factor RASGRF1, which is responsible for cell proliferation and migration related to metastatic in tumorogenesis.52 However, this tissue also
showed the presence of tumor suppressor CHD1.53
Decreased level β-actin in primary tumor in response to possible cytoskeleton dynamic modification
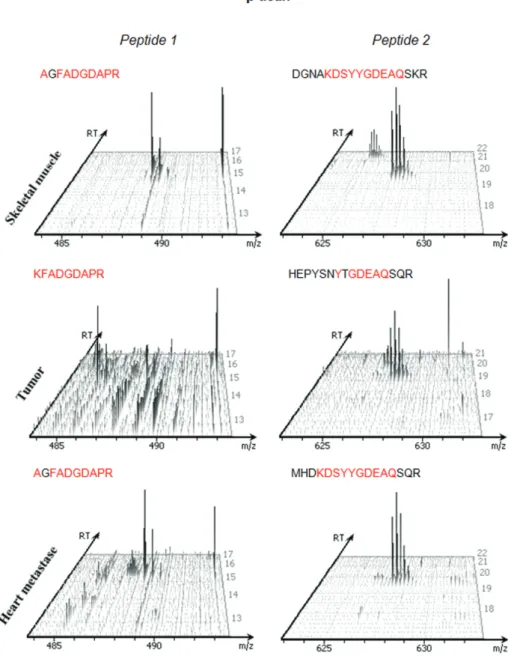
De novo sequenced peptides used to identify proteins had MS/MS spectra manually verified. Based in the retention time (RT), m/z ratio of precursor ion, and sequence coverage, we identified peptides of β-actin protein that were present in all tissues. Based on the extension to the spectral counting technique by the average of the total ion current (TIC) of MS/MS spectra this peptides, it was estimated their relative abundance of the protein, similarly to a label-free quantification.54
Despite similarities among malignant samples, the β-actin present in primary tumors showed minor abundance compared with the other tissues, but there was no significant difference between healthy and metastatic tissues. Some differences in sequence coverage may be considered tolerable error-fragmentation, i.e., AG → K55 (Figure 3).
Based on both literature reports and the proteomic profile of the primary tumor generated, we suggest that the reduction of β-actin (actin cytoplasmic 1) is the result of the progressive increase of the cytoskeleton through a dynamic process involving changes in its dynamics, and for the presence of protein connections that bind to this structure with subsequent alteration of gene expression in the tumor. The presence of vimentin and crystalline alpha proteins increases stability of the cytoskeleton by reducing depolymerization.56,57
The results of decreased depolymerization is an increase of the cytoskeleton with membrane protrusion, tumor progression and metastasis, as well as a change of polarization during mitosis leading to cellular pleomorphism.58,59 The presence of HSP 60 in the primary
tumor indicates the refurbishment of misfolding proteins and affects the stability of the cytoskeleton, thus enhancing the progression of carcinogenesis.60
Figure 2. Pie diagram of the distribution of protein functions in the (a) healthy skeletal muscle, (b) primary tumor, and (c) metastatic tumor, according to their molecular functions as determined using PANTHER.
The metastatic tumor proteome had a profile that differed from the other tissues, suggesting that this type of tumor has a specialized molecular mechanism. The genetic constitution of the primary tumor and its
metastasizing cells may be quite different.45 Stromal
β-Actin is present only in non-muscle cells, and it has the capability to alternate from a globular (G-actin) to polymeric (F-actin). The G-actin isoform is converted into F-actin by nucleation and subsequently polymerizes and depolymerizes through a recycling process (treadmilling).61-63 Decreased levels of β-actin can be a
consequence of cytoskeletal organization changes causing reduction of organization during cell division and increased protrusions, cell motility and chromatin remodeling.64,65
Significant levels of β-actin in metastatic tissue suggest a heterogeneous mechanism for formation of the primary
tumor. Based on the metastatic tissue proteome, HSP 60 may be associated with senescent cells output fibroblast, i.e., fibroblasts reached by a state in which cell division is limited and cannot be induced.66 Thus, active fibroblasts
were stimulated by growth factors detected and responsible for distinctive features within the tissue with collagen presence. This explains the levels of β-actin, which is not typically modified in the fibroblasts.65 Therefore, this
protein measurement may be indicative of the activation of response mechanisms on the development and progression of carcinogenesis.
Conclusions
We performed an in depth proteomic analysis of a high grade pleomorphic sarcoma of a common hippo and offered new opportunities of research based on the hypothesis that pleomorphic sarcoma tumor samples may be differentiated by an increase in nucleic acid binding protein class and for the low levels of β-actin and key cytoskeleton proteins as possible candidates for cell organization and dynamics in carcinogenesis. We also recognize that high-grade pleomorphic sarcomas are complex neoplasia and that the proteomic findings seen in this case require further characterization in other animals and in human tumor samples.
Supplementary Information
Supplementary data are available free of charge at http://jbcs.sbq.org.br as PDF file.
Acknowledgments
The authors thank to FAPESP (São Paulo Research Foundation) by grant (2012/02514-9) as well as CAPES (Coordination for the Improvement of Higher Education Personnel) and FINEP (Brazilian Innovation Agency) for financial support. The authors specially thank the São Paulo Zoological Park Foundation (SPZPF) for all support.
References
1. Aktipis, C. A.; Boddy, A. M.; Jansen, G.; Hibner, U.; Hochberg, M. E.; Maley, C. C.; Wilkinson, G. S.; Philos. Trans. R. Soc., B 2015, 370, ID 20140219.
2. Brown, J. S.; Cunningham, J. J.; Gatenby, R. A.; Philos. Trans. R. Soc., B 2015, 370, ID 20140221.
3. Abegglen, L. M.; Caulin, A. F.; Chan, A.; Lee, K.; Robinson, R.; Campbell, M. S.; Kiso, W. K.; Schmitt, D. L.; Waddell, P. J.; Bhaskara, S.; Jensen, S. T.; Maley, C. C.; Schiffman, J. D.; JAMA, J. Am. Med. Assoc. 2015, 314, 1850.
4. Greaves, M.; Ermini, L.; JAMA, J. Am. Med. Assoc. 2015, 314, 1806.
5. Wiese, R.; Willis, K.; Zoo Biol. 2004, 23, 365.
6. Vittecoq, M.; Roche, B.; Daoust, S. P.; Ducasse, H.; Missé, D.; Abadie, J.; Labrut, S.; Renaud, F.; Gauthier-Clerc, M.; Thomas F.; Trends Ecol. Evol. 2013, 28, 628.
7. Tidière, M.; Gaillard, J.-M.; Berger, V.; Müller, D. W. H.; Lackey, L. B.; Giménez, O.; Gimenez, O.; Clauss, M.; Lemaître, J.-F.; Sci. Rep. 2016, 6, 36361.
8. Coughlin, B. L.; Fish, F. E.; J. Mammal. 2009, 90, 675. 9. Walzer, C.; Petit, T.; Stalder, G. L.; Horowitz, I.; Saragusty, J.;
Hermes, R.; Theriogenology 2014, 81, 514.
10. Colman, R. J.; Beasley, T. M.; Kemnitz, J. W.; Johnson, S. C.; Weindruch, R.; Anderson, R. M.; Nat. Commun. 2014, 3557, 5. 11. Gorbunova, V.; Seluanov, A.; Zhang, Z.; Gladyshev, V. N.; Vijg,
J.; Nat. Rev. Genet. 2014, 15, 531.
12. Falandry, C.; Bonnefoy, M.; Freyer, G.; Gilson, E.; J. Clin. Oncol. 2014, 32, 2604.
13. Behrens, A.; van Deursen, J. M.; Rudolph, K. L.; Schumacher, B.; Nat. Cell Biol. 2014, 16, 201.
14. Adams, P. D.; Jasper, H.; Rudolph, K. L.; Cell Stem Cell 2015, 16, 601.
15. Schmidt, A.; Forne, I.; Imhof, A.; BMC Syst. Biol. 2014, 8, S2. 16. Boja, E. S.; Rodriguez, H.; Clin. Proteomics 2014, 11, 22. 17. da Cunha, I. W.; de Brot, L.; Carvalho, K. C.; Rocha, R. M.;
Fregnani, J. H.; Falzoni, R.; Ferreira, F. O.; Aguiar, S.; Lopes, A.; Muto, N. H.; Reis, L. F.; Soares, F. A.; Vassallo, J.; Ann. Surg. Oncol. 2012, 19, 1790.
18. Bradford, M. M. A.; Anal. Biochem. 1976, 72, 248.
19. Zhang, J.; Xin, L.; Shan, B.; Chen, W.; Xie, M.; Yuen, D.; Zhang, W.; Zhang, Z.; Lajoie, G. A.; Ma, B.; Mol. Cell. Proteomics 2012, 11, M111.010587.
20. http://www.uniprot.org/uniprot/?query=mammalian&sort= score, accessed in August 2017.
21. https://www.ncbi.nlm.nih.gov/protein/?term=mammalian, accessed in August 2017.
22. http://blast.ncbi.nlm.nih.gov/Blast.cgi, accessed in August 2017. 23. Mi, H.; Muruganujan, A.; Casagrande, J. T.; Thomas, P. D.;
Nat. Protoc. 2013, 8, 1551.
24. Agaimy, A.; Gaumann, A.; Schroeder, J.; Dietmaier, W.; Hartmann, A.; Hofstaedter, F.; Wunsch, P. H.; Mentzel, T.; Virchows Arch. 2007, 451, 949.
25. Goldblum, J. R.; Mod. Pathol. 2014, 27, S39.
26. Myers, J. S.; von Lersner, A. K.; Robbins, C. J.; Sang, Q.-X. A.; PLoS One 2015, 10, e0145322.
27. Dai, P.; Wang, Q.; Wang, W.; Jing, R.; Wang, W.; Wang, F.; Azadzoi, K. M.; Yang, J.-H.; Yan, Z.; Int. J. Mol. Sci. 2016, 17, 69. 28. Xu, X. L.; Ma, W.; Zhu, Y. B.; Wang, C.; Wang, B. Y.; An,
N.; An, L.; Liu, Y.; Wu, Z. H.; Tian, J. H.; PLoS One 2012, 7, e49303.
29. Parker, N. H.; Donninger, H.; Birrer, M. J.; Leaner, V. D.; PLoS One 2013, 8, e66892.
30. Folker, E. S.; Schulman, V. K.; Baylies, M. K.; Development 2014, 141, 355.
31. Costa, M. L.; ISRN Dev. Biol. 2014, 2014, 1.
32. Chandrasekharan, M. B.; Huang, F.; Sun, Z.-W.; Proc. Natl. Acad. Sci. U. S. A. 2009, 106, 16686.
33. Liang, D.; Burkhart, S. L.; Singh, R. K.; Kabbaj, M.-H. M.; Gunjan, A.; Nucleic Acids Res. 2012, 40, 9604.
34. Kim, S.; You, S.; Hwang, D.; Nat. Rev. Cancer 2011, 11, 708. 35. Andrews, P. G. P.; Kennedy, M. W.; Popadiuk, C. M.; Kao, K.
36. Randi, A. M.; Sperone, A.; Dryden, N. H.; Birdsey, G. M.; Biochem. Soc. Trans. 2009, 37, 1248.
37. Erie, D. A.; Weninger, K. R.; DNA Repair 2014, 20, 71. 38. Marshall, A. D.; Bailey, C. G.; Rasko, J. E. J.; Curr. Opin. Genet.
Dev. 2014, 24, 8.
39. Haslbeck, M.; Vierling, E.; J. Mol. Biol. 2015, 427, 1537. 40. Saibil, H.; Nat. Rev. Cancer 2013, 14, 630.
41. Satelli, A.; Li, S.; Cell. Mol. Life Sci. 2011, 68, 3033. 42. Guo, M.; Ehrlicher, A. J.; Mahammad, S.; Fabich, H.; Jensen,
M. H.; Moore, J. R.; Fredberg, J. J.; Goldman, R. D.; Weitz, D. A.; Biophys. J. 2013, 105, 1562.
43. Velasco, G.; Cal, S.; Quesada, V.; Sánchez, L. M.; López-Otín, C.; J. Biol. Chem. 2002, 277, 37637.
44. Zhao, N.; Nizzi, C. P.; Anderson, S. A.; Wang, J.; Ueno, A.; Tsukamoto, H.; Eisenstein, R. S.; Enns, C. A.; Zhang, A.; J. Biol. Chem. 2015, 490, 4432.
45. Gerlinger, M.; Rowan, A. J.; Horswell, S.; Larkin, J.; Endesfelder, D.; Gronroos, E.; Martinez, P.; Matthews, N.; Stewart, A.; Tarpey, P.; Varela, I.; Phillimore, B.; Begum, S.; Mc Donald, N. Q.; Butler, A.; Jones, D.; Raine, K.; Latimer, C.; Santos, C. R.; Nohadani, M.; Eklund, A. C.; Spencer-Dene, B.; Clark, G.; Pickering, L.; Stamp, G.; Gore, M.; Szallasi, Z.; Downward, J.; Futreal, A.; Swanton, C.; N. Engl. J. Med. 2012, 366, 883.
46. Li, T.; Lu, H.; Shen, C.; Lahiri, S. K.; Wason, M. S.; Mukherjee, D.; Yu, L.; Zhao, J.; Oncogene 2014, 33, 4746.
47. Wang, Y.; Ning, Y.; Alam, G. N.; Jankowski, B. M.; Dong, Z.; Nör, J. E.; Polverine, P. J.; Neoplasia 2013, 15, 989.
48. Castilho, B. A.; Shanmugam, R.; Silva, R. C.; Ramesh, R.; Himme, B. M.; Sattlegger, E.; Biochim. Biophys. Acta 2014, 1843, 1948.
49. Wilson, G. J.; Lennox, B. A.; She, P.; Mirek, E. T.; Al Baghdadi, R. J.; Fusakio, M. E.; Dixon, J. L.; Henderson, G. C.; Wek, R. C.; Anthony, T. G.; Am. J. Physiol.: Endocrinol. Metab. 2015, 308, E283.
50. Gucciardo, E.; Sugiyama, N.; Lehti, K.; Cell. Mol. Life Sci. 2014, 71, 3685.
51. Huertas, D.; Soler, M.; Moreto, J.; Villanueva, A.; Martinez, A.; Vidal, A.; Charlton, M.; Moffat, D.; Patel, S.; McDermott, J.; Owen, J.; Brotherton, D.; Krige, D.; Cuthill, S.; Esteller, M.; Oncogene 2012, 31, 1408.
52. Ksionda, O.; Limnander, A.; Roose, J. P.; Front. Biol. (Beijing, China) 2013, 8, 508.
53. Rodrigues, L. U.; Rider, L.; Nieto, C.; Romero, L.; Karimpour-Fard, A.; Loda, M.; Lucia, S.; Min, W.; Lihong, S.; Cimic, A.; Sirintrapun, J. S.; Nolley, R.; Pac, C.; Chen, H.; Peehl, D. M.; Xu, J.; Liu, W.; Costello, J. C.; Cramer, S. D.; Cancer Res. 2015, 75, 1021.
54. Asara, J. M.; Christofk, H. R.; Freimark, L. M.; Cantley, L. C.; Proteomics 2008, 8, 994.
55. Cantu, M. D.; Carrilho, E.; Wulff, N. A.; Palma, M. S.; Quim. Nova 2008, 31, 669.
56. Hookway, C.; Ding, L.; Davidson, M. W.; Rappoport, J. Z.; Danuser, G.; Gelfand, V.; Mol. Biol. Cell 2015, 26, 1675. 57. Fan, Q.; Huang, L. Z.; Zhu, X. J.; Zhang, K. K.; Ye, H. F.; Luo,
Y.; Sun, X. H.; Zhou, P.; Lu, Y.; Mol. Vision 2014, 20, 117. 58. Stevenson, R. P.; Veltman, D.; Machesky, L. M.; J. Cell Sci.
2012, 125, 1073.
59. Bezanilla, M.; Gladfelter, A. S.; Kovar, D. R.; Lee, W. L.; J. Cell Biol. 2015, 209, 329.
60. Quintá, H. R.; Galigniana, N. M.; Erlejman, A. G.; Lagadari, M.; Piwien-Pilipuk, G.; Galigniana, M. D.; Cell. Signaling 2011, 23, 1907.
61. Spencer, V. A.; Costes, S.; Inman, J. L.; Xu, R.; Chen, J.; Hendzel, M. J.; Bissell, M. J.; J. Cell Sci. 2011, 124, 123. 62. Weston, L.; Coutts, A. S.; La Thangue, N. B.; J. Cell Sci. 2012,
125, 1.
63. Xu, J.-W.; Cheng, B.; Feng, Y.-Y.; Wang, Z.-Q.; Wang, G.-D.; Commun. Theor. Phys. 2015, 63, 648.
64. Bergeron, S. E.; Zhu, M.; Thiem, S. M.; Friderici, K. H.; Rubenstein, P. A.; J. Biol. Chem. 2010, 285, 16087.
65. Bunnell, T. M.; Burbach, B. J.; Shimizu, Y.; Ervasti, J. M.; Mol. Biol. Cell 2011, 22, 4047.
66. Di Felice, V.; Ardizzone, N.; Marcianò, V.; Bartolotta, T.; Cappello, F.; Farina, F.; Zummo, G.; Anat. Rec., Part A 2005, 284, 446.
Submitted: June 3, 2017
Published online: August 17, 2017