New Insight into Benign Tumours of Major Salivary
Glands by Proteomic Approach
Elena Donadio1., Laura Giusti1., Veronica Seccia2, Federica Ciregia1, Ylenia da Valle1, Iacopo Dallan2, Tiziana Ventroni1, Gino Giannaccini1, Stefano Sellari-Franceschini2, Antonio Lucacchini1*
1Department of Pharmacy, University of Pisa, Pisa, Italy,21st Ear Nose Throat Unit, Azienda Ospedaliero Universitaria Pisana, Pisa, Italy
Abstract
Major salivary gland tumours are uncommon neoplasms of the head and neck. The increase of precise pre-operative diagnosis is crucial for their correct management and the identification of molecular markers would surely improve the required accuracy. In this study we performed a comparative proteomic analysis of fine needle aspiration fluids of the most frequent benign neoplasms of major salivary glands, namely pleomorphic adenoma and Warthin’s tumour, in order to draw their proteomic profiles and to point out their significant features. Thirty-five patients submitted to parotidectomy were included in the study, 22 were identified to have pleomorphic adenoma and 14 Warthin’s tumour. Fine needle aspiration samples were processed using a two-dimensional electrophoresis/mass spectrometry-based approach. A total of 26 differentially expressed proteins were identified. Ingenuity software was used to search the biological processes to which these proteins belong and to construct potential networks. Intriguingly, all Warthin’s tumour up-regulated proteins such as Ig gamma-1 chain C region, Ig kappa chain C region and Ig alpha-1 chain C region and S100A9 were correlated to immunological and inflammatory diseases, while pleomorphic adenomas such as annexin A1, annexin A4, macrophage-capping protein, apolipoprotein E and alpha crystalline B chain were associated with cell death, apoptosis and tumorigenesis, showing different features of two benign tumours. Overall, our results shed new light on the potential usefulness of a proteomic approach to study parotid tumours and in particular up regulated proteins are able to discriminate two types of benign parotid lesions.
Citation:Donadio E, Giusti L, Seccia V, Ciregia F, da Valle Y, et al. (2013) New Insight into Benign Tumours of Major Salivary Glands by Proteomic Approach. PLoS ONE 8(8): e71874. doi:10.1371/journal.pone.0071874
Editor:Rossella Rota, Ospedale Pediatrico Bambino Gesu’, Italy
ReceivedApril 18, 2013;AcceptedJuly 11, 2013;PublishedAugust 26, 2013
Copyright:ß2013 Donadio et al. This is an open-access article distributed under the terms of the Creative Commons Attribution License, which permits unrestricted use, distribution, and reproduction in any medium, provided the original author and source are credited.
Funding:The authors have no support or funding to report.
Competing Interests:The authors have declared that no competing interests exist. * E-mail: [email protected]
.These authors contributed equally to this work.
Introduction
Major salivary gland tumours (MSGT) are uncommon neoplasms of the head and neck corresponding to about 8% of the cancers of the head and neck, and they can be malignant or benign. Malignant MSGT account for about 7% of epithelial cancers of the head and neck in the United States, with an annual incidence of about 1 per 100,000 population and a similar incidence is reported in Europe. Benign MSGT occur more frequently, but the precise incidence is difficult to quantify as they are obviously not included in cancer registry data [1].
The management of MSGT is based on clinical assessment, radiologic investigation, and cytologic study of fine needle aspiration biopsy (FNAB) specimens. FNAB is a relatively painless procedure for rapid diagnosis, as the lesions are readily accessible [2]. Nevertheless, since different studies indicate higher values of specificity than sensitivity, parotid carcinomas are frequently misdiagnosed as a benign process (false-negative) than benign lesions are diagnosed as carcinomas (false-positive). A recent retrospective study indicates that among the false-negative results, 5 out of 11 cases of the cytological misdiagnosis were Warthin’s tumours (WT), while among the false-positive results WT, pleomorphic adenomas (PA) and lymphoepithelial lesions were the most common histological types [3]. Tryggvason and
co-authors [4] reported diagnosis of 1,128 salivary gland FNAB. These diagnoses contained very few positives, while false-negatives were more common especially for carcinoma ex-PA which was interpreted as PA for all 6 cases of misdiagnosis.
Nagel and collaborators [5] underlined that PA is most frequently confused in cytology with adenoid cystic carcinomas, principally because adenoid cystic carcinomas and PA are composed of the same cellular and extracellular elements. Diagnosis of a pleomorphic carcinoma may be confused with a mucoepidermoid carcinoma according to Stewart [6].
In cases of WT with predominance of the lymphoid component, squamous cells and necrotic/mucoid debris, there can be a significant diagnostic challenge because the squamous element, in particular, is common to squamous cell carcinomas and muco-epidermoid carcinomas [7]. Aspirates dominated by lymphoid components can be indistinguishable from a reactive lymph node or sialadenitis. WT can be misdiagnosed with lymphocyte-rich acinic cell carcinoma [8].
The increase of the pre-operative diagnosis is crucial for the correct management of such neoplasms, and, in that sense, the identification of molecular markers would surely improve the required accuracy. A more reliable diagnostic tool would help distinguish parotid neoplasms from parotid lymphomas, avoiding unnecessary surgery.
The application of proteomic analysis to different biological fluids has disclosed significant differences in concentration of various proteins between normal and affected subjects, opening the door to the identification of potential biomarkers useful in the early diagnosis and treatment of the disease. At this time, proteomic application in head and neck cancer are confined to search potential markers in tissue [9,10], blood [11] and saliva samples [12] but, to our knowledge, no studies are reported about the application of proteomic analysis to fine needle aspiration (FNA) fluid of the parotid tumour. Proteome analysis has been shown to be a powerful tool for studying human diseases and for identifying novel prognostic, diagnostic, and therapeutic markers. This approach has been successfully used to determine proteomic profile of human thyroid FNA [13] and successively to identify thyroid cancer biomarkers [14].
In this paper, using a combination of two-dimensional electro-phoresis (2-DE) and mass spectrometry (MS), the proteome profile of FNA samples of WT parotid tumours with those of PA samples was compared. The aim of our study is to explore the possibility of performing a proteomic analysis on the most frequent benign neoplasms of major salivary glands, namely PA and WT, to draw their proteomic profile and to point out their most significant features in order to improve FNA cytology accuracy in the pre-operative assessment of such lesions. Differential expression of proteins of interest has been validated by Western Blot (WB) analysis.
Materials and Methods
Materials
Iodoacetamide, dithiothreitol (DTT), 3-[(3-cholamidopropyl) dimethylammonio]-1-propanesulfonate (CHAPS), urea, thiourea, glycerol, sodium dodecyl sulfate (SDS), tetramethylethylenedia-mine (TEMED), ammonium persulfate, glycine and 30% acryl-amide-N,N,N bisacrylamide were acquired from Applichem (Germany). IPGs pH 3–10 NL, pharmalyte 3–10 and dry strip cover fluid were purchased from GE Health Care Europe
(Uppsala, Sweden). Enhanced chemiluminescence (ECL) detection system was purchased from PerkinElmer (MA, USA). Anti-Selenium binding protein 1 (SBP1) was purchased from Sigma-Aldrich (MO, USA); anti-protein S100-A9 was purchased from Santa Cruz Biotechnology (CA, USA); anti-macrophage-capping protein (CAPG) and anti-S-formylglutathione hydrolase (ESD) were purchased from Novus Biologicals (CO, USA); anti-glyceraldehyde-3-phosphate dehydrogenase (GAPDH), anti-An-nexin A1 (ANXA1), anti-alpha crystalline B chain (CRYAB) and anti-superoxide dismutase [Cu-Zn] (SOD1) were purchased from Cell Signaling Technology, Inc. (MA, USA); anti-Ig gamma-1 chain C region (IGHG1) was purchased from Abnova (Taiwan). Secondary antibodies (horseradish peroxidase (HRP)-conjugated) were purchased from Stressgen (Belgium) (donkey anti-rabbit) and from Santa Cruz Biotechnology (donkey anti-goat). All other reagents were acquired from standard commercial sources and were of the highest grade available.
Patients
Thirty-five patients submitted to parotidectomy were included in the study (Table 1). Diagnostic results were obtained from pathology reports that accompanied each specimen and were confirmed after histological examination. The clinical profile and tumour classification are summarised in Table 1.
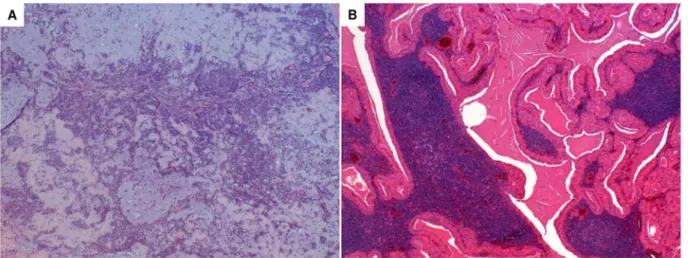
Among the 36 patients, 22 were identified to have PA and 14 WT, the typical hystological images are shown in Figure 1. The histopathological classification was performed in accordance with the World Health Organization classification [15].
Ethics Statement
All patients gave their informed consent for proteomic studies. This study was approved by the Local Ethics Committee (Comitato per la sperimentazione clinica dei farmaci, Azienda Ospedaliera Universitaria Pisana), and signed consent forms were obtained for all patients.
Figure 1. Typical hystological image of PA and WT.The essential components of PA are the capsule, epithelial and myoepithelial cells and mesenchimal or stromal elements. The epithelial component consists of a wide variety of cytologically bland cells, forming sheets or duct-like structures. Ducts show a luminal layer of cuboidal cells and an abluminal layer of myoepithelial cells. The stromal mesenchimal-like component may be myxoid, mucoid, cartilagineous or hyalinised (Haematoxylin & Eosin staining, magnification 4X) (panel A). The tumour is sharply demarcated with a thin capsule, and is characterized by cystic and solid areas composed of lymphoid stroma and the epithelial component. The lymphoid stroma shows varying degrees of reactivity and, usually, germinal centers. The epithelial component comprises two cell layers: the oncocytic luminal cells, tall and columnar with palisading nuclei, and the flattened or cuboidal abluminal cells. Papillary structures usually project into the limina of cystic spaces (Haematoxylin & Eosin staining, magnification 4X) (panel B).
Sample collection and preparation
Immediately after surgical removal of the parotid, a FNA was made on the nodule. After passing the needle through the tissue 3 or 4 times, 1 mL of saline solution was aspirated with the same syringe. This fluid was immediately centrifuged at 2300g for 10 min at 4uC The supernatants were stored at280uC until use. FNA proteins were precipitated with 1% of Trichloroacetic acid containing 1 mM dithiothreitol (DTT). Protein pellets were washed extensively with acetone at 0uC. The resulting pellets were resuspended in rehydration solution (7 M Urea, 2 M thiourea, 4% CHAPS, 60 mM DTT, 0.002% bromophenol blue) and incubated for 30 min. at room temperature. After incubation, the samples were centrifuged for 10 min at 14,000 g to remove undissolved material. Protein concentrations were measured with a RC-DC Protein Assay from Bio-Rad using bovine serum albumin as the standard. All samples were stored at280uC until analysis.
2-DE
Two pools belonging to the PA and WT samples were made and each pool was submitted to 2-DE in triplicate. Isoelectrofo-cusing (IEF) was carried out by using 18 cm Immobiline
Dry-Strips with a non-linear, pH 3–10, gradient. Two-hundred and fifty mg of protein was filled to 350ml of rehydration buffer supplemented with 1% (v/v) pharmalyte, pH 3–10. IEF was performed at 16uC on a Ettan IPGphor II apparatus (GE-Healthcare) as previously described [13,16]. The second dimen-sion was performed using the PROTEAN-II Multi Cell system (Bio-Rad, CA, USA) on 12% polyacrylamide gel (18 cm x 20 cm x 1.5 mm) at 96 mA for 1 hour and at 192 mA for 15 hours applying a continuous buffer system.
Staining and image analysis
The gels were stained with Ruthenium II tris (bathophenanthro-line disulfonate) tetrasodium salt (SunaTech Inc) according to Rabilloud and Lelong [17]. After electrophoresis, gels were fixed for 1 hr. in 1% phosphoric acid (v/v, starting from commercial 85% phosphoric acid) and 30% ethanol; then gels were stained overnight with 1 mM ruthenium complex (RuBP) in 1% phosphoric acid–30% ethanol, destained for 4–6 hrs. in 1% phosphoric acid–30% ethanol and rinsed in water (one rinse, 10 min) prior to imaging. The stained gels were acquired with on fluorescence by ‘‘ImageQuant LAS4010’’ (GE-Healthcare), and
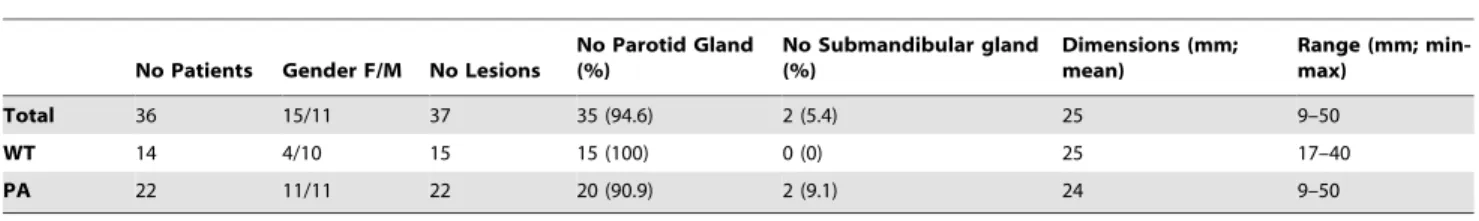
Table 1.Patients’ demographics and clinical features.
No Patients Gender F/M No Lesions
No Parotid Gland (%)
No Submandibular gland (%)
Dimensions (mm; mean)
Range (mm; min-max)
Total 36 15/11 37 35 (94.6) 2 (5.4) 25 9–50
WT 14 4/10 15 15 (100) 0 (0) 25 17–40
PA 22 11/11 22 20 (90.9) 2 (9.1) 24 9–50
WT: Warthin’s Tumor; PA: Pleomorphic Adenoma. doi:10.1371/journal.pone.0071874.t001
Figure 2. Representative 2D gel maps of PA and WT FNA pool samples.A total of 250mg of proteins was separated by 2D using an 18 cm
pH 3–10 NL strip and 12.5% SDS-PAGE. Proteins were detected by Ruthenium II tris (bathophenanthroline disulfonate) tetrasodium salt staining. The maps were analyzed by Progenesis Same Spot (Nonlinear Dynamics) software. Spots numbers indicate all the proteins identified by MS/MS and refer to the number reported in Table 2 (PA) and Table 3 (WT).
doi:10.1371/journal.pone.0071874.g002
Proteomics of Benign Major Salivary Tumours
Spot no. ID Protein name Gene name Th Obs
Matched
peptides Coverage(%)
Best ion
score Peptides identified FV p-value
MW/pI MW/pI
777 P02675 Fibrinogen beta chain FGB 56/ 8.5 51/ 5.8 12 27 75.8 (K)LESDVSAQmEYcR(T) 2.8 6.480e25
812 Q13228 Selenium-binding protein 1 SELENBP1 52/5.9 48/5.6 11 29 94.3 (R)NTGTEAPDYLATVDVDPK(S) 3.6 0.002
1041 Q9UK22 F-box only protein 2 FBOXO2 33/4.3 39/3.9 3 12 87.3 (R)VLAALPAAELVQAcR(L) 4.1 1.936e25
1058 P40121 Macrophage-capping protein CAPG 38/5.8 39/5.6 5 26 59.6 (R)QAALQVAEGFISR(M) 3.0 8.584e25
1221 P04406 Glyceraldehyde-3-phosphate dehydrogenase
GAPDH 36/8.6 35/6.9 10 36 76.4 (R)VPTANVSVVDLTcR(L) 2.6 0.016
1239 P04083 Annexin A1 ANXA1 39/6.6 34/5.8 18 45 102.5 (R)KGTDVNVFNTILTTR(S) 2.0 0.002
1254 P02649 Apolipoprotein E APOE 36/5.7 34/5.0 13 38 93.6 (K)AYKSELEEQLTPVAEETR(A) 3.9 2.383e24
1335 P09525 Annexin A4 ANXA4 36/5.8 32/5.2 11 29 110.1 (K)AASGFNAmEDAQTLR(K) 3.2 0.002
1343 P67936 Tropomyosin alpha-4 chain TPM4 28/4.7 32/4.2 5 19 88.0 (K)IQALQQQADEAEDR(A) 2.1 0.004
1359 P10768 S-formylglutathione hydrolase ESD 31/6.5 32/5.8 3 16 63.0 (K)KAFSGYLGTDQSK(W) 2.4 0.002
1386 P62258 14-3-3 protein epsilon YWHAE 29/4.6 31/4.1 9 33 83.7 (K)KVAGmDVELTVEER(N) 2.7 6.373e24
1570 P02647 Apolipoprotein A-I APOA1 31/5.6 28/4.5 10 36 101.4 (K)LLDNWDSVTSTFSK(L) 2.9 0.050
1700 P32119 Peroxiredoxin-2 PRDX2 22/9.1 25/5.0 4 17 57.9 (K)ATAVVDGAFKEVK(L) 3.9 9.910e25
1831 P30086 Phosphatidylethanolamine-binding protein 1
PEBP1 21/7.0 24/6.1 4 23 53.6 (K)GNDISSGTVLSDYVGSGPPK(G) 2.0 0.025
1904 P02511 Alpha-crystallin B chain CRYAB 20/6.8 23/5.9 4 20 42.9 (K)HFSPEELKVK(V) 2.8 0.006
2046 P00441 Superoxide dismutase [Cu-Zn] SOD1 16/5.7 21/5.3 2 16 35.1 (R)HVGDLGNVTADK(D) 2.8 1.363e26
2276 P62937 Peptidyl-prolyl cis-trans isomerase A PPIA 18/7.7 19/6.0 5 36 66.0 (R)ALSTGEKGFGYK(G) 2.2 0.006
2294 P62937 Peptidyl-prolyl cis-trans isomerase A PPIA 18/7.7 19/6.3 3 22 70.5 (R)VSFELFADKVPK(T) 2.1 0.020
Th: theoretical; Obs: observed; FV: fold variation. doi:10.1371/journal.pone.0071874.t002
Proteomics
of
Benign
Major
Salivary
Tumours
ONE
|
www.ploson
e.org
4
August
2013
|
Volume
8
|
Issue
8
|
the images were analyzed with the Progenesis SameSpot (Non linear - Dynamics) software as previously described [13]. The software included statistical analysis calculations such as Anova p-value and False Discovery Rate (q-p-values). A comparison between PA and WT gels pool was performed. The protein spots with a
.2-fold spot quantity change between the two pools, p,0.05 and q value,0.05 were selected and identified (herein referred to as ‘‘differentially expressed proteins’’).
NanoLC-ESI-MS/MS analysis by LTQ-Orbitrap Velos Analysis
Spots of interest were cut out from gel reference and the nanoLC-ESI-MS/MS analysis by LTQ-Orbitrap Velos was performed as previously described [16]. Peak lists were generated from raw
orbitrap data using the embedded software from the instrument vendor (extract_MSN.exe). The monoisotopic masses of the selected precursor ions were corrected using an in-house written Perl script. The peak list files were searched against the SwissProt/trEMBL database (Release 15.10 of 03-Nov-2009) using Mascot (Matrix Sciences, London, UK). Human taxonomy (98529 sequences) was specified for database searching. The parent ion tolerance was set to 10 ppm. Oxidation of methionine was specified in Mascot as a variable modification. Trypsin was selected as the enzyme, with one potential missed cleavage, and the normal cleavage mode was used. The mascot search was validated using Scaffold 3.4.9 (Proteome Software, Portland, OR). Only proteins matching with two different peptides with a minimum probability score of 95% were considered to be identified. The reference limit to p,0.05 for the probabilistic scores of MS/MS assignment was 45. When multiple proteins were
Table 3.MS/MS data of protein spots up-regulated in WT FNA samples.
Spot
no. ID Protein name
Gene
name Th Obs
Matched peptides
Coverage (%)
Best ion
score Peptides identified FV p-value
MW/pI MW/pI
752 P02768 Serum albumin ALB 69/5.9 53/5.6 24 39 95.1 (K)AEFAEVSKLVTDLTK(V) 4.7 2.710e25 760 P02768 Serum albumin ALB 69/5.9 53/5.3 15 20 80.2 (K)LVAASQAALGL(-) 4.5 2.462e25 766 P02768 Serum albumin ALB 69/5.9 53/5.7 17 28 89.6 (K)LVAASQAALGL(-) 5.8 9.630e25 1057 P02675 Fibrinogen
beta chain
FGB 56/8.5 39/4.9 5 10 86.2 (K)LESDVSAQmEYcR(T) 2.1 2.447e24
1194 P02768 Serum albumin ALB 69/5.9 35/4.8 4 7 45.0 (R)FPKAEFAEVSK(L) 4.2 0.010 1200 P01876 Ig alpha-1 chain
C region
IGHA1 38/6.1 35/5.7 6 20 80.0 (K)TFTcTAAYPESK(T) 3.0 1.289e24
1435 P01857 Ig gamma-1 chain C region
IGHG1 36/8.5 31/5.9 6 23 59.3 (K)TTPPVLDSDGSFFLYSK(L) 6.5 6.774e24
1476 P01834 Ig kappa chain C region
IGKC 12/5.6 30/6.6 3 48 46.5 (K)VDNALQSGNSQESVTEQDSK(D) 3.8 0.002
1476 P60174 Triosephosphate isomerase
TPI1 27/5.6 30/6.6 2 11 63.7 (K)QSLGELIGTLNAAK(V) 3.8 0.002
1511 P0CG05 Ig lambda-2 chain C regions
IGLC2 11/6.9 29/5.2 3 18 74.5 (R)SYScQVTHEGSTVEK(T) 5.4 1.341e25
1523 P01834 Ig kappa chain C region
IGKC 12/5.6 29/5.7 4 54 65.0 (-)TVAAPSVFIFPPSDEQLK(S) 3.6 1.924e24
1523 P0CG05 Ig lambda-2 chain C regions
IGLC2 11/6.9 29/5.7 3 48 58.2 (R)SYScQVTHEGSTVEK(T) 3.6 1.924e24
1525 P01834 Ig kappa chain C region
IGKC 12/5.6 29/5.6 5 67 74.4 (K)VDNALQSGNSQESVTEQDSK(D) 2.7 0.002
1525 P0CG05 Ig lambda-2 chain C regions
IGLC2 11/6.9 29/5.6 2 30 60.8 (R)SYScQVTHEGSTVEK(T) 2.7 0.002
1525 P04792 Heat shock protein beta-1
HSPB1 23/6.0 29/5.6 2 13 60.7 (K)LATQSNEITIPVTFESR(A) 2.7 0.002
1549 P01834 Ig kappa chain C region
IGKC 12/5.6 29/5.7 2 36 54.9 (-)TVAAPSVFIFPPSDEQLK(S) 3.7 1.259e24
1559 P01834 Ig kappa chain C region
IGKC 12/5.6 28/6.3 2 35 50.8 (K)VDNALQSGNSQESVTEQDSK(D) 3.3 8.485e24
1959 P00738 Haptoglobin HP 45/6.1 22/4.9 4 11 69.5 (R)TEGDGVYTLNDK(K) 2.3 4.768e24 2565 P06702 Protein S100-A9 S100A9 13/5.7 13/5.3 4 32 43.8 (R)KDLQNFLK(K) 5.1 3.933e26 2627 P01834 Ig kappa chain
C region
IGKC 12/5.6 11/5.7 3 48 58.4 (K)VDNALQSGNSQESVTEQDSK(D) 5.5 0.004
Th: theoretical; Obs: observed; FV: fold variation. doi:10.1371/journal.pone.0071874.t003
Proteomics of Benign Major Salivary Tumours
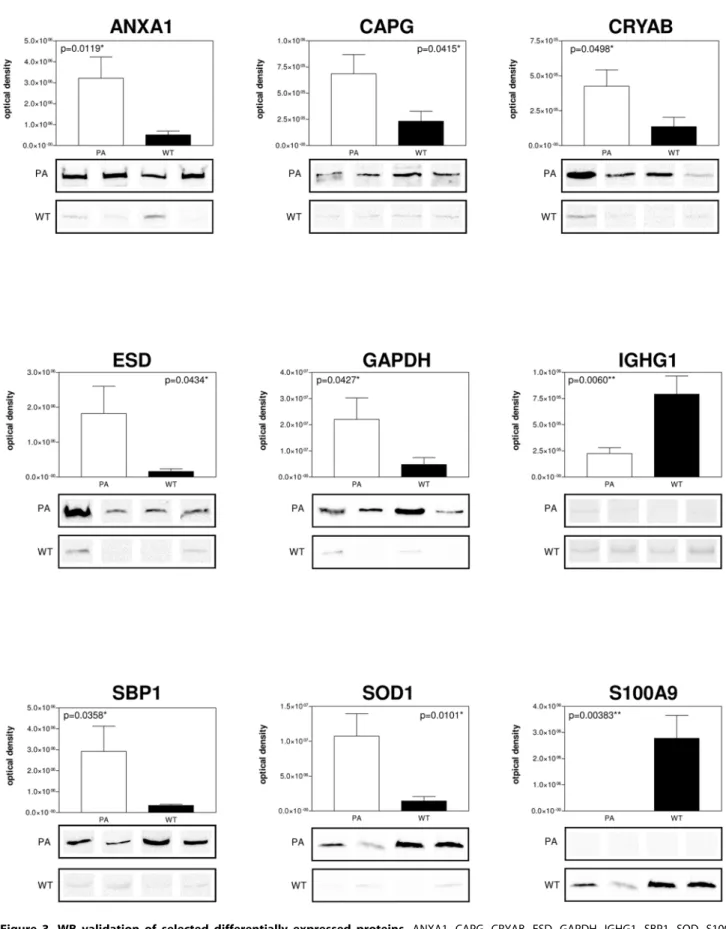
Figure 3. WB validation of selected differentially expressed proteins.ANXA1, CAPG, CRYAB, ESD, GAPDH, IGHG1, SBP1, SOD, S100A9 different expression by immunoblot analysis. Conventional SDS gels were run with protein extracts from PA and WT FNA samples from all samples using 12% resolving capacity. Thirty micrograms of total proteins were loaded into each lane for CAPG, CRYAB, ESD, GAPDH, SBP1, SOD, S100A9 WB, while 10mg were loaded for ANXA1 and IGHG1 WB. Proteins were transferred onto nitrocellulose membranes and incubated with specific antibodies
against the target proteins. Four lanes for PA and WT are shown for each antibody and densitometry of the blots is shown on the top. Statistically significant differences were determined by the Student t test and the p values are indicated.
identified in a single spot, the proteins with the highest number of peptides were considered as those corresponding to the spot.
Western blot analysis
For western blotting (WB), all FNA samples were processed to validate different protein expressions found with 2DE analysis. Aliquots of each FNA sample were mixed with a SDS sample buffer (Laemmli solution). Amount of the samples(ranging from 10 to 60mg of proteins) were run on 12% SDS-PAGE gels, and
transferred onto nitrocellulose membranes (0.2mm) using a
voltage of 100 V for 30 min. (Mini vertical gel system, Biorad). Non-specific binding was prevented by blocking the membranes with 3% low fat dried milk, 0.2% (v/v) Tween 20 in PBS (10 mM NaH2PO4, pH 7.4, 0.9% NaCl) (PBS/milk/Tween) for 1 hr. at room temperature. After blocking, the membranes were incubated with an appropriately diluted primary antibody in a blocking buffer overnight at 4uC (1:200 dilution for anti-protein S100-A9; 1:500 dilution for anti-CAPG and anti-ESD; 1:1000 dilution for SBP1, GAPDH, ANXA1, CRYAB and anti-SOD1; 1:5000 dilution for anti-IGHG1). After four washes with PBS/milk/Tween, the immunocomplexes were detected using a peroxidase-labelled secondary antibody (donkey anti-rabbit 1:10000 dilution, donkey anti-goat 1:5000). Immunoblots were developed using the ECL detection system. The chemiluminescent
images were acquired by LAS4010 (GE Health Care). For the comparison of protein expression levels between PA and WT samples, the antigen-specific bands were quantified using the Image Quant-L (GE Health Care).
Statistical analysis
Statistical analysis of the two classes (PA and WA) of gels was performed by Progenesis Same Spot (Nonlinear Dynamics). The software included the following statistical analysis calculations: Anova p-value, False Discovery Rate (q-values). Statistical significant differences in the immunoreactive bands were calcu-lated by the Student t test.
Signalling pathway analysis
Functional pathway and network analyses were generated using the Ingenuity pathways analysis (IPA) software v14400082 (2012, Ingenuity Systems, www.ingenuity.com). IPA identified the path-ways from the IPA library of canonical pathpath-ways that were most significant to the data set. Proteins that met the expression ratio with a cut-off of.2.0, a p value cut-off of 0.05 for differential expression, and that were associated with a canonical pathway in the Ingenuity Pathways Knowledge Base, were considered for the analysis. HUGO or Swiss-Prot accession numbers and official gene symbols were inserted into the software along with the corresponding
Figure 4. IPA network analysis of WT up-regulated proteins.The network is associated with immunological and inflammatory disease. Solid lines correspond to direct protein-to-protein interactions/regulations, dashed lines correspond to indirect interactions/regulations.
doi:10.1371/journal.pone.0071874.g004
Proteomics of Benign Major Salivary Tumours
comparison ratios between the groups. The network proteins associated with biological functions and/or diseases in the Ingenuity Pathways Knowledge Base were considered for the analysis. These networks were scored for the degree of relevance, with values.3 having a 99.9% confidence level of not being generated by random chance alone. The genetic networks that were created describe functional relationships between gene products based on known associations in the literature.
Results
Proteomic analysis of PA and WT FNA
A comparative proteomic analysis was performed on PA and WT FNA samples using 2-DE followed by nanoLC-ESIMS/ MS. Typical 2D gel images of PA and WT FNA samples are shown in Fig. 2. By computational 2D gel image comparison, a total of 34 proteins differentially expressed were found with a fold variation major than 2. Differentially expressed protein spots were
subsequently subjected to nano LC-ESI-MS/MS analysis and identified, leading to the identification of 26 different proteins. A list of identified proteins, MW, pI, score and coverage values of MS/MS, fold-change in expression levels and p values are shown in Tables 2 (PA) and 3 (WT). Interestingly, several spots (with pI and MW observed different from theoretical) for the same protein were found for serum albumin (n. 752, 760, 766, 1194), for fibrinogen beta chain (n. 777, 1057) suggesting the occurrence of post translational modification which often are associated with different pathological state as reported in type 1 diabetes [18].
Validation of differentially expressed proteins in PA and WT FNA samples by WB analysis
WB analysis, using specific polyclonal antibodies, was used to validate the expression changes of some of the proteins identified by 2DE. A subset of 9 candidate proteins was selected for validation by immunoassays; in particular, the different expression of ANXA1, CAPG, CRYAB, ESD, GAPDH, S100A9, SOD1,
Figure 5. IPA network analysis of PA up-regulated proteins.The network is associated with cancer disease. Solid lines correspond to direct protein-to-protein interactions/regulations, dashed lines correspond to indirect interactions/regulations.
SBP1 and IGHG1 was confirmed. All PA and WT FNA samples were analysed. For each tested protein, the optical density of specific immunoreactive band was determined and the resulting mean values 6 SEM were compared (Fig. 3). From the comparison of PA and WT FNA samples, an increase of expression both of ANXA1 (p = 0.0119), CAPG (p = 0.0415), CRYAB (p = 0.0498), ESD (p = 0.0434), GAPDH (p = 0.0427), SOD (p = 0.0101), SBP1 (p = 0.0358) and of S100A9 (p = 0.00383), IGHG1 (p = 0.0060) was confirmed in PA and WT samples, respectively.
Network construction for biological processes
The assignment of biological processes and the subsequent construction of networks were done using the Ingenuity software. All the proteins that had a.2.0-fold statistically significant change in expression between PA and WT FNA were included in the analysis. Each identified protein was converted to its gene and mapped to its corresponding gene object in the IPA knowledge base. Two networks with a score value of 27 (WT network) and 29 (PA network) were generated (Fig. 4 and 5). Genes or gene products are represented as nodes, and the biological relationship between two nodes is represented as an edge (line). IPA was utilized to retrieve the known functions of each protein. WT network with highest score shows 35 proteins containing 10 of the up-regulated proteins. This network is associated with immuno-logical and inflammatory disease. The diseases associated to this analysis are immunological (p-value 1.42E-2 – 4.93E-2) and inflammatory diseases (p-value 1.42E-2 – 4.93E-2). PA network shows 35 proteins, 12 of them found to be up-regulated in PA samples, that are associated with cancer disease (p-value 7.35E-6 – 4.56E-2).
Discussion
Among parotid neoplasms, misdiagnosis can occur, leading to unnecessary surgical intervention. For instance, from literature reports, it emerges that even if it is still a matter of debate, it can be stated that the development of WT is related to the epithelial cells of the heterotopic salivary gland in the intraparotid lymph nodes [19]. A mixture of oncocytic epithelial fragments and lymphocytes in a proteinaceous background is a typical FNA cytologic finding. Despite these typical cytological features, however, the variegated morphology may lead to an erroneous cytopathological interpre-tation and can make it difficult to differentiate from benign and malignant neoplasms. At present, no genetic or protein biomarkers have been advanced to enhance the accuracy of parotid tumour cytological examination. In previous studies we demonstrated the applicability of FNA proteomics to examine thyroid tumours [13,14]. Now, in this study, for the first time, we performed a proteomic comparative analysis of WT and PA parotid FNA fluids in order to define potential protein biomarkers able to improve pre-operative diagnosis. Thirty-four differentially expressed pro-tein spots, with a fold variation major than 2, were found. Among them, 16 resulted up-regulated in WT with respect to PA, while a down regulation was observed for the residual 18 proteins. Identification by mass spectrometry led to the identification of 26 different proteins. IPA analysis, performed on 16 up-regulated WT proteins, associated with ‘‘Humoral Immune Response, Protein Synthesis, Connective Tissue Disorders’’ network with the Top Bio Functions related to connective tissue disorders, immunolog-ical and inflammatory diseases. As shown by IPA network, changes of S100A9 protein expression levels are known in literature to be associated with autoimmune systemic inflamma-tory diseases such as rheumatoid arthritis [20] and diffuse systemic
sclerosis [21,22] while an increase of IGKC and IGHA1 proteins was found in saliva belonging to non-Hodgkin’s lymphoma patient in comparison with primary Sjo¨gren syndrome [23], directly correlated to the lymphoproliferative process. This observation agrees with previous studies showing that WT is characterized by a strong immunologic reaction, indeed Daguci and co-workers have reported the presence of B-cells (CD20), NK (CD56) and T (CD3), including helper subtypes (CD4) and suppressor (CD8) in the WT’s stroma, something similar to that of normal or reactive lymph nodes. Moreover, there is a strong positivity towards markers of lymphocyte proliferation (CD20cy and CD45RO) [24]. These histological and cytoarchitectural aspects are in line with the proteomic profile emerged in our findings where many proteins related to immune response were found. In particular, we described the overexpression of IGHG1, IGKC, IGHA1 and IgG chains probably directly or indirectly induced from some inflammatory mediators such as tumour necrosis factor (TNF). Conversely, the IPA network obtained from the analysis of PA up-regulated proteins, associated to Lipid Metabolism, Small Mole-cules Biochemistry, Molecular Transport, with the Top Bio functions and diseases related to cell death and survival, free radical scavenging, cancer and inflammatory disease. Fourteen of these proteins were included in the network and are known to be candidate biomarkers in several types of tumours, where are involved in proliferation, invasiveness and apoptotic processes and then synthesis of reactive oxygen species.
As far as CapG is concerned, a 3.0 fold variation in 2D gels analysis and a 2.4 fold variation in WB analysis in PA vs WT samples was observed. CapG was originally identified as the protein that binds to the barbed end of acting filaments [25]. It was found to be overexpressed in lung cancer [26], cholangio-carcinoma [27], colorectal cancer [28], breast cancer [29], ovarian cancer [30], oral cancer [31], pancreatic cancer [32] and in nasopharyngeal carcinoma [33]. CapG appears to play an important role in the process of metastasis by promoting the invasiveness of tumour cells as reported in hepatocellular carcinoma. Kimura [34] compared hepatocellular carcinoma with and without vascular invasion and found that those with vascular invasion showed markedly up-regulated expression of CapG. Moreover, silencing of CapG reduced tumour invasion without affecting the proliferation of the HCC cells.
With regards to CRYAB, different and sometimes opposite roles are described in literature. Our results suggested a strong increase of CRYAB in PAvsWT confirmed also by WB analysis. CRYAB is a member of the small heat shock protein (sHSP) family, is expressed in various tissues where it acts as a molecular chaperone, maintains protein conformation and prevents protein aggregation. This role is described in the cells at physiological levels of CRYAB. In contrast, when overexpressed, it appears to prevent apoptosis through the interaction with the common apoptotic protein pathways [35].
Besides CRYAB, annexins (ANXA1 and ANXA4) and Apoli-poprotein E (APOE) are known to have antiapoptotic function acting by different mechanisms of action. In particular, annexins play important roles in different tumours such as hepatocellular carcinoma, adenocarcinoma of the breast and prostate and head and neck squamous cell carcinoma, where alone/or synergistically regulate apoptosis, carcinogenesis, migration and invasion of tumour cells [36]. In our network, all above mentioned proteins directly interact with TP53 protein. Prediction of the upstream and downstream effects of activation and inhibition on other network proteins, suggests that a simulation of TP53 activation agrees with the observed increase of ANXA1, ANXA4, APOE.
Proteomics of Benign Major Salivary Tumours
These observations are according with an imbalance of apoptotic response as already observed in other adenomas [37].
Overall, our results shed new light on the potential usefulness of a proteomic approach to study parotid tumours, and most importantly they highlight as upregulated proteins from WT and PA generate different networks respectively, with the first correlated to inflammatory and immunity events and the second to early tumorigenesis process such as apoptosis, cellular growth and stress response. These different features might be useful in the differential diagnosis of benign parotid tumours. In fact the identification of new markers may improve the clinical work allowing a more specific diagnosis and consequently, an appro-priate clinical treatment of patients with salivary parotid lesions. Last but not least these markers could overcome the limit of
cytology and could lead to an advantageous reduction of surgical interventions.
Acknowledgments
We thank Mrs. Diana Elizabeth Hearn for her help in translation and revising the manuscript.
Author Contributions
Conceived and designed the experiments: ED LG VS AL. Performed the experiments: ED FC YDV TV. Analyzed the data: GG. Contributed reagents/materials/analysis tools: VS ID SS-F. Wrote the paper: ED LG VS AL. Carried out patients recruitment, sample collections and diagnostic evaluations: VS ID SS-F.
References
1. Eveson JW, Cawson RA (1985) Tumours of the minor (oropharyngeal) salivary glands: a demographic study of 336 cases. J Oral Pathol 14: 500–509. 2. Heller KS, Dubner S, Chess Q, Attie JN (1992) Value of fine needle aspiration
biopsy of salivary gland masses in clinical decision-making. Am J Surg 164: 667– 670.
3. Fakhry N, Antonini F, Michel J, Penicaud M, Mancini J, et al. (2012) Fine-needle aspiration cytology in the management of parotid masses: evaluation of 249 patients. Eur Ann Otorhinolaryngol Head Neck Dis 129: 131–135. 4. Tryggvason G, Gailey MP, Hulstein SL, Karnell LH, Hoffman HT, et al. (2013)
Accuracy of fine-needle aspiration and imaging in the preoperative workup of salivary gland mass lesions treated surgically. Laryngoscope 123: 158–163. 5. Nagel H, Hotze HJ, Laskawi R, Chilla R, Droese M (1999) Cytologic diagnosis
of adenoid cystic carcinoma of salivary glands. Diagn Cytopathol 20: 358–366. 6. Stewart CJ, MacKenzie K, McGarry GW, Mowat A (2000) Fine-needle aspiration cytology of salivary gland: a review of 341 cases. Diagn Cytopathol 22: 139–146.
7. Yaranal PJ, Umashankar T (2013) Squamous Cell Carcinoma Arising in Warthin’s Tumour: A Case Report. J Clin Diagn Res 7: 163–165.
8. Viguer JM, Vicandi B, Jime´nez-Heffernan JA, Lo´pez-Ferrer P, Gonza´lez-Peramato P, et al. (2010) Role of fine needle aspiration cytology in the diagnosis and management of Warthin’s tumour of the salivary glands. Cytopathology. 21: 164–169.
9. Tripathi SC, Matta A, Kaur J, Grigull J, Chauhan SS, et al. (2010) Nuclear S100A7 is associated with poor prognosis in head and neck cancer. PLoS One 5: e11939.
10. Tripathi SC, Matta A, Kaur J, Grigull J, Chauhan SS, et al. (2011) Overexpression of prothymosin alpha predicts poor disease outcome in head and neck cancer. PLoS One 6: e19213.
11. Ralhan R, Masui O, Desouza LV, Matta A, Macha M, et al. (2011) Identification of proteins secreted by head and neck cancer cell lines using LC-MS/MS: Strategy for discovery of candidate serological biomarkers. Proteomics 11: 2363–2376.
12. Gonzalez-Begne M, Lu B, Han X, Hagen FK, Hand AR, et al. (2009) Proteomic analysis of human parotid gland exosomes by multidimensional protein identification technology (MudPIT). J Proteome Res 8: 1304–1314. 13. Giusti L, Iacconi P, Ciregia F, Giannaccini G, Basolo F, et al. (2007) Proteomic
analysis of human thyroid fine needle aspiration fluid. J Endocrinol Invest 30: 865–869.
14. Giusti L, Iacconi P, Ciregia F, Giannaccini G, Donatini GL, et al. (2008) Fine-needle aspiration of thyroid nodules: proteomic analysis to identify cancer biomarkers. J Proteome Res 7: 4079–4088.
15. Eveson JW, Auclair P, Gnepp DR (2005) Tumors of the salivary glands. Barnes L, Eveson J, Reichart P, Sidransky D (Eds.), Pathology and Genetics of Head and Neck Tumors. World Health Organization Classification of Tumors, IARC Press, Lyon, 209–281.
16. Giusti L, Cetani F, Ciregia F, Da Valle Y, Donadio E, et al. (2011) A proteomic approach to study parathyroid glands. Mol Biosyst 7: 687–699.
17. Aude-Garcia C, Collin-Faure V, Luche S, Rabilloud T (2011) Improvements and simplifications in in-gel fluorescent detection of proteins using ruthenium II tris-(bathophenanthroline disulfonate): the poor man’s fluorescent detection method. Proteomics 11: 324–328.
18. Soggiu A, Piras C, Bonizzi L, Hussein HA, Pisanu S, et al. (2012) A discovery-phase urine proteomics investigation in type 1 diabetes. Acta Diabetol 49:453– 464.
19. Teymoortash A, Werner JA, Moll R (2011) Is Warthin’s tumour of the parotid gland a lymph node disease? Histopathology 59: 143–145.
20. Giusti L, Baldini C, Ciregia F, Giannaccini G, Giacomelli C, et al. (2010) Is GRP78/BiP a potential salivary biomarker in patients with rheumatoid arthritis? Proteomics Clin Appl 4: 315–324.
21. Giusti L, Baldini C, Bazzichi L, Ciregia F, Tonazzini I, et al. (2007) Proteome analysis of whole saliva: a new tool for rheumatic diseases--the example of Sjo¨gren’s syndrome. Proteomics 7: 1634–1643.
22. Giusti L, Bazzichi L, Baldini C, Ciregia F, Mascia G, et al. (2007) Specific proteins identified in whole saliva from patients with diffuse systemic sclerosis. J Rheumatol 34: 2063–2069.
23. Baldini C, Giusti L, Ciregia F, Da Valle Y, Giacomelli C, et al. (2011) Correspondence between salivary proteomic pattern and clinical course in primary Sjo¨gren syndrome and non-Hodgkin’s lymphoma: a case report. J Transl Med 9: 188.
24. Da˘guci L, Simionescu C, Stepan A, Munteanu C, Da˘guci C, et al. (2011) Warthin tumor–morphological study of the stromal compartment. Rom J Morphol Embryol 52: 1319–1323.
25. Casella JF, Maack DJ, Lin S (1986) Purification and initial characterization of a protein from skeletal muscle that caps the barbed ends of actin filaments. J Biol Chem 261: 10915–10921.
26. Ha ES, Choi S, In KH, Lee SH, Lee EJ, et al. (2013) Identification of proteins expressed differently among surgically resected stage I lung adenocarcinomas. Clin Biochem 46: 369–377.
27. Morofuji N, Ojima H, Onaya H, Okusaka T, Shimada K, et al. (2012) Macrophage-capping protein as a tissue biomarker for prediction of response to gemcitabine treatment and prognosis in cholangiocarcinoma. J Proteomics 75: 1577–1589.
28. Wu JH, Tian XY, Hao CY (2011) The significance of a group of molecular markers and clinicopathological factors in identifying colorectal liver metastasis. Hepatogastroenterology 58: 1182–1188.
29. Renz M, Betz B, Niederacher D, Bender HG, Langowski J (2008) Invasive breast cancer cells exhibit increased mobility of the actin binding protein CapG. Int J Cancer 122: 1476–1482.
30. Partheen K, Levan K, Osterberg L, Claesson I, Fallenius G, et al. (2008) Four potential biomarkers as prognostic factors in stage III serous ovarian adenocarcinomas. Int J Cancer 23: 2130–2137.
31. Nomura H, Uzawa K, Ishigami T, Kouzu Y, Koike H, et al. (2008) Clinical significance of gelsolin-like actin-capping protein expression in oral carcinogen-esis: an immunohistochemical study of premalignant and malignant lesions of the oral cavity. BMC Cancer 8: 39.
32. Thompson CC, Ashcroft FJ, Patel S, Saraga G, Vimalachandran D, et al. (2007) Pancreatic cancer cells overexpress gelsolin family-capping proteins, which contribute to their cell motility. Gut 56: 95–106.
33. Li MX, Xiao ZQ, Chen YH, Peng F, Li C, et al. (2010) Proteomic analysis of the stroma-related proteins in nasopharyngeal carcinoma and normal nasopharyn-geal epithelial tissues. Med Oncol 27: 134–144.
34. Kimura K, Ojima H, Kubota D, Sakumoto M, Nakamura Y, et al. (2013) Proteomic identification of the macrophage-capping protein as a protein contributing to the malignant features of hepatocellular carcinoma. J Proteomics 78: 362–373.
35. Volkmann J, Reuning U, Rudelius M, Ha¨fner N, Schuster T, et al. (2012) High expression of crystallin aB represents an independent molecular marker for unfavourable ovarian cancer patient outcome and impairs TRAIL- and cisplatin-induced apoptosis in human ovarian cancer cells. Int J Cancer doi: 10.1002/ijc.27975.
36. Mussunoor S, Murray GI (2008) The role of annexins in tumour development and progression. J Pathol 216: 131–140.