WESLEY CANEDO DE SOUZA JUNIOR1 [email protected] ORCID: 0000-0001-5042-0984
NOEL TORRES JÚNIOR2 [email protected] ORCID: 0000-0001-5629-3592
DARIO IKUO MIYAKE3 [email protected]
ORCID: 0000-0002-9452-1338
1 Universidade Federal de Minas Gerais, Escola de Engenharia, Belo Horizonte, MG, Brazil
2 Universidade Federal de Minas Gerais, Faculdade de Ciências Econômicas, Belo Horizonte, MG, Brazil
3 Universidade de São Paulo, Escola Politécnica, São Paulo, SP, Brazil
ARTICLES
Submitted 10.10.2017. Approved 03.22.2018.
Evaluated through a double-blind review process. Associate Editor: Diogo Helal Translated version
DOI: http://dx.doi.org/10.1590/S0034-759020180504
SERVITIZATION AND ORGANIZATIONAL
PERFORMANCE IN THE MACHINERY AND
EQUIPMENT SECTOR
A servitização e o desempenho organizacional no setor de máquinas e equipamentos
La servitización y el desempeño organizacional en el sector de maquinaria y equipos
ABSTRACT
The role of manufacturing in value chains has become less dominant given the trend of stagnating demand, commoditization of products, and declining profitability. Confronted with this challenging sce-nario, a growing number of companies seek to add value to their businesses by adopting the approach of “servitization” (offering product-service solutions). However, literature on this subject is divided on the effectiveness of this approach since the intended outcome is not always achieved (service paradox). As such, this study quantitatively evaluates this relationship in manufacturing firms within the machi-nery and equipment industry. Data on different service categories developed by these firms and their corresponding impacts were collected. It was verified that there is a positive and significant relationship between the majority of these service categories and organizational performance, which indicates that identifying and developing a consistent service bundle may serve as an effective servitization strategy. KEYWORDS | Servitization, Organizational performance, Service paradox, Machinery and Equipment, Pro-duct-service system.
RESUMO
O papel da indústria manufatureira nas cadeias de valor tem se tornado menos expressivo diante da ten-dência de estagnação da demanda, comoditização dos produtos e diminuição da lucratividade. Diante desse cenário desafiador, um número crescente de empresas busca adicionar valor a seus negócios pela vertente da “servitização” (oferta de soluções produto-serviço). Contudo, a literatura dessa temática encontra-se dividida quanto à efetividade dessa abordagem, dado que, nem sempre, traz o impacto esperado no desempenho organizacional (paradoxo do serviço). Diante disso, o trabalho avaliou quan-titativamente essa relação em empresas industriais do setor de Máquinas e Equipamentos. Dados sobre as diferentes categorias de serviços por elas desenvolvidas e seus impactos foram coletados. Verificou--se que há uma relação positiva e relevante entre a oferta da maioria dessas categorias e o desempenho organizacional, o que indica que, identificando e desenvolvendo uma composição de serviços consis-tente, é possível conduzir uma efetiva estratégia de servitização.
PALAVRAS-CHAVE | Servitização, paradoxo do serviço, desempenho organizacional, máquinas e equipa-mentos, sistema produto-serviço.
RESUMEN
El papel de la industria de manufactura en la cadena de producción se ha vuelto menos significativo debido a la tendencia de estancamiento de la demanda, a la comoditización de productos de consumo masivo y a la disminución de la rentabilidad. Ante este panorama desafiante, un número creciente de empresas ha añadido valor a sus negocios a través de la vertiente de la “servitización” (oferta de solu-ciones producto-servicio). Sin embargo, la literatura sobre este tema se encuentra dividida en cuanto a la efectividad de este abordaje puesto que, no siempre, genera el impacto esperado en el desempeño organizacional (paradoja del servicio). Debido a lo explicado anteriormente, este trabajo ha evaluado cuantitativamente esta relación en empresas industriales del sector de Maquinaria y Equipos. Se reco-lectaron datos sobre las categorías de servicios desarrollados por ellas y sus impactos. Se ha verificado que existe una relación positiva y relevante entre la oferta de la mayoría de las categorías y el desempeño organizacional, lo que indica que, identificando y desarrollando una composición de servicios consis-tente, es posible conducir una estrategia efectiva de servitización.
INTRODUCTION
To remain competitive, traditional industries in industrialized countries have adopted various strategies; for example, an efficient product development system to meet market demands, supplying high-quality products that satisfy customers, and reducing production costs that enable them to compete on price
(Bikfalvi, Lay, Maloca, & Waser, 2013). Recent changes in the business environment, such as the increasing competitiveness of developing countries, globalization of markets, and new customer requirements, have made it more challenging to maintain these traditional strategies (Bikfalvi et al., 2013). In response to these new challenges, a growing number of industrial companies have sought to add value to their businesses by providing services
(Bikfalvi et al., 2013;Vandermerwe & Rada, 1988) to achieve potential economic and competitive gains (Oliva & Kallenberg, 2003). This transition from a manufacturer of goods to a supplier of product-service solutions is called servitization (Vandermerwe & Rada, 1988).
Several studies point to the potential positive impacts for supporters of this change, which have stimulated the supply of integrated goods and services promoted by servitization.
Oliva and Kallenberg (2003) highlight that the main impacts are economical, since services generally allow higher margins than goods and provide a more stable source of revenue, as they are more resistant to oscillations in economic cycles that drive investment and the purchase of equipment. Furthermore, as services are less visible and more dependent on human labor, they are more difficult to imitate, and therefore, constitute a sustainable source of competitive advantage.
Conversely, some studies indicate that this transition may not be as advantageous. For example, Bascavusoglu-Moreau and Tether (2011) have found evidence that servitized industrial companies may not achieve superior performance than traditional ones in terms of survival rates, although they do achieve higher productivity. These authors observe positive impacts only in industries that have attained a higher degree of servitization. Other studies by Gebauer, Fleisch, and Friedli (2005) revealed that considerable investment in services could temporarily reduce profit margins. These authors call this phenomenon a “service paradox” in that the investments in services often do not produce better financial results. Thus, the literature contains reports of both successful and failed transitions of industrial companies into servitization and those that have chosen to de-servitize by reducing or abandoning service businesses (Valtakoski, 2017).
Recent literature reviews on servitization theory, such as the one by Baines, Bigdeli, Bustinza, Shi, Baldwin, and Ridgway
(2017), verified that authors still find it difficult to understand how industrial companies can transform efficiently and effectively to take advantage of servitization opportunities. In this context, topics such as the impact of different servitization strategies on the performance of industrial companies and evaluating the profitability of supplying additional services are still under development and deserve more attention.
In another study, Zhang and Banerji (2017) evaluated ProQuest, Scopus, and Science Direct, as the main databases for servitization research, and identified more than 1000 articles on this topic. They selected a sample of 48 highly relevant articles in B2B contexts (business to business), such as in the present study. The authors emphasize the need to develop more quantitative studies so that the research agenda may progress in this field. Furthermore, they highlight the challenge of developing business models and operating processes that ensure the implementation of an effective service strategy. This implies seeking a better understanding of the connections between achieving the potential benefits of servitization and improving organizational performance through mechanisms like the allocation and efficient use of resources (productivity) and an appropriate system for both financial and operational indicators.
In this context, studies can examine the value or gains that servitization can provide. This work aims to explore this gap and poses the following research question: What is the relationship between servitization and the organizational performance of industrial companies? Therefore, the general objective of this work is to evaluate the impact of servitization on the organizational performance of industrial companies.
THEORETICAL DEVELOPMENT
Servitization can be defined as the transition process wherein companies embrace service orientation and/or develop more and better services to satisfy customer needs, achieve competitive advantage, and enhance firm performance (Ren & Gregory, 2007). As a complement, servitization can be seen as developing the innovative capabilities of an organization whose strategy is limited to supply of products, to begin offering product-service systems, thus, leading to better customer satisfaction and a lower risk of the commoditization trap (Kastalli & Looy, 2013).
2011), creating growth opportunities in mature markets (Brax, 2005), and developing more stable revenue streams by combining business cycles with different cash flows (Brax, 2005; Wise & Baumgartner, 1999).
Since it was first mentioned by Vandermerwe and Rada (1988), research on servitization has been continuous and consolidated (Baines et al., 2017). Several nomenclatures have been used to refer to integrated products and services, such as product-service system (PSS), integrated solution and functional products (Park, Geum, & Lee, 2012). In this study, the term “integrated product-service (IPS)” (Park et al., 2012) refers to any offer in which products and services are integrated, regardless of their type, objective(s), and characteristic(s).
Park et al. (2012) have found several examples of services that can be integrated into products, such as installation, training, operation, repair, maintenance, documentation, and consulting. Ultimately, an industrial company can sell the use of equipment, but not the product itself (Schmenner, 2009). Rolls-Royce, for instance, seems to be advancing towards this
(Bascavusoglu-Moreau & Tether, 2011). It still sells aircraft engines, but earns an increasing share of its revenues from providing “total care” maintenance services based on the concept of offering enhanced predictability and reliability for a fixed cost charging. Some manufacturers of products like water purifiers that require regular services ‒ e.g., Woongin Coway from Korea ‒ have already moved further and offer them by lease or rent assuming their maintenance, repair, and control
(Park et al., 2012).
Given the diversity of services that can be integrated into products, the literature is not emphatic on the existence of different servitization levels among industries or about measuring the integration of services and products. However, some authors seem to find a consensus on the mechanism of this integration, and present ways to measure it. Among the classification models evaluated, the models of Parida, Sjödin, Wincent, and Kohtamäki (2014) and Oliva and Kallenberg (2003) seem to be the most congruent. This evaluation is based on the following aspects: i) the two models are characterized by four stages, having been given similar names, ii) they express the same understanding regarding business stages, both at the initial (product-oriented, due to a greater emphasis on products rather than services) and final stages (user-related and result-oriented, due to a greater focus on services, and greater responsibility assumed by the supplier), iii) they contemplate similar services to exemplify each stage.
As for the effect of servitization focused in this work, the organizational performance, the literature addressing the
effectiveness in ascertaining the potential benefits from the implementation of servitization strategy has considered a wide array of factors for evaluation. The perspectives vary from those based on the use of more conventional management indicators
(e.g., Baines and Lightfoot (2013); Bascavusoglu-Moreau and Tether (2011); Goffin (1999);Kastalli and Looy (2013); Neely (2008)) to those that suggest more complex constructs, such as “service success in manufacturing companies” (Raddats, Burton, & Ashman, 2015) or even “survival,” which is the ultimate measure of organizational performance (Benedettini, Swink, & Neely, 2017).
Hypotheses and conceptual model
The effectiveness of servitization is still a matter of debate. Thus, to elucidate some characteristics identified by qualitative studies and examine them within the context of Brazil, the following central research hypothesis was defined:
H1: There is a positive and significant relationship between servitization and organizational performance in the machinery and equipment industries.
This hypothesis examines the relationship between two constructs: servitization and organizational performance, which are referred to in the literature based on different multidimensional models. For a more specific understanding of the nature of servitization and its multiple components, the following secondary hypothesis was derived from H1:
H2: The degree of servitization is formed by the offer of basic services, maintenance services, research and development services, and functional services in the Brazilian machinery and equipment industry.
Similarly, to further analyze the effects of servitization on different dimensions of organizational performance, a second secondary hypothesis was derived as follows:
H3: Performance is reflected in financial performance and operational performance.
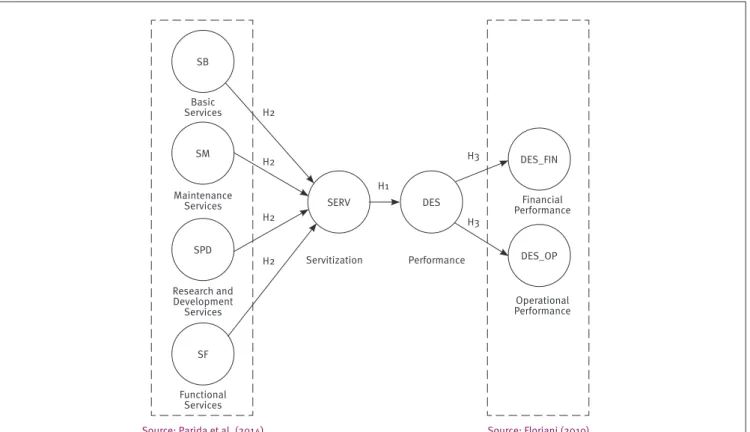
The examination of the relationships among the two focused constructs and between them and the components considered in hypotheses H1, H2, and H3, led to the construction of the structural model in Figure 1.
Figure 1.
Relational hypothetical model with the research hypotheses
Source: Floriani (2010) Source: Parida et al. (2014)
SB
SM
SPD
SF
DES_OP DES_FIN
DES SERV
Basic Services
Financial Performance
Operational Performance Performance
Servitization H1
H3
H3 H2
H2
H2
H2 Maintenance
Services
Research and Development
Services
Functional Services
METHODOLOGY
Validating the theoretical model in this study required information about an industry that is already predominantly servitized. Thus, to determine the relationship considered in this model, Brazilian companies operating in the machinery and equipment sector were chosen as the population of interest, as they represent a mature industry characterized by low market growth and little technological innovation. This has induced the segment to try to improve profitability by offering services (Oliva & Kallenberg, 2003). The data collection procedure to assess the research hypotheses was the direct survey of a target audience (i.e., machinery and equipment industries). Notably, in the sample of papers selected by Zhang and Banerji (2017) in their systematic literature review, only three were classified as surveys. Thus, there remains a lack of theoretical and empirical studies based on primary data collected directly from machinery and equipment manufacturers.
To examine the validity of the theoretical model in this research, multivariate analysis methods based on the structural equation modeling technique (SEM) were adopted. Specifically, to operationalize SEM, the partial least squares estimation (PLS-SEM) method was adopted, which is supported by SmartPLS
3.0 software. This approach was chosen rather than the covariance-based method (CB-SEM), as it is preferable in case of less-developed theories, especially when the main objective is to predict and explain target constructs (Hair, Hult, Ringle, & Sarstedt, 2014, p. 14), as in this study.
Operational definitions for the variables
The variables considered for measuring the inherent aspects of a servitized company are defined below.
Servitization construct
The service categorization model proposed by Parida et al. (2014)
was used to analyze servitization. This model considered 14 types of services within four service categories, allowing them to be treated individually or as composites to represent different servitization levels or intensities.
b. Maintenance services: These IPSs are generally offered to minimize the cost of durable goods, to ensure their proper functioning, and even to take responsibility for those at the end of life through product improvement. Its focus remains on the product, but its attractiveness is generally strengthened through the aggregation of maintenance services.
c. Research and development services: As industries interact with distinct customers, they need to develop internal know-how of their customers’ products and processes. Over time, this understanding can be explored to develop a set of advanced IPSs that would reduce the challenges faced by customers in research and development and improve their profitability.
d. Functional services: These include result-oriented services, such as operating the customer process, or the product sold to them. The purpose of this business model is to sell certain results or capabilities instead of a physical product.
Parida et al. (2014) propose that the constructs listed above be measured using four, three, five, and two manifest variables, respectively, as described in Exhibit 1.
To meet the model’s evaluation requirements, a general variable was used for servitization. This construct was operationalized through a single-item variable, as explained below in the Results section (Stage 1). Its operationalization was based on Oliva and Kallenberg (2003), who argue that as the companies incorporate more product-related services, they evolve along increasing servitization levels. Thus, the servitization construct is measured as shown in Exhibit 1.
Exhibit 1.
Servitization construct indicators
First-order
Construct Abbreviation Definition
Basic Services (SB)a
CB Cost-benefit calculation services (ex.: helping the customer choose the product with the best cost-benefit ratio for their case)
CONS Consulting services for the customer and support by telephone
INFO Written information material (ex.: manuals)
TREI Technical training services for users
Maintenance Services (SM)a
MANUT Maintenance services (ex.: corrective, preventive)
UPG Product upgrading services (ex.: updates, upgrades)
SUP Technical support services for similar products by other manufacturers
Research and Development Services (SPD)a
MANUF Services for analyzing product manufacturability (ex.: calculation and optimization of the design for products that are easier to manufacture)
AP Services for analyzing problems (ex.: a system that monitors operation data of the product sold to the customer and alerts when potential problems might occur)
VIAB Feasibility study services (ex.: feasibility analysis for personalized products requested by the customer)
DESEN Prototype design and development services
PESQ Research services (ex.: study and development of new Technologies, products)
Functional Services (SF)a
OPC Service for operating customers’ process (ex.: The manufacturer uses the product that it produces to operate the customer’s process, but does not sell it. The product is only part of the solution.)
OPV Service for operating the product sold to the customer (ex.: The manufacturer sells the product that it produces to the customer but operates the customer’s process using this purchased product.)
Servitizationb GERAL Company’s level of service orientation considering that the main objective of a “completely
service-oriented” firm is to offer services to its customers, with the product being just a part of the solution.
a Parida et al. (2014)
Performance construct
To evaluate firm performance within the context of servitization, we sought to examine the nature of conventional managerial indicators, which have been addressed in the literature, as they can be easily understood, and managers are generally more familiar with such data. A greater emphasis was on considering financial indicators, especially for measuring business results and the performance of factors that enable servitization (internal efficiency), and the effectiveness of operations that support servitization (external effectiveness).
Requesting performance data from companies through surveys can greatly reduce the response rate, as managers typically treat this information as confidential. Thus, we searched for measurement models in the literature that evaluate performance indirectly (i.e., managers’ perception). However, we did not find any study that presented a validated measurement model to evaluate the performance of servitized industries with structural equation modeling. Thus, we directed the search toward studies that had already validated a form to measure this construct in other contexts indirectly.
Floriani (2010) evaluated the performance of Brazilian companies after internationalization from the perspective of managers and pointed to good results in her measurement model. In this study, the author represented the performance construct by two exogenous constructs: financial performance, and operational performance, as follows:
i. Financial performance: A construct defined by the following indicators – Return on Assets (ROA), which reflects the company’s overall performance, its potential for generating profits, that is, its net profit with respect to total investment (Net Profit/Total Assets); General Profit, which indicates the net profits divided by sales; and Net Profitability, which indicates the percentage of return on the capital invested in the company (Net Profit/Total Investment).
ii. Operational Performance: A construct defined by the following indicators – General Sales Volume of the company, which is the overall sales; Market Share, which indicates the percentage share of the market (total number of units sold by the company in relation to the total units sold in the segment in which it operates); and Operational Productivity, which evaluates efficiency and effectiveness, the former applying to the performance measure of the conversion process from input to output and the latter
to measuring the degree to which the output meets the requirements.
This approach follows the recommendation to not base the performance measurement of organizations purely on financial indicators, when the purpose is to evaluate the development of long-term strategies (Kaplan & Norton, 1996). It also reflects—although partly and very briefly—evaluating organizational performance through a more integrated set of indicators, considering different perspectives, such as financial, non-financial, internal, and external (Neely et al., 2000).
Thus, the two constructs detailed above are measured by three manifest variables, as illustrated in Exhibit 2, which characterizes their perspectives and connects them to several studies on servitization, which consider them (the variable itself or the associated logic) in the discussion or analysis of the potential benefits of this business strategy.
Although considered in a different context, these variables align with perspectives of studies within the context of servitization of industrial companies, as well as with the aspects that may influence the effects of servitization mentioned in the literature. Therefore, we adopted this measurement model in this study.
Data collection procedures
As a unit of analysis, Brazilian machinery and equipment builders were considered, and the questionnaire was designed to collect data on a company’s experience in promoting servitization.
Exhibit 2.
Financial construct indicators based on Floriani’s study (2010)
First-order
construct Abbreviation Indicator Nature of indicator
Referential frameworks that associate the Indicator with
servitization
Financial performance (DES_FIN)
DLG General profitability Financial result measure
Wise & Baumgartner (1999); Allmendinger & Lombreglia (2005); Karlsson (2007); Neely (2008); Prester (2011); Kastkalli &
Looy (2013).
DRA Return on assets
(net profit/total assets) Financial result measure
Wise & Baumgartner (1999); Lindström (2014).
DRENT Net profitability
(net profit/total investment) Financial result measure
Wise & Baumgartner (1999); Goffin (1999); Allmendinger &
Lombreglia (2005).
Operational performance (DES_OP)
DPM Market share External operational effectiveness measure
Goffin (1999); Vandermerwe & Rada (1988)
DPO Operational productivity Internal measure of operational efficiency and effectiveness
Neely (2008); Bascavusoglu-Moreau & Tether (2011); Baines &
Lightfoot (2012)
DVEND Sales volume External operational effectiveness measure
Goffin (1999); Brax (2005); Prester (2011); Kastalli & Looy
(2013).
To characterize the sample considered, in addition to the questions about elements of the theoretical model, others were added to the questionnaire to obtain data about the respondent and the company, such as location (state), sector of operation, main type of manufactured machinery/equipment, and size.
All the manufacturers identified in the portal of the Brazilian Machinery Builders´ Association (Abimaq) were catalogued to obtain access to the target audience. The sample size was scaled considering the most conservative recommendation to take the maximum number of independent variables for reference in the measurement models and/or structural model. As this number is four (four predictors for the servitization construct), it was necessary to obtain a sample with at least 65 observations to ensure a statistical power of 80% and to have coefficient of determination R2 values of at least 0.25, with a 5% error probability
(Hair et al., 2014, p. 21).
To check the semantic appropriateness of the indicators proposed for the constructs measured in the theoretical model
delineated in Figure 1, it was submitted to a pre-test composed of six rounds of evaluation by guest researchers, business consultants, and managers of companies with the desired profile for this study. After the rounds of evaluations, an invitation letter was sent by e-mail to the catalogued companies.
RESULTS
Graph 1.
Respondent profile, state, and company size
Respondent profile
State where company is located
Company size based on gross revenue
Partner/ Owner 7.6%
Manager 29.3%
Rio de Janeiro (RJ); 4.4% Paraná (PR);
8.7%
Santa Catarina (SC); 9.8%
Rio Grande do Sul; 13.0%
Minas Gerais (MG); 13.0%
São Paulo (SP); 50.0%
Small 46.7% Medium/Large
2.2% Medium
15.2%
Micro 35.9%
Espírito Santo (ES); 1.1%
Director 45.7% Other;
17.4%
The sector of operation and the main type of machinery/ equipment built by the companies from this sample are shown in Graph 2.
To test the hypotheses, the collected data was analyzed by applying the PLS-SEM, as recommended by Hair et al. (2014). These authors propose that modeling by this method be conducted through the following stages: i) specification of the structural model, ii) specification of the measurement models, iii) data collection and analysis, iv) evaluation of the path model by the PLS-SEM method, v) evaluation of the measurement models, vi) evaluation of the structural model by the PLS-SEM method, and vii) interpretation of the results. The following sub-stages provide further explanations.
Stage 1: Specification of the structural model
The exogenous first-order constructs in the model are basic services (SB), maintenance services (SM), research and development services (SPD), and functional services (SF), which form the second-order construct for servitization. This model’s endogenous constructs are servitization (SERV), which is formed by the four exogenous constructs mentioned above; performance (DES), which is a second-order construct; and two first-order constructs that reflect performance: financial performance (DES_FIN) and operational performance (DES_OP). The structural model has two higher order components (HOCs), one to represent the four service categories and another to represent the two performance categories.
For the relationship between constructs SB, SM, SPD, and SF, which are lower order components (LOCs), and the SERV (HOC) construct, formative modeling was adopted, acknowledging the first ones as “causes” of the second concept. Moreover, as advised by Hair et al. (2014), this HOC was chosen to make the PLS path modeling more parsimonious, that is, with a smaller number of relationships.
The portion of the model related to measuring servitization in this study follows the type of hierarchical component model referred to as “reflexive-formative,” which indicates formative relationships between the LOCs and the HOC, while each construct is measured by reflexive indicators, as detailed in the following subsection.
Stage 2: Specification of the measurement model
the domain of the constructs, as suggested by Hair et al. (2014). The exogenous latent variables, “basic services,” “maintenance services,” “research and development services,” and “functional services” were defined to have a formative nature, as servitization is represented by a construct that combines the concepts of the cited variables, which cannot be mutually interchangeable. The financial performance and operational performance constructs were defined to have a reflexive nature, in that they treat variables that represent consequences (manifestations) of the respective construct.
The second-order constructs followed the measurement nature of the first-order constructs and are also reflexive. For the performance construct, the repeated indicators approach was used, according to which all the LOC indicators were attributed
to the HOC measurement model. To apply such an approach, Hair et al. (2014) emphasize that the number of indicators must be similar throughout all the LOCs, which was observed in this case for DES_FIN and DES_OP. However, for the servitization construct, the number of indicators for each LOC was not the same, varying from two to five. In this case, the same authors underscore that the relationships between the HOC and LOCs may be significantly influenced by the inequality in the number of indicators. Therefore, to obtain a formative measurement model for the servitization construct, it was considered an endogenous single-item construct. For this purpose, an overall variable named GERAL was defined, which sums up the essence of the servitization construct, and whose nature was defined to be reflexive, as established for single-item construct (Hair et al., 2014).
Graph 2.
Sector of operation and the main type of machinery/equipment of the companies
15%
11%
10% 7% 6% 4% 4% 3% 3% 2% 2% 2%
31%
Machine tools, Tools
Plastic, Chemical, and derivatives Food
Recycling, Basic Sanitation, Environmental Civil Construction, Road Machinery Agriculture
Steelworks
Cellulose, Paper, Wood Ceramics, Glass Cement, Mining Graphics
Petroleum, Petrochemical Others
number of firms: 92
7%
7% 6% 6% 5% 5% 4% 4% 3% 3% 3% 47%
Packaging
Refrigeration; Compressor; Compressed Air; Vacuum Shaker; Mixer; Mill
Boiler, Heat exchanger
Hydraulics; Press; Valves; Automation Transportation and storage
Portable machinery
Welding and cutting of metallic sheets Pumps, motor pumps, and accessories Quality control, tests, and measurement Oven; Heater; Dryer
Others
number of firms: 92
Sector of operation
Type of machinery/equipment
Stage 3: Data collection and analysis
questions required answers, which prevented the occurrence of omitted data. Information from 29 respondent companies was discarded because they either explicitly declared not being service-oriented or that the services offered are not associated with their products, or answered “does not apply” to questions about one or more of the six evaluated performance variables, thus, making it impossible to include them in the structural model. Consequently, 94 cases remained. Among these, a case suspected of straight lining the answers—checking off the same answer for a large proportion of questions (Hair, Black, Babin, Anderson, & Tathan, 2009)—was detected and discarded. Finally, the analysis for outliers employing univariate and multivariate approaches, as suggested by Kline (2011), resulted in identifying only one case with an absolute z value over 4 (-4.144). In the end, upon the removal of these observations, we obtained a sample of 92 cases for analysis.
Data distribution was also verified. For this purpose, we tested normality by using the Kolmogorov-Smirnov test, as the sample size was greater than 50 (Mooi & Sarstedt, 2011). All the variables presented significance equal to 0.00, and thus, the normality assumption was rejected using the Kolmogorov-Smirnov test. As the distribution of none of the study’s variables is normal, it reinforces the decision to adopt the PLS-SEM, because it is a
statistical model that does not require the normal distribution of data (Hair et al., 2014).
Stage 4: Evaluation of the path model by
PLS-SEM method
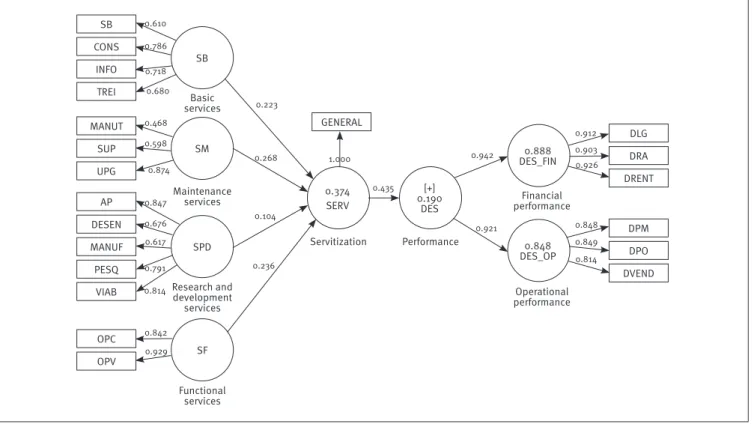
The results from the structural model (Figure 2) show that the exogenous first-order constructs have a servitization effect, varying between 0.104 and 0.268. Maintenance services have the most impact and research and development services the least. Together, the first-order constructs, basic services, maintenance services, research and development services, and functional services, explain 37.4% of the variance of the second-order servitization construct. This, in turn, has an effect of 0.435 on the endogenous performance construct and explains 19% of its variance, which could not be greater due to other factors that also influence organizational performance, which were not contemplated in this study. The second-order performance construct had a direct effect of 0.942 on financial performance and 0.921 on operational performance, and explained 88.8% of the former’s variance and 84.8% of the latter’s variance.
Figure 2.
Structural model with results from PLS-SEM
SB
SM
SPD
SF
0.848 DES_OP
0.888 DES_FIN
[+] 0.190
DES 0.374
SERV Basic
services
Financial performance
Operational performance Performance
Servitization 0.223
0.610
0.847 0.468
0.912
0.848 0.786
0.676
0.842 0.598
0.903
0.849 0.718
0.617
0.929
0.874 0.926
0.814 0.680
0.791
0.814
0.435
0.942
0.921 1.000
0.268
0.104
0.236 Maintenance
services
Research and development
services
Functional services SB
CONS
INFO
TREI
OPC
OPV MANUT
SUP
UPG
DLG
DRA
DRENT
DPM
DPO
DVEND AP
DESEN
MANUF
PESQ
VIAB
Stage 5: Evaluation of the measurement models
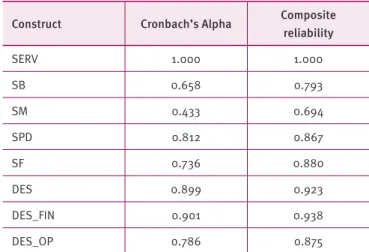
Initially, the model’s composite reliability was assessed. The parameters for evaluating composite reliability indicated by
Hair et al.(2014) are usually interpreted similarly to those of Cronbach’s Alpha, with the appropriate limit between 0.70 and 0.90, although values between 0.60 and 0.70 are acceptable in exploratory research. Table 1 reveals the results of these indices for the constructs considered in this study.
Table 1.
Evaluation of the measurement models
Construct Cronbach’s Alpha Composite reliability
SERV 1.000 1.000
SB 0.658 0.793
SM 0.433 0.694
SPD 0.812 0.867
SF 0.736 0.880
DES 0.899 0.923
DES_FIN 0.901 0.938
DES_OP 0.786 0.875
All the values for composite reliability are above the threshold value to be considered satisfactory, except the index for the maintenance services construct, which nevertheless, was considered to be sufficiently close to 0.7 for acceptance. However, two values referring to the performance and financial performance constructs were found to be between 0.90 and 0.95 and were not desirable. Nevertheless, as this is not a deterrent criterion, which prevents analyses, and most of all, considering the validity of the content supported by Parida et al. (2014), we decided to proceed with the analyses without excluding these items’ variables.
Subsequently, convergent validity was examined. To establish convergent validity, at the indicator level, the values of their loadings (also referred to as outer loadings or “the indicator’s reliability” as a function of the reflexive measurement model) and communality (outer loadings squared) were considered. At the construct level, the average variance extracted (AVE) calculated for each construct based on the average of the commonalities of its variables is considered for being a metric equivalent to communality at the indicator level. All the indicators’ outer loadings must be statistically significant. Therefore, as a “golden rule,” the standardized value of the outer loadings must be equal to or greater than 0.708 (Hair et al., 2014). Communality at the indicator level represents the extent of variation in one item
explained by the construct. In this case, a latent variable must explain a substantial part of each indicator’s variation, which is generally at least 50%. All the results for convergent validity are presented in Table 2.
Table 2.
Convergent validity measure (Indicators)
Latent
Variable Indicator Outer loading Communality
SB
CB 0.61 0.372
CONS 0.786 0.618
INFO 0.718 0.515
TREI 0.68 0.462
SM
MANUT 0.468 0.219
UPG 0.874 0.763
SUP 0.598 0.357
SPD
MANUF 0.618 0.381
AP 0.847 0.718
VIAB 0.814 0.663
DESEN 0.676 0.457
PESQ 0.791 0.626
SF OPC 0.842 0.709
OPV 0.929 0.862
DES_FIN
DLG 0.912 0.831
DRA 0.903 0.815
DRENT 0.926 0.858
DES_OP
DPM 0.848 0.719
DPO 0.849 0.721
DVEND 0.814 0.662
indicators with outer loadings between 0.40 and 0.70 must be considered for removal from the scale only when their exclusion leads to an increase in composite reliability over the suggested threshold value (between 0.60 and 0.90 for exploratory studies) or to an AVE greater than 0.50 (as presented in the following).
Another point to consider in excluding an indicator is evaluating the effects of its removal on content validity. Indicators with weaker outer loadings are sometimes withheld based on their contribution to content validity. However, indicators with very low outer loadings (lower than 0.40) must always be eliminated from the scale. Thus, before any alteration to the indicators, we analyzed the constructs’ convergent validity.
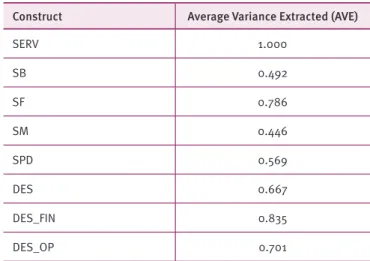
A common measure for establishing convergent validity at the construct level is AVE. According to Hair et al.(2014), an AVE equal to or greater than 0.50 indicates that, on average, the construct explains more than half of the variation of its indicators.
Netemeyer, Bearden, and Sharma (2003) suggest that AVE estimates should be over 0.45. The AVE results for the constructs of this study are displayed in Table 3 (Netemeyer et al., 2003).
Table 3.
Results of the Average Variance Extracted (AVE)
for the constructs
Construct Average Variance Extracted (AVE)
SERV 1.000
SB 0.492
SF 0.786
SM 0.446
SPD 0.569
DES 0.667
DES_FIN 0.835
DES_OP 0.701
An AVE value less than the limit recommended by Netemeyer et al. (2003) was found for only one construct (SM), while the remaining constructs were verified to have convergent validity (0.492 for SB was considered to be sufficiently close to 0.5).
Investigating further into the possibility of excluding indicators, we analyzed the influence of the exclusion of indicators with outer loading values between 0.4 and 0.7 (CB, TREI, MANUT, SUP, MANUF, and DESEN). Table 4 shows the values for AVE, composite reliability, and the adjusted R2 value before
and after the exclusion of indicators. This last coefficient (adjusted
R2) is considered because it is also a criterion used to decide
the exclusion of indicators. It is used to compare results in the PLS-SEM involving models with different numbers of exogenous latent variables. In modeling studies, it is important to look for models that are good at explaining data, but that also have fewer exogenous constructs, that is, which are more “parsimonious.” The adjusted R2 value may be utilized as a criterion to prevent bias
toward complex models. Thus, when it increases after exclusion, it suggests that the model has become more parsimonious.
Considering Hair et al.’s (2014) suggestion to remove variables, based on Table 4, only two indicators were assessed: MANUT and SUP, which make up the SM construct, as all other indicators make up constructs (SB and SPD) with AVE and composite reliability values already above the threshold value. Considering the AVE values from Table 4, the MANUT and SUP indicators would be candidates for removal, as this would result in values above the 0.5 limit for both. Nevertheless, in observing the composite reliability value that they compose for the SM construct, we notice that it is already within the limit suggested for exploratory studies (0.6 and 0.9), which meant keeping these indicators. Moreover, the exclusion of SUP would worsen the adjusted R2 value, making the model less parsimonious. Because
of these points and the application of the same set of indicators in a previous study (Parida et al., 2014) that corroborates the content validity, we resolved not to remove any indicators from the model.
Table 4.
Evaluation of the removal of indicators
Construct Indicator AVE Composite Reliability Adjusted R
2
Before After Before After Before After
SB CB 0.492 0.567 0.793 0.797 0.345 0.352
SB TREI 0.492 0.550 0.793 0.784 0.345 0.355
SM MANUT 0.446 0.582 0.694 0.729 0.345 0.357
SM SUP 0.446 0.591 0.694 0.722 0.345 0.325
SPD MANUF 0.569 0.626 0.867 0.869 0.345 0.348
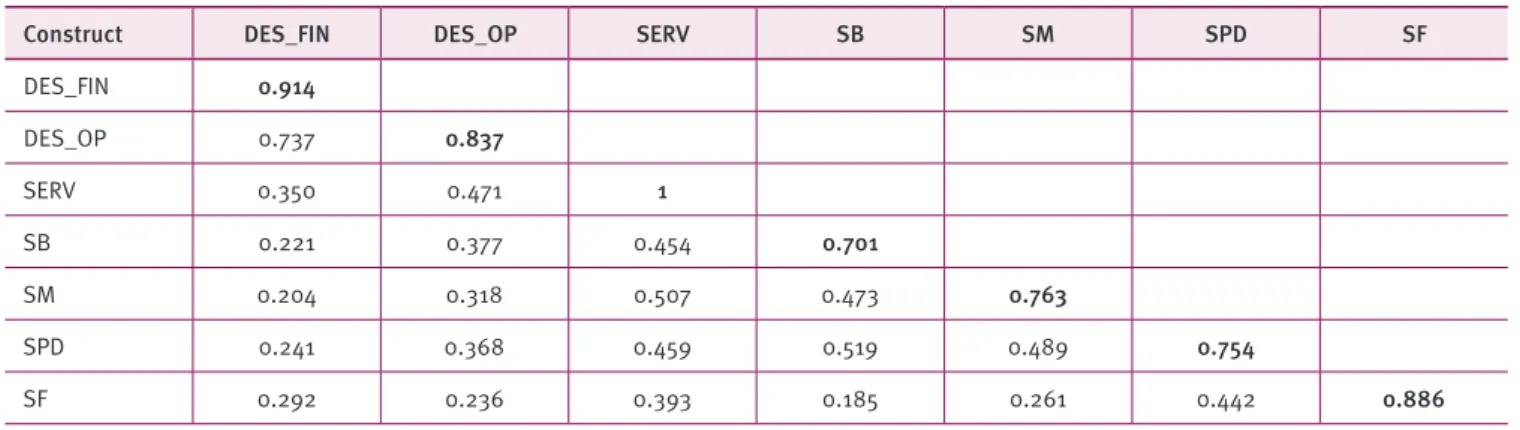
Furthermore, the model’s discriminant validity was verified by adopting the Fornell-Larcker criterion, as it was the most conservative (Hair et al., 2014). According to this criterion, discriminant validity is evidenced when the AVE of each latent variable is greater than the square of the largest correlation with another latent variable (Henseler, Ringle, & Sinkovics, 2009). As shown in Table 5, the data certifies the model’s discriminant validity.
Table 5.
Squared values of the correlations and AVE to apply the Fornell-Larcker Criterion
Construct DES_FIN DES_OP SERV SB SM SPD SF
DES_FIN 0.914
DES_OP 0.737 0.837
SERV 0.350 0.471 1
SB 0.221 0.377 0.454 0.701
SM 0.204 0.318 0.507 0.473 0.763
SPD 0.241 0.368 0.459 0.519 0.489 0.754
SF 0.292 0.236 0.393 0.185 0.261 0.442 0.886
Note: AVE values in bold
Stage 6: Evaluation of the structural model by
the PLS-SEM method
Initially, the occurrence of multicollinearity in the structural model was analyzed. Tolerance levels under 0.20, which correspond to the Variance Inflation Factor (VIF) above 5, in the predicting constructs point to collinearity (Hair et al., 2014). The results presented in Table 6, calculated with the IBM SPSS® version 20
software, do not reveal any multicollinearity issues.
Table 6.
Results of the multicollinearity evaluation
Construct Tolerance Variance Inflation Factor (VIF)
SB 0.652 1.535
SM 0.664 1.505
SPD 0.559 1.788
SF 0.798 1.254
Subsequently, the structural model’s relevance and significance were evaluated by obtaining the values for the path coefficients through the two-tailed Student’s t-test. The results of the statistics for t and p evidenced that the path coefficients were considered to be valid at a significance level α of at least 5% for all the relationships examined in Table 7, except the relationship between SPD and SERV.
Table 7.
Results of the bootstrapping procedure to calculate
t
statistics
Hypothesis Relationship Path coefficient t Statistics P-value Evaluation
H1 SERV -> DES 0.435 3.908 .000 Significant at 1%
H2
SB -> SERV 0.223 2.239 .025 Significant at 5%
SM -> SERV 0.268 2.581 .010 Significant at 5%
SPD -> SERV 0.104 1.057 .290 Not Significant
SF -> SERV 0.236 2.595 .009 Significant at 1%
H3
DES -> DES_FIN 0.942 89.608 .000 Significant at 1%
DES -> DES_OP 0.921 52.084 .000 Significant at 1%
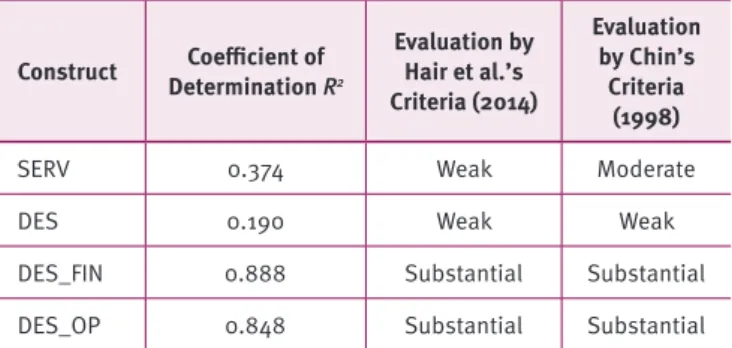
Finally, the coefficient of determination R2 for the endogenous constructs was examined. This varies between 0 and 1, with
elevated levels indicating more predictive precision. According to Hair et al. (2014), in general, R2 values in the order of 0.25, 0.50,
of 0.19, 0.33, and 0.67 in PLS path models as weak, moderate, and substantial, respectively. The evaluation of R2based on these
authors’ criteria is summarized in Table 8.
Table 8.
Evaluation of the coefficient of determination
Construct Determination RCoefficient of 2
Evaluation by Hair et al.’s Criteria (2014)
Evaluation by Chin’s
Criteria (1998)
SERV 0.374 Weak Moderate
DES 0.190 Weak Weak
DES_FIN 0.888 Substantial Substantial
DES_OP 0.848 Substantial Substantial
Stage 7: Interpretation of the results
Table 10 contains the evaluations of the hypotheses. As can be observed from the values of the impact of SERV on DES, the study’s main hypothesis (H1) on the existence of a positive and significant relationship between servitization and performance was corroborated (significant at 1%).
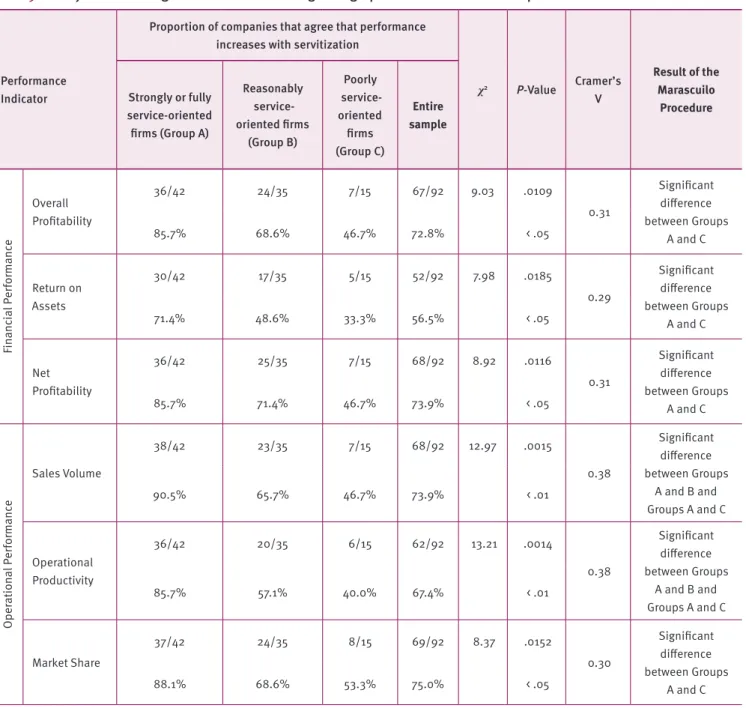
Moreover, H1 was analyzed by applying another method. Thus, we sought to understand whether financial and operational performances differ as a function of the degree of servitization. For this analysis, based on the general variable of servitization (SERV), the firms from the sample were divided into three groups of companies distinguished by the degree of servitization (Group A – Strongly or fully service-oriented companies, Group B – Reasonably service-oriented companies, and Group C –Poorly service-oriented companies). The proportion of firms in each group that agreed that servitization had significantly increased organizational performance was calculated for each of the six measurement variables for organizational performance. To assess whether that proportion varies among the three groups, the Chi-Squared test was conducted, whose results are in Table 9, evidencing that all the performance variables analyzed were influenced differently by the degree of servitization
(Levine, Stephan, & Szabat, 2016). Thus, Cramer’s V was computed to examine the degree of association between these two variables. The results around 0.30 point to a moderate relationship between organizational performance and degree of servitization (Cooper & Schindler, 2016).
The Marascuilo Procedure was used to identify groups with significant differences (Levine et al., 2016). The data demonstrate that the proportion of companies agreeing to a significant increase in operational and financial performance dimensions is greater in strongly or fully service-oriented firms (Group A) than
in poorly service-oriented firms (Group C). These findings confirm the main hypothesis (H1) and corroborate the results obtained with structural equation modeling.
Hypotheses H2 and H3 were also corroborated, as the empirical criteria of the PLS-SEM method were met. For H3, the performance of the researched machinery/equipment builders is strongly reflected in the financial performance and operational performance indices (significant at 1%). Notably, H2 was partially corroborated, as the exogenous research and development services construct was evaluated to be non-significant in the formation of servitization, while the first-order exogenous basic services, maintenance services, and functional services constructs had a relevant effect on the formation of servitization. The research and development services construct may not be significant due to challenges faced by the firms. As it is a service category considered to be more complex than others
(Oliva & Kallenberg, 2003), firms may be encountering difficulties in meeting their clients’ expectations. Moreover, the volume of research and development demanded by the client companies may not be sufficient to justify further investments from Brazilian machinery/equipment builders. This may be the consequence of these firms’ position within the context of a developing country
(International Monetary Fund, 2014), which still lacks a more stimulating environment for innovation. We also underscore the fact that the sample was mostly composed of micro and small firms (Graph 1). The fact that these firms do not possess established research and development capabilities and belong to a sector with a slow pace of technological innovation (Oliva & Kallenberg, 2003) also does not favor the creation and supply of research and development services in a more intense way to their clients.
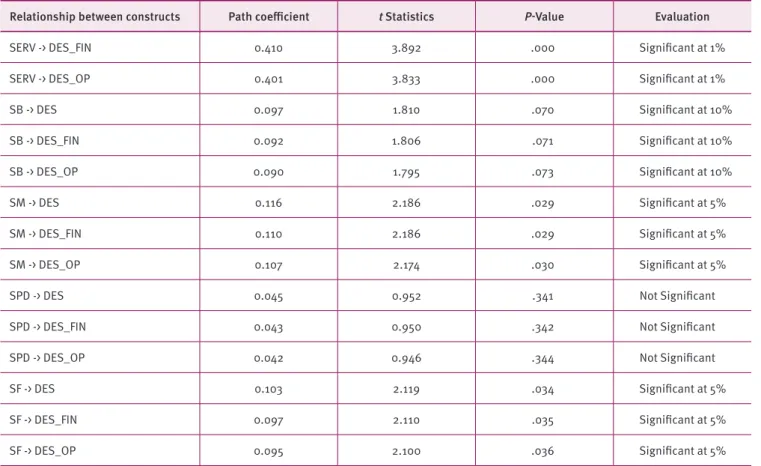
Besides the direct relationships among the constructs examined in the sub-section of Stage 6, the indirect effects of each exogenous construct on the endogenous constructs of the model were analyzed (Table 10). By this assessment, the impact of research and development services was also considered to be non-significant. All the other relationships were significant at a minimum level of 10%, which may be assumed appropriate for an exploratory study such as this one, as suggested by Hair et al. (2014). Therefore, based on the model validated in this study, it is possible to infer part of the organizational performance of a machinery/equipment builder by knowing the level with which it meets its clients’ needs in the provision of the contemplated service categories, and thus, formulate more consistent servitization strategies that reduce the risk of the service paradox. For example, this suggests that investments to develop maintenance services, a service category with the highest path coefficient (0.11) along with financial performance, may provide a better financial return than other categories. In the industrial sector analyzed, investments to develop research and development services can be ineffective and may give rise to the service paradox.
Table 9.
Analysis of the degree of servitization regarding operational and financial performance
Performance Indicator
Proportion of companies that agree that performance increases with servitization
χ2 P-Value Cramer’s V
Result of the Marascuilo
Procedure
Strongly or fully service-oriented firms (Group A)
Reasonably service-oriented firms
(Group B)
Poorly service-oriented
firms (Group C)
Entire sample
Fin
anc
ial
P
er
form
anc
e
Overall Profitability
36/42 24/35 7/15 67/92 9.03 .0109
0.31
Significant difference between Groups
A and C
85.7% 68.6% 46.7% 72.8% < .05
Return on Assets
30/42 17/35 5/15 52/92 7.98 .0185
0.29
Significant difference between Groups
A and C
71.4% 48.6% 33.3% 56.5% < .05
Net Profitability
36/42 25/35 7/15 68/92 8.92 .0116
0.31
Significant difference between Groups
A and C
85.7% 71.4% 46.7% 73.9% < .05
Oper
ation
al
P
er
form
anc
e
Sales Volume
38/42 23/35 7/15 68/92 12.97 .0015
0.38
Significant difference between Groups
A and B and Groups A and C
90.5% 65.7% 46.7% 73.9% < .01
Operational Productivity
36/42 20/35 6/15 62/92 13.21 .0014
0.38
Significant difference between Groups
A and B and Groups A and C
85.7% 57.1% 40.0% 67.4% < .01
Market Share
37/42 24/35 8/15 69/92 8.37 .0152
0.30
Significant difference between Groups
A and C
Table 10.
Evaluation of the indirect effects among the model’s constructs
Relationship between constructs Path coefficient t Statistics P-Value Evaluation
SERV -> DES_FIN 0.410 3.892 .000 Significant at 1%
SERV -> DES_OP 0.401 3.833 .000 Significant at 1%
SB -> DES 0.097 1.810 .070 Significant at 10%
SB -> DES_FIN 0.092 1.806 .071 Significant at 10%
SB -> DES_OP 0.090 1.795 .073 Significant at 10%
SM -> DES 0.116 2.186 .029 Significant at 5%
SM -> DES_FIN 0.110 2.186 .029 Significant at 5%
SM -> DES_OP 0.107 2.174 .030 Significant at 5%
SPD -> DES 0.045 0.952 .341 Not Significant
SPD -> DES_FIN 0.043 0.950 .342 Not Significant
SPD -> DES_OP 0.042 0.946 .344 Not Significant
SF -> DES 0.103 2.119 .034 Significant at 5%
SF -> DES_FIN 0.097 2.110 .035 Significant at 5%
SF -> DES_OP 0.095 2.100 .036 Significant at 5%
As for the impact of servitization on financial performance, in general, the results are congruent with previous studies that observed benefits such as greater profitability (Karlsson, 2007; Prester, 2011; Wise & Baumgartner, 1999), and more elevated margins and less demand for assets than the manufacture of products (Wise & Baumgartner, 1999), reinforcing that the service paradox may be prevented with well-planned servitization. Notably, in their transversal study on the effects of servitization in firms from different segments of the French industry, Crozet and Milet (2017) confirmed that the impact on profitability varies considerably throughout the segments considered and that the gains were greater in the manufacturing segments of mechanical machinery, and electric, optical, and transportation equipment. On the impact of servitization on operational performance, overall, the results revealed to be also congruent with previous studies that observed benefits such as increased productivity, new opportunities for growth, and greater competitiveness (Bascavusoglu-Moreau & Tether, 2011; Brax, 2005; Goffin, 1999; Johnston, 1994; Prester, 2011; Vandermerwe & Rada, 1988; Wise & Baumgartner, 1999).
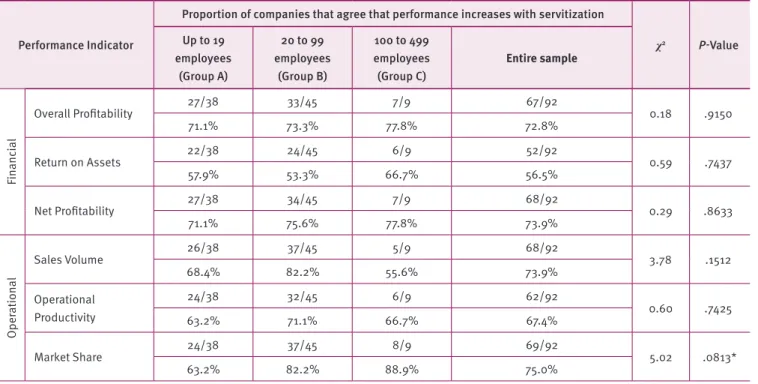
As all firms in the sample have less than 500 employees, the results corroborate the finding by Neely (2008) that smaller servitized firms (with less than 3,000 employees) tend to generate
Table 11.
Analysis of firm size regarding financial and operational performance
Performance Indicator
Proportion of companies that agree that performance increases with servitization
χ2 P-Value Up to 19
employees (Group A)
20 to 99 employees
(Group B)
100 to 499 employees (Group C)
Entire sample
Fin
anc
ial
Overall Profitability 27/38 33/45 7/9 67/92 0.18 .9150
71.1% 73.3% 77.8% 72.8%
Return on Assets 22/38 24/45 6/9 52/92 0.59 .7437
57.9% 53.3% 66.7% 56.5%
Net Profitability 27/38 34/45 7/9 68/92 0.29 .8633
71.1% 75.6% 77.8% 73.9%
Oper
ation
al
Sales Volume 26/38 37/45 5/9 68/92 3.78 .1512
68.4% 82.2% 55.6% 73.9%
Operational Productivity
24/38 32/45 6/9 62/92
0.60 .7425
63.2% 71.1% 66.7% 67.4%
Market Share 24/38 37/45 8/9 69/92 5.02 .0813*
63.2% 82.2% 88.9% 75.0%
*Significant difference at 10%
Of the four categories considered to form the servitization construct, maintenance services, and functional services presented more significant indirect effects on performance, which is similar to the results obtained by Parida et al. (2014).
CONCLUSION
This study allowed for further reflection on the service paradox and identified a positive relationship between servitization and performance. This result contrasts with that of Bascavusoglu-Moreau and Tether (2011), who affirmed that servitized industries do not perform better than traditional industries, although they get increased productivity level of manufacturing. Additionally, this study contrasts with Gebauer et al. (2005) because it relies on questions about the perceived changes in financial and operational performance variables after the firm began to offer services, in order to compare its situation before (when still a traditional manufacturer) and after the transition to servitization. However, the non-significant statistical result of research and development services on financial and operational performance is congruent with the hypothesis of the existence of a service paradox, as indicated by Bascavusoglu-Moreau and Tether (2011). On the other hand, this study identified a positive relationship between the adoption of basic services and financial performance
(Table 10), which opposes the findings of Parida et al. (2014), as they verified that such basic services diminish a firm’s revenue prospects.
The empirical results corroborate the strategy of machinery/ equipment builders to invest in the provision of services. Specifically, the analyses summarized in Table 10 suggest that, in view of the investment alternatives in different service categories, such effort should focus on improving the indicators of the maintenance services and functional services constructs. The potential it has to cause a positive impact on performance in both the financial and operational dimensions is significant. Conversely, within the context of the Brazilian machinery and equipment industry, investments in the provision of research and development services do not seem to have clearly contributed to boosting organizational performance. This suggests that the service paradox phenomenon may cause frustration depending on how the servitization strategy is implemented. One of the research fronts suggested by Baines et al. (2017) is the study of factors that influence the successful adoption of services by manufacturing companies. The results discussed above contribute in this sense. The results of this study hint at the development of future studies on servitization with the following aims:
• Consideration of larger samples that allow comparing the experience of companies from different regions or countries with servitization, as well as ascertain results or patterns with a greater degree of generalization;
• To examine whether the investment volume for the creation and provision of services by industrial firms affects their performance.
This study has some limitations. It is important to note that the results refer to the servitization experience of firms from a particular industrial segment. Moreover, this study does not contemplate the technological stage in which both the manufacturing companies and customers in question find themselves, thereby, restricting a greater generalization of the findings. Regarding the theoretical constructs in assessing the effectiveness in accomplishing the economic benefits of servitization, it is worth mentioning authors such as Baines et al. (2017), Valtakoski (2017), and Zhang and Banerji (2017) who sought to develop a more holistic view of the phenomena that influence the relationships involved in this challenge. Based on an extensive literature review, they identified that it is fundamental to contemplate a marketing perspective encompassing elements such as the value proposition offered, the customers’ value perception, and the interaction between the customer and the firm, which were not examined in this study. As Valtakoski (2017) underscores, in order for servitization to be successful, it is necessary to conceive it acknowledging the dyadic nature of the relationship between the solution provider and each customer’s organization and to search means for value co-creation.
REFERENCES
Allmendinger, G., & Lombreglia, R. (2005). Four strategies for the age of
smart services. Harvard Business Review, 83, 131-145.
Baines, T., Bigdeli, A. Z., Bustinza, O. F., Shi, V. G., Baldwin, J., & Ridgway, K. (2017). Servitization: Revisiting the state-of-the-art and research
priorities. International Journal of Operations and Production
Management, 37(2), 256-278. doi:10.1108/IJOPM-06-2015-0312 Baines, T., & Lightfoot, H.W. (2013). Servitization of the manufacturing
firm: Exploring the operations practices and technologies that deliver
advanced services. International Journal of Operations & Production
Management, 34(1), 2-35. doi:10.1108/IJOPM-02-2012-0086 Bascavusoglu-Moreau, E., & Tether, B. (2011). Servitization, survival
and productivity: A longitudinal study of UK manufacturing firms.
DRUID 2011 – Innovation, Strategy, and Structure – Organizations, Institutions, Systems and Regions. Copenhagen, Denmark.
Benedettini, O., Swink, M., & Neely, A. (2017). Examining the influence
of service additions on manufacturing firms’ bankruptcy likelihood.
Industrial Marketing Management, 60, 112-125. doi:10.1016/j. indmarman.2016.04.011
Bikfalvi, A., Lay, G., Maloca, S., & Waser, B. R. (2013). Servitization and
networking: Large-scale survey findings on product-related services.
Service Business, 7(1), 61-82. doi:10.1007/s11628-012-0145-y Brax, S. (2005). A manufacturer becoming service provider: Challenges
and a paradox. Managing Service Quality: An International Journal,
15(2), 142-155. doi:10.1108/09604520510585334
Chin, W. W. (1998). The partial least squares approach to structural equation modeling. In G. A. Marcoulides (Ed.), Modern methods for business research (pp. 295-358). Mahwah, NJ: Lawrence Erlbaum Associates.
Cooper, D. R., & Schindler, P. S. (2016). Métodos de pesquisa em administração (12th ed.). Porto Alegre, RS: Editora Bookman. Crozet, M., & Milet, E. (2017). Should everybody be in services? The
effect of servitization on manufacturing firm performance. Journal
of Economics & Management Strategy, 26(4), 820-841. doi:10.1111/ jems.12211
Floriani, D. E. (2010). O grau de internacionalização, as competências e o desempenho da PME brasileira. São Paulo, SP: Faculdade de Economia, Administração e Contabilidade, Universidade de São Paulo – USP.
International Monetary Fund (2014). IMF World Economic Outlook (WEO): Recovery strengthens, remains uneven. Washington, DC 20090, U.S.A.
Gebauer, H., Fleisch, E., & Friedli, T. (2005). Overcoming the service
paradox in manufacturing companies. European Management
Journal, 23(1), 14-26. doi:10.1016/j.emj.2004.12.006
Goffin, K. (1999). Customer support: A cross‐industry study of
distribution channels and strategies. International Journal of
Physical Distribution & Logistics Management, 29(6), 374-398. doi:10.1108/09600039910283604
Hair, J. F., Black, W. C., Babin, B. J., Anderson, R. E., & Tathan, R. L. (2009). Análise multivariada de dados (6th ed.). Porto Alegre, RS: Editora Bookman.
Hair, J. F., Hult, G. T. M., Ringle, C., & Sarstedt, M. (2014). A primer on partial least squares structural equation modeling (PLS-SEM). Thousand Oaks, CA: Sage Publications, Inc.
Henseler, J., Ringle, C. M., & Sinkovics, R. R. (2009), The use of partial least squares path modeling in international marketing. In Rudolf R. Sinkovics, & Pervez N. Ghauri (Eds.), New Challenges to International Marketing (Advances in International Marketing, vol. 20, pp. 277-319). Bingley, UK.
Johnston, R. (1994). Operations: From factory to service management.
International Journal of Service Industry Management, 5(1), 49-63. doi:10.1108/09564239410051902
Kaplan, R. S., & Norton, D. P. (1996). Using the balanced scorecard as a
strategic management system. Harvard Business Review, 74(1), 75-85.
Kastalli, I. V., & Looy, B. Van. (2013). Servitization: Disentangling the impact of service business model innovation on manufacturing firm
performance. Journal of Operations Management, 31(4), 169-180.
doi:10.1016/j.jom.2013.02.001
Kline, R. B. (2011). Principles and practice of structural equation modeling (3rd ed.). New York, NY: The Guilford Press.
Levine, D. M., Stephan, D. F., & Szabat, K. A. (2016). Estatística: Teoria e aplicações usando o Microsoft Excel em português (7a ed.). Rio de
Janeiro, RJ: LTC – Livros Técnicos e Científicos.
Lindström, J. (2014). A model for value-based selling: Enabling corporations to transition from products and services towards
further complex business models. Journal of Multi Business Model
Innovation and Technology, 1, 67-98.
Mooi, E. A., & Sarstedt, M. (2011). A concise guide to market research: The process, data, and methods using IBM SPSS Statistics. Berlin, Germany: Springer Berlin Heidelberg.
Neely, A. (2008). Exploring the financial consequences of the
servitization of manufacturing. Operations Management Research,
1(2), 103-118. doi:10.1007/s12063-009-0015-5
Neely, A., Mills, J., Platts, K., Richards, H., Gregory, M., Bourne, M., & Kennerley, M. (2000). Performance measurement system design:
Developing and testing a process based approach. International
Journal of Operations & Production Management, 20(10), 1119-1145. doi:10.1108/01443570010343708
Netemeyer, R. G., Bearden, W., & Sharma, S. (2003). Scaling procedures: Issues and applications. London, UK: Sage Publications, Inc. Oliva, R., & Kallenberg, R. (2003). Managing the transition from products
to services. International Journal of Service Industry Management,
14(2), 160-172. doi:10.1108/09564230310474138
Parida, V., Sjödin, D. R., Wincent, J., & Kohtamäki, M. (2014). A survey study of the transitioning towards high-value industrial
product-services. Procedia CIRP, 16, 176-180. doi:10.1016/j.procir.2014.01.019
Park, Y., Geum, Y., & Lee, H. (2012). Toward integration of products
and services: Taxonomy and typology. Journal of Engineering
and Technology Management, 29(4), 528-545. doi:10.1016/j. jengtecman.2012.08.002
Prester, J. (2011). Servitization as a strategy for survival: Evidence from a small European country. 18th International Annual EurOMA Conference. Cambridge, UK.
Raddats, C., Burton, J., & Ashman, R. (2015). Resource configurations
for services success in manufacturing companies. Journal of Service
Management, 26(1), 97-116. doi:10.1108/JOSM-12-2012-0278 Ren, G., & Gregory, M. J. (2007). Servitization in manufacturing
companies: A conceptualization, critical review, and research agenda. Frontiers in Service Conference 2007. San Francisco, USA. Schmenner, R. W. (2009). Manufacturing, service, and their
integration: Some history and theory. International Journal
of Operations & Production Management, 29(5), 431-443. doi:10.1108/01443570910953577
Valtakoski, A. (2017). Explaining servitization failure and deservitization:
A knowledge-based perspective. Industrial Marketing Management,
60, 138-150. doi:10.1016/j.indmarman.2016.04.009
Vandermerwe, S., & Rada, J. (1988). Servitization of business: Adding
value by adding services. European Management Journal, 6(4),
314-324. doi:10.1016/0263-2373(88)90033-3
Wise, R., & Baumgartner, P. (1999). Go downstream: The new profit
imperative in manufacturing. Harvard Business Review, 77(5), 133-141.
Zhang, W., & Banerji, S. (2017). Challenges of servitization: A systematic
literature review. Industrial Marketing Management, 65, 217-227.