MIGRATION
AND URBANIZATION:
BASIC HOUSING SERVICES
IN SHANTYTOWNS’
Humberfo Olivero, Jr.2 ’
Ma7ceshijt housing, lacking all basic sanitation services, which is the most critical problem of urbanization in Latin America, is also
evidence of the much larger and more complicated problem of the eco- nomic and social development of the countries.
Population Growth in Latin America
Systematic census-taking is relatively
recent in the Latin American countries.
It is unfortunate that the procedure of simul- taneous censuses adopted in 1950 was not repeated in 1960. As a result, the published data show discrepancies. They do, however, give an idea of the tendencies and character-
istics of populat’on growth. Table 1 shows
the growth of the population and the changes
in its distribution between 1950 and 1960
in 20 Western Hemisphere countries, to- gether with the annual growth rates for the total population and for each sector.
One characteristic of the rapid growth of the total population in the developing coun- tries of Latin America is the marked difference between urban and rural growth, the urban being on the average three times greater than the rural.
In gauging the magnitude of this pheno- menon, which is we!1 known, it should be borne in mind that the countries use varying
criteria to define “urban” and “rural”
population-a fact that must also be taken
into account in comparing their situations
1 Published in Spanish in Boletin de la Ojicina Sani- taria Panamericana Vol. LXI, No. 5 (November 1966), pp. 396-407. Paper presented at the Third Meeting of the PAHO Advisory Committee on Medical Research, held in Washington, D. C., in June 1964. See Environ- mental Determinants of Community W&Being, PAHO Scientific Publication 123.
2 Department of Sanitary Engineering, School of Engineering, University of San Carlos, Guatemala.
with respect to water supply and sewerage services in urban and rural sectors. Table 2 summarizes the definitions used by the countries of the Americas in 1950.
On the subject of population growth and
distribution in Latin America, Jorge Arias
(1) writes:
Experience shows that the natural growth of the population tends to be slightly greater in rural than in urban areas, so that higher figures for the rural population would be expected. However, in view of the urbanization trends shown by the various countries as a consequence of unsatisfactory conditions prevailing in agricul- ture, usually under a land-tenure system that is also quite inadequate; the greater educational, medical, recreational, work, and other opportuni- ties in towns; and the industrial development and extreme concentration of most activities in the large cities and especially in the capitals, it is to be expected that rural-urban migration will continue and will increase.
The disproportionate concentration of
the urban population in the capitals as com- pared to the medium-sized and small towns is also a consequence of excessive cen- tralization, of government activities in parti- cular and of all other as well (commercial,
industrial, cultural, educational, recrea-
tional, and so on) (2). By way of illustra-
tion, Table 3 shows the distribution of the
population in the cities, towns, and villages of Guatemala, according to the 1950 census. The same situation is characteristic of the Central American and some of the South American countries.
26 BOLETfN DE LA OFICINA SANITARIA PANAMERICANA
TABLE 1 - Increase in Latin American Population, Total and by Sectors, 1950-1960.
r
Country
Argentina. ... 5,965 6,795 1.0 9,977 14,203 2.8 15,942 20,998 2.1
Bolivia. ... 2,006 2,328 1.G 1,013 1,381 3.1 3,019 3,709 2.1
Brazil. ... 35,955 11,728 1.5 16,021 24,134 4.2 51,976 I 05,862 2.4
Chile ... 2,523 2,627 0.5 3,771 5,007 3.6 6,294 7,634 2.5
Colombia. ... 7,043 7,705 1.0 4,416 i ,066 5.4 11,459 14,771 2.9
Costa Rica. ... 569 729 2.5 232 415 6.0 801 1,114 3.8
Cuba ... 2,795 3,088 1.0 2,713 3,731 3.3 5,508 6,819 2.2
Dominican Republic. . 1,673 2,039 2.0 458 806 5.8 2,131 2,845 2.9
Ecuador. ... 2,312 2,819 2.0 885 1,468 5.2 3,197 4,287 3.0
El Salvador. ... 1,351 1,567 1.5 517 829 4.8 1,868 2,396 2.5
Gnatemala ... 2,131 2,595 2.2 674 1,157 5.2 2,778 3,755 3.0
Haiti ... 2,800 , 3,093 1.0 312 633 7.3 3,112 3,726 1.8
Honduras. ... 1,181 1,440 2.0 247 492 7.1 1,428 1,932 3.1
Mexico. ... 14,823 1 17,203 1.5 11,003 17,423 4.7 25,826 34,626 3.0
Nicaragua. ... 764 , 929 2.0 298 536 6.1 1,060 1,4G5 3.3
Panama. ... 46C I 561 2.0 337 491 3.8 797 1,052 2.8
Paraguay. ... 1,OOE ) 1,060 0.5 388 525 3.8 1,397 1,585 1.5
Pern. ... 5,548 I 6,439 1.5 2,973 4,418 4.0 8,521 10,857 2.5
Uruguay ... 514 c 514 0.0 1,893 2,246 1.7 2,407 2,760 1.4
Venezuela. ... 2,544 L 2,674 0.5 2,430 4,259 5.8 4,974 6,933 3.4
Total ... 94,055 ’ 1 08,092 1.4 61,366 91,103 4.0 .55,423 1 99,195 2.5
Population (thousands)
- .- - .I- -~ - --- .- -_
% %
.JlUU4 tnnual
1950 1960 1950 1960 in- 1950 1960 in-
we&Se crease crease
- .- -- .- -- --- .__- _~ _-
- - -
X’ource: Based on United Nations Economic Commission for Latin America. Eveluacidn de las condiciones de habilacidn, Santiago, 1962, and other documents; may vary somewhat from other published figures.
Rural Urban Total
Causes of Urban Growth
Referring to the three components of urban
population growth-natural growth, rural-
urban migration, and international migra-
tion- a UNESCO publication (2) has
this to say:
of native-born persons prefer to live in cities. In all these countries the foreign-born con- stitute a higher percentage of the urban
than of the total population, and in the
seven for which data are given, the major metropolis has relatively more foreign-born than does the total urban population.”
“In some countries the foreign-born con- The document explains that the rate of
stitute such a small proportion of the total natural increase for each country was based
population that international migration could on the size of the population in the two most
have had a very minor effect upon urbani- recent censuses, pointing out that “except for
zation. In other countries, for example Venezuela, which received a sizable number
Argentina and Panama, the amount of mi- of immigrants between 1941 and 1950, the
gration has been such as to accentuate proportion of foreign-born persons in the
urbanization for, as is indicated . . ., rela- countries under consideration is very small
Oliver0 . MIGRATIOh- AND URBANIZATION 27
TABLE 2 - Definitions of Urban and Rural Population Used by the Countries of the Americas in Censuses Held around 195O.a
country Urban population Rural population
Argentinab ... Bolivia. ... Brazil ... Canada. ...
Chile0 ... ...
Colombiad ... ... Costa Rica ... ... Cubae ... Dominican Republic. ... Ecuador ... El Salvador ... Guatemala. ... ...
Populated centers of 2,000 inhabitants Centers of less than 2,000 in-
or more habitants
The remainder Capitals of departments, provinces and
cantons
Cities (municipal centers) and district centers ~‘vi!.las”)
Populated centers of 1,000 inhabitants or more
The remainder
Centers of less than 1,000 in- habitants
County ((‘comuna”) seats, centers pro- vided with basic services
Populated centers of 1,500 inhabitants or more
Centers not provided with basic
Zones provided with sanitation services, drainage, electricity, btc.
Centers of 150 or more inhabitants pro- vided with basic services
County (“comuna”) seats and munici- pal districts
services
Centers of less than 1,500 in- habitants
Centers not provided with basic services
Centers not provided with basic services
The remainder
Mexico. ... ....
Provincial capitals and cantonal seats Municipal seats
Centers of 2,000 inhabitants or more and those of 1,500-2,000 inhabitant8 pro- vided with water supply service No clear demarcation; generally, cities,
towns, and villages
Communities with 2,500 inhabitants or more
The remainder (rural parishes) The remainder
The remainder
Haiti ... ...
Panama. ... Paraguay ...
Communities with 1,500 inhabitants or more, provided with basic services Communities with certain urban fea-
tures (streets, square) and basic services
The remainder The remainder The remainder The remainder
United States of America. .... Generally, centers of 2,500 inhabitants or more
The remainder Venezuela ... ... Populated centers of 1,000 inhabitants
or more
The remainder
- 4 Source: BasedonInter-American Statistical Institute: L~situacidndelaviviendaen Ambica.
Utqn9,$962. Washington, D.C., Pan American
in t,hese countries has been of minor impor-
tance) or is diminishing (indicating that
many of the foreign-born immigrated some time prior to the most, recent inter-censal
period). In neither case has the volume of
international migration been an important
determinant of the growth rate of the to-
t,al or of the urban population.” From this
article come the figures shown in Table 4 on urban growth due to natural increase and to migration, both internal and international.
Very little information is available on in-
ternal migration in the Latin American
countries; some surveys show that the main reasons for migrating to urban areas were
28 BOLETfN DE LA OFICINA SANITARIA P.4S.4A1IbRIC.4X.4
TABLE 3 - Distribution of 866,139 Inhabitants in TABLE 5 - Reasons Given by 17,426 Heads of Centers of More Than 200 Inhabitants, by Size of Com- Household for Migrating from Provinces to Lima, Peru. munity and Percentage of Population, Guatemala, 1950. -
Type of reason given Percentage
Percentage of - ___-
Number of inhabitants total population considered
100,000to 500,000 1 32.8
10,000 to 99,000 4 7.5
5,000 to 9,999 19 14.9
2,000 to 4,999 63 22.2
1,000 to 1,999 a.3 13.6
200 to 999 142 9.0
Source: Guatemala, National Department of Statistics: Population Census, 1950.
TABLE 4 - Growth of Urban Population due to Na- tural Increase and to Immigration in Nine Latin Ameri- can Countries (per cent).
Country
Venezuela. . . . . Colombia.. , . . Dominican Re-
public.. . . . Nicaragua. . . . . Paraguay. . . . El Salvador. Brazil. . . . . Chile.
Mexico .
-7-
--
-
-
I
Intercensal period
1941-1950 1938-1951 1935-1950 1940-1950 1937-1950 1930-1950 1940-1950 1940-1952 1940-1950
Approximate per- centage of urban mowth due to
-Z-
NaturRl
increase VIigration
29 71
32 ti8
35 35 45 46 51 53 58
65 65 55 54 49 47 42
Source: Based on report of the Bureau of Social Affairs of the United Nations, Population Branch: “Demographic As- pects of Urbanization in Latin America.” Doc.UNESCO/SS/ URB/LA/18/1!W3.
5 reports the answers given in a survey of more than 17,000 heads of families that had gone to Lima, Peru, from the provinces. From this table it may be inferred that housing, hygiene, and health reasons are less important than those of an economic, social,
or educational nature in motivating rural-
urban migration.
Generally speaking, migratory movement is initiaIly from a farm community or rural
Economic. . . . , . 13,713 61.05 Social. . . . . . . . . 5,133 22.85 Educational. . . . . . 1,93G 8.G2 Military (compulsory
service). . . . . . . . 766 3.41
Health... 595 2.65
Housing. . . . . . _ . . , . . . 179 0.80 Other.. . . . . . . . . . 189 0.62 Total replies.. . . , . . . . 22,461” 100.00
Source: Matos Mar. Jo&: “Migration and Urbani- zation. The ‘Barriadas’ of Lima: An Example of Integration into Urban Life.” DOC. UNESCO/SS/URB/LA/11/1958.
’ Some of those questioned gave more than one reason.
area to the nearest population center; then, at a second stage, from here to a larger one, generally the capital or major town of the district; and finally to the capitals and big cities. This movement is the consequence of the imbalance between the development of the medium-sized and small towns and that of the capitals and big cities.
The principal characteristics of internal
migration in Guatemala as determined in a survey (4) may be summed up as follows:
. The tendency to migrate is less pronounced
among the Indian than among the non-Indian population. The Indian population of Guatemala is estimated at slightly more than 50 per cent of the total.
l The Indian population tends to migrate for
shorter distances than the non-Indian.
. With the exception of the capital, where economic, cultural, and governmental activities are concentrated, and of ,a few major 1)lantation and port areas, the main migratory movements are between neighboring departments.
. Indians tend to migrate in the same dircc- tion, non-Indian in several.
Oliver0 . MIGRATIOS ASD URBANIZATIOS 29
l There are more men than women migrants
except among those who go to the capital, where women flock seeking domestic employment.
Shantytowns
The population increase in the Latin
American capitals and larger towns, result-
ing almost entirely from migration from
rural areas and interior towns, has had a marked influence on the formation of shanty- towns.
These shantytowns are generally situat,ed on the outskirts of cities. They ahnost al- ways begin with t’he simultaneous invasion by many families of unused land belonging to the State and in some cases to private
owners. Each family immediately starts
to build a dwelling, using any materials at hand, in an effort to solve its immediate shelter problem and also to ensure a right of
“ownership.” Little by litt.le the original
construction is replaced by another of less miscellaneous and more permanent, materials such as wood, adobe, or brick.
Firmness on the part of municipal and
national authorities could prevent their
establishment at the very beginning or at
least limit their growth, A passive attitude
encourages it.
As soon as they are settled, the inhabi- tants of the shantytowns set about obtain- ing water and electricity services, generally
by establish:ng a committee. Sewerage is
given little importance at first,.
Water service is provided free by the
municipalities at public fountains or stand-
pipes. As time goes by, some residents
organize door-to-door distribution, carrying
the water in cans or jars and charging for
the service. In certain shantytowns in
Guatemala City the charge for delivering one container of about 19 liters (5 gallons) is 4 cents,* and a family must have one a day,
at. the very least, for food preparation. This
means that some of the people in the shanty- towns are paying at, least 1.20 quetzals a
* Quetzal = I dollar.
month to get about 30 to 50 times less water than would be obtained for the same price in a house with a piped water supply.
A similar situation is described in a study (5) of water supplies in Tegucigalpa, Hon-
duras, where in some low-income areas
people in houses connected to the supply sell water to their neighbors at prices 20 to 50 times higher than the rate charged for piped water service.
All this goes to show that water supply to low-income areas needs further study.
Although the rates for electricity are
generally higher than for water in Latin America, it is well known that most low- income families have electricity and the char- ges are collected more rigorously. This sup- ports the idea that a financial solution to the water supply problem could be worked out. The construction of a sewerage system in
shantytowns frequently presents technica
and construction problems more complicated than those involved in water supply and
electricity. Unless a better solution can
be found, it may be necessary to continue using latrines for excreta disposal and absorp- tion pits for liquid wastes, provided that the house has running water.
Housing
As has been seen, the concentration of
the Latin American population in urban
areas has had its greatest physical and en-
vironment,aI impact on housing and its basic
services.
The statistical and other information on
this situation is neither very complete nor
very accurate. The reason is partly that
housing censuses in Latin America are
relatively recent: most of the countries took their first, housing census in or about 1950.
In addition to information about construc- tion and building materials, density of occu- pation, and type of occupancy, the first census of the Americas recorded informa- t on about water service, sanitary services,
L
30 BOLETfN DE LA OBICINA SANITARIA PANAMERICANA
those selected by the United Nations to reflect housing conditions considered funda- mental for the protection of the privak life of families and their members, the protec-
tion of individuals against certain environ-
mental hazards, and the availability of such
indispensable facilities as drinking water
(6).
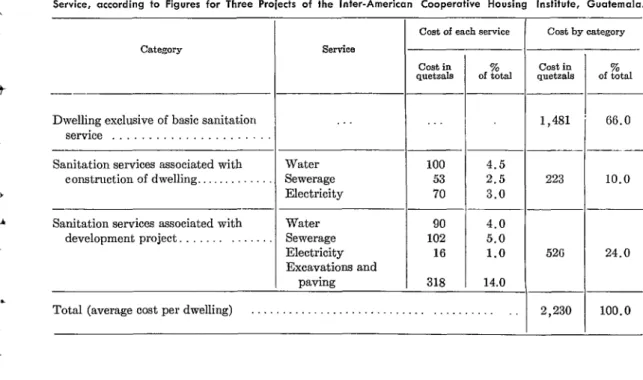
tricity. These costs, which give a general
idea of the problem, are based on three pro- grams carried out by the Inter-American Cooperative Housing Inst’itutc in Guatemala, two in Guatemala Cit,y and one in a depart- mental capital.
The fact that water and sanitary services
are generally recognized as fundamental
components of housing is worth noting. This consensus must bc preserved.
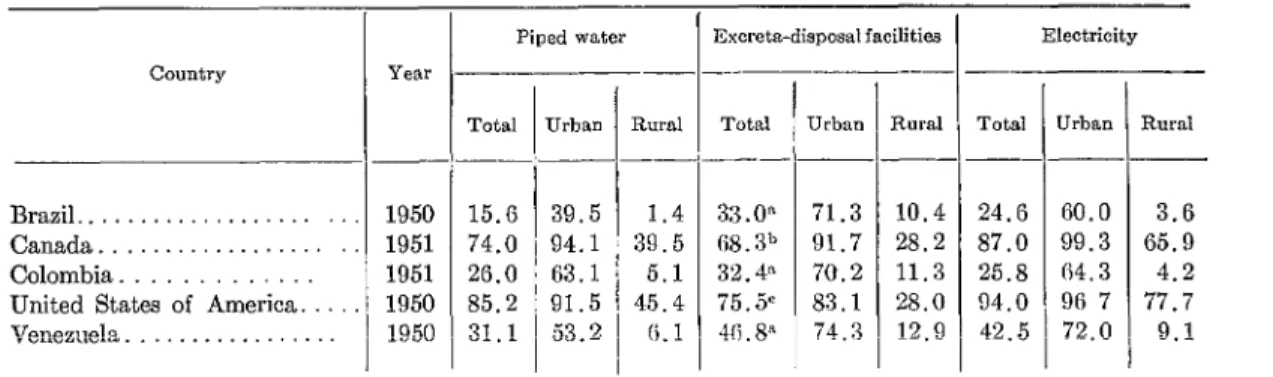
With a view to presenting a general pic- ture of basic housing services, data for several American countries based on t’he 1950 census have been tabulated in Table 6. The limi- tations of this information should be borne in mind. According to the publications from which it was taken (7), it can only be con-
sidered approximate because in most in-
stances the terms used have not been defined and are subject to differing interpretations. It is to be hoped that subsequent censuses
will provide better information than that
available at present.
Cost of Various Services
This section contains information on the
cost of low-income housing and of the basic
services-water supply, sewerage, and elec-
TABLE 6 - Housing and Basic Services in Five American Countries (per cent).
Housing projects involve two main types of cost: the cost of actual house construction
and that of installing facilities. To give an
over-all picture-since the costs attributable
to water supply, sewerage, and electricity belong in part under each of these heads- all the pertinent data arc presented in Table 7. The table shows the average building cost per unit and the cost of equipping it with basic services, the latter figure broken down into the costs imputable to the house itself and those related to the development as a whole. These figures do not, include the value of t,he land, interest, or loan services but do include the cost of administering and super- vising t,he construct’ion program.
Under the head of costs “associated with
development projects” arc included the
following:
l Drinking water. Distribution within the de- velopment project and connection both to the city mains and to each house, including the meter.
l Sewerage. Sewers within the development
project up to their connection to the city system and to the house.
country
Brazil. . . . . . .
Canada . . . . .
Colombia.
United States of America.
Venezuela. . . . . . . . .
-
-
Year
--
1950 1951 1951 1950 1950
Piped water
-
I
Excreta-disposal facilities Electricity_---
Total Urban Rural
.-
_-
Total Urban
__--- ---
15.6 39.5 1.4 33.0” 71.3 74.0 94.1 39.5 G8.3” 91.7 26.0 63.1 5.1 32.4% 70.2 85.2 91.5 45.4 75.5c 83.1 31.1 53.2 0. 1 41;. 88 i4.3
Rural Total __- --
10.4 24.G 28.2 87.0 11.3 25.8 28.0 94.0 12.9 42.5
Urban Rural --
GO.0 3.8 99.3 65.9 64.3 4.2 98 7 77.7 72.0 9.1
Source: Inter-American Statistical Institute: La situaci6n de la vivienda en An&rim. Washington, D. C.: Pan American Union. 1962.
Oliver0 . MIGRATION AND URBANIZATION 31
TABLE 7 - Total Average Cost per Dwelling, Cost by Category (Construction and Development) and Cost by Service, according to Figures for Three Projects of the Inter-American Cooperative Housing Institute, Guatemala.
Coat of each service I Cost by category
Cost in
quetrals --
Dwelling exclusive of basic sanitation service . . . .
Sanitation services associated with Water 100 4.5
construction of dwelling.. Sewerage 53 2.5 223
Electricity 70 3.0
Sanitation services associated with Water 90
development project. . . Sewerage 102
Electricity 16
Excavations and
paving 318 -
1,481
4.0 5.0
1.0 52G
14.0
Total (average cost per dwelling) . . . . . . . . . . . 2,230
%
of total
66.0 __-
10.0
24.0
100.0
l Electricity. Overhead distribution lines and
connection to the principal city system and to
each house, excluding the electric meter.
Under “construction” the cost for water
services, sewerage, and electricity are as
follows :
l Drinking water. Pipes inside the house and also the sanitary equipment (flush toilet, wash basin, shower, and sink). The equipment and its installation account for about 75 per cent of the total cost.
. Sewerage. Piping inside the house. . Electricity. Internal electrical wiring. In view of the difficulty, or near impossi- bility, of trying to replace all dwellings in bad condition with new dwellings, it would
be advisable to examine the possibility of
urban-renewal programs in some shanty-
towns-of improving and rehabilitating
existing dwellings provided they can be
brought up to certain miniium standards.
Such a program would require technical assistance and guidance for the inhabitants.
Two levels of planning might be con-
sidered: national and local. In various
Latin American countries in the past decade
there has been a tendency to try to solve all problems by means of national bodies, which
naturally have their headquarters in the
capital, and thereby to increase the already
exaggerated centralization and cut even
further into local authority.
This adds to inertia and undermines the
community initiative and interest that are
fundamental to the development of a nation within a democratic system. In a paper on
urbanization and physical planning, Dorich
(8) says with respect to governmental cen-
tralization that “the public has ended by
believing that the State alone is responsible for improving living conditions; it therefore makes no demands on its local authorities and the provinces are left to languish undis-
turbed. Their inhabitants are intent on
moving to the capital so as to raise their
level of living. . . .”
32 BOLETfN DE LA OFICINA SANITARIA PANAMERICANA
unit at the national level to set standards for municipal plans and provide the local agencies with technical assistance for studies,
preparation of plans, and improvement of
administrative practices.
Discussion
The rapid urbanization occurring in Latin America, leading to the overcrowding of a small number of cities, has created environ- mental sanitation problems whose solution is a complex matter.
Costs. Although the costs shown in Table 7 apply to one type of dwelling and may vary for other countries and other types of con-
struction, characteristics, and prices, they
do make it possible to compare the cost of the various basic services with that of the
dwelling itself. It is to be noted:
l That basic sanitation services are re-
latively inexpensive in relation to the dwell- ing itself; and
l That water and sewerage services in
housing programs generally depend on the
services of the city involved. Therefore, the
solution of the fundamental problem of
providing these services in low-income areas depends to a great extent on the capacity and efficiency of these general city services.
Xtudying and planning. Almost all authori- ties in the complex field of housing are agreed that the solution of the problem depends both on raising family incomes and on build- ing enough dwellings within the reach of those incomes.
There are families in the big cities unable to pay for housing that meets the accepted
standards. Furthermore, the countries can-
not afford to subsidize large-scale housing programs for low-income groups (9).
In view of this, it would be advisable to concentrate on the following aspects:
. Small, simple dwellings could be built that, even if not up to current standards, are within the reach of the neediest groups, satisfy require- ments at a lower cost, and have the basic services of water supply and excreta disposal, although in the simplest possible form.
l There is a need for research programs aimed
at reducing construction costs through the use of cheaper materials and through higher output.
l The visible aspects of shantytowns (their
makeshift, insanitary housing and their lack of basic services) appear at first sight as the most important problem of urbanization, but these are also evidence of the much larger and more complicated problem of national economic and social development.
l Perhaps the main problem of the urban en-
vironment is the shortage of housing and the inability of many low-income families to find shelter with the minimum facilities, in particular water and sewerage services.
l The mushrooming of shantytowns is often
due to a lack of firmness and method on the part of governmental and municipal authorities.
. The problem of water supply and sewerage in shantytowns is to be solved primarily through the systems serving the rest of the city. Only very rarely is a separate solut,ion justified.
These considerations, especially the last, reveal how important general water supply and sewerage systems are and how high a priority they deserve, particularly since cities where such services are ample and efficient will be able to solve the shantytown problem more quickly and adequately.
Summary
After examining population growth trends, both urban and rural, in Latin America and
pointing out the disproportionately larger
urban growth, this paper deals with the housing problem arising from the concen- tration of population in urban centers, es- pecially the critical problem of shantytowns. It is considered that a firm attitude on the part of the authorities at the time shanty- towns begin to form could deter or at least limit their growth.
Oliver0 . MIGRATION AND URBANIZATION 33
Low-cost housing-virtually the only so-
lution to the shantytown problem-is dealt
with from the standpoint ot the costs of
construction and of installing urban faci-
lities. The cost of basic housing services is
examined and the conclusion is reached that, in view of the measures to which shantytown dwellers resort for certain services (water for example), it would be more economical for them to pay for regular services. The author points out that many low-income families pay for electricity without protest, which shows that a similar financial solution could be found for water supply and sewerage services. Except in very special cases, basic sanitation services in shantytowns should be provided through the regular municipal serv- ices.
REFERENCES
(1) Arias, Jorge: La situacio’n demogr&ica en illtico ?/ Cenko AmBrica. International Planned Parenthood Federation, Fourth Conference, San Juan, Puerto Rico, April 1964.
(2) Bureau of Social -4ffairs of the United Nations, Population Branch: “Demographic Aspqcts of Urbanization in Latin America.” Dot. UNESCO/SS/URB/LA/l8/1958., pp. 39, 42.
(5) Matos Mar, Jo&: “Migration and Urbaniza- tion. The ‘Barriadas’ of Lima: An Example dN;s;g;;do;uh;, L~;l~,lg~fe.” Doe.
(,I) Arias, Jorge: “Migracibn interna en Guate- mala,” Estadistica, 20(26) : 519-527, 1962. (5) Seidel, Harris F.: Feasibility Report on the
Tegucigalpa Water Utility, 1962 (AID re- port).
(6) United Nations, Economic Commission for Latin America: Evaluacidn de los condiciones de habitaci6n. Santiago, 1962.
(7) Inter-American Statistical Institute: La s&z- &n de la wivienoh en Ambrica. Washington, D. C. : Pan American Union, 1962.
(8) Dorich T., Luis: “Urbanization and Physical Planning in Peru.” Dot. UNESCO/SS/ URB/LA/5/1958.