Contagion Phenomena in
Financial Crises: Evidence from
the Portuguese and Spanish
Exchange Rate Crises in the Early
1990s
Margarida Abreu
Instituto Superior de Economia e Gesta˜o – CISEP.
Abstract
Based on the experience of the Portuguese and Spanish financial crises in the early 1990s, this paper suggests that the spillover of exchange rate crises may reveal a particular dimension of the financial contagion effect: the presumption of mimetic behaviour by monetary authorities.
This paper analyses the evolution of the credibility of the Escudo and the Peseta. We set out to test the existence of a contagion effect: that is, in what way does the polarization of exchange rate expectations in a scenario of devaluation of one currency explain the building up of a similar scenario for the other currency? We also examine the transmis-sion mechanisms of such a scenario.
Our results suggest the existence of a one-way contagion effect, of the Escudo by the Peseta. Speculative attacks against the Peseta necessarily give rise to speculative attacks against the Escudo, regardless of the evolution of the ‘fundamentals’ of the Escudo. In this case, the spillover
of financial crises could be better understood by the anticipated mimetic behaviour of monetary authorities, rather than by the geographical proximity of the countries in question or by the identical performance of the economies of both.
I. Introduction
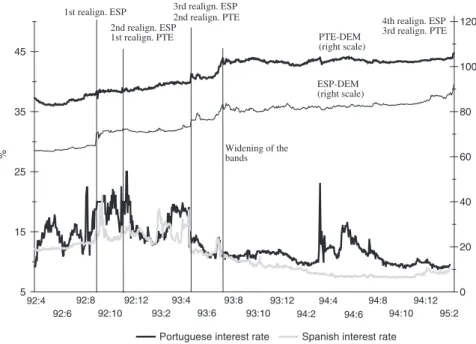
The Spanish Peseta joined the EMS exchange rate mechanism (ERM) in August 1989 and the Portuguese Escudo followed suit in April 1992. Both currencies participated in the 76% fluctuation band around the central parity until the widening of the band in August 1993. From the very beginning and until the general EMS crisis in September 1992, the external nominal value of both currencies remained stable. Both the Peseta and the Escudo were among the strongest currencies in the mechanism: they remained well within the superior half of their fluctuation band, appreciated relative to their central parities as well as to the Deutschmark. Despite this past behaviour, both currencies were subject to numerous speculative attacks, far beyond the general EMS crisis, giving rise to three simultaneous currency devaluations of the respective central parities between September 1992 and March 1995.
Prior research1has attempted to find possible reasons for the Portuguese and Spanish exchange rate crises of the early 1990s. However, to the best of our knowledge, none of these studies looked for contagion arising from links between events in the two countries.
There are several explanations as to why crises tend to be bunched or clustered (Caramazza et al. 2000; Jeanne 1999; Williamson 2000b). A crisis in one country can spread to others via trade links. Once one country has devalued, it is costly (in terms of a loss of competitiveness and output) for other countries, who have strong trade links with the first country to maintain their parities (Glick and Rose 1999). An original disturbance can also spread across countries via financial links. Abreu and Scialom (2000) and Calvo (1996) stress the role of liquidity. A leveraged investor facing margin calls needs to sell his asset holdings. This leads to other asset prices being depressed. Goldstein et al. (2000) highlight the role of common lenders: the need to rebalance the overall risk of a bank’s asset portfolio can lead to a credit crunch. Another family of contagion models has emphasized the role of the correlation of fundamentals in the presence of asymmetric information among investors (Kodres and Pritsker 1998).
1See for instance Bartolini and Prati (1999), Campa and Chang (1998), Kempa and Nelles
The Portuguese and Spanish exchange rate events studied in this paper seem to correspond to another special case of contagion. In this case, spillover seems to be better explained by the anticipated mimetic behaviour of the Portuguese monetary authorities vis a` vis the Spanish monetary authorities, rather than focusing on the geographical proximity of the countries or on the strong direct trade or financial links existing between them. We view this phenomenon as a particular case of the escape clause approach to currency crisis (Eichengreen and Wyplosz 1993; Isard 1995; Sutherland 1995).
The escape clause approach views exchange rate arrangements as conditional commitment devices. A country which adheres to a fixed exchanged rate arrangement commits itself to maintain the exchange rate within a particular band, in view of certain benefits. This commitment is, however, limited, in the sense that the country’s policy maker may always have recourse to the escape clause, i.e., if the costs associated with the fixed peg come to outweigh the benefits of the same. From this perspective, a currency crisis is a situation in which private agents perceive that monetary authorities are on the brink of abandoning the prevailing exchange rate policy.
What would seem to be particular to the Portuguese case is that market expectations of the monetary authorities’ evaluation of benefits and costs depend mostly on the likelihood of Spanish monetary authorities abandon-ing the prevailabandon-ing exchange rate commitment in response to a speculative attack. If Spanish authorities respond to an attack with a devaluation of the Peseta, this will sharply increase the cost of the prevailing exchange rate policy in Portugal. Investors revise their beliefs on the continuity of the Portuguese commitment to the exchange rate system insofar as mimetic behaviour of Portuguese monetary authorities is expected. Speculative attacks against the Peseta necessarily lead to speculative attacks against the Escudo, regardless of the evolution of the ‘fundamentals’ of the Escudo.
We evaluate this contagion effect via the econometric estimation of the expected rate of depreciation of each currency in the band, using information pertaining to the other country’s financial market as explanatory variables.
Considering that among European ERM members, interest rates were, during this period, almost the only effective monetary instrument, we used the influence of interest rates on the expected rate of depreciation of the Escudo within the band as a proxy for the effect of monetary policy on exchange rate expectations.2
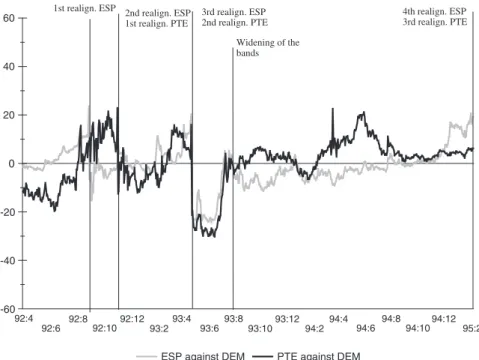
2Figure 1 shows exchange rates of the Portuguese Escudo and the Spanish Peseta against the
Section II briefly presents the parametric tests used to evaluate the credibility of the exchange rate policy in each country. Section III presents our own estimations: the expectation of a currency devaluation is measured here by the interest rate differential, adjusted by the estimated depreciation expectation of a currency within the band. Conclusions are presented in Section IV. Our results suggest the existence of a one-way contagion effect, of the Peseta on the Escudo. The Peseta does not suffer any impact as a result of fluctuations in the credibility of the Escudo exchange rate. In this case, the spillover of financial crises can be better understood by the anticipated mimetic behaviour of monetary authorities rather than by the geographical proximity of the countries or by an identical performance of the economies of both countries.
II. Parametric Credibility Tests
We estimated the anticipated rate of devaluation for the Escudo and for the Peseta using parametric credibility tests in the tradition of Svensson (1991a), Rose and Svensson (1991) and Bertola and Caballero (1990). It was assumed that the anticipated total rate of depreciation of a currency is equal to the interest rate differential, i.e. we accept the hypothesis of uncovered interest rate parity. In this case, the anticipated devaluation rate in a fluctuation
5 15 25 35 45 % 0 20 40 60 80 100 120 92:4 92:6 92:8 92:10 92:12 93:2 93:4 93:6 93:8 93:10 93:12 94:2 94:4 94:6 94:8 94:10 94:12 95:2
Portuguese interest rate Spanish interest rate 1st realign. ESP
2nd realign. ESP 1st realign. PTE
3rd realign. ESP
2nd realign. PTE 4th realign. ESP
3rd realign. PTE
Widening of the bands
PTE-DEM (right scale)
ESP-DEM (right scale)
band regime equals the difference between the interest rate differential and the currency’s depreciation within the band. This is a parametric method in the sense that the anticipated depreciation rate within the band is estimated rather than computed from the full width of the fluctuation band (as in the simple credibility tests – Svensson 1991b).
The expected devaluation rate can therefore be defined as follows:
gmt ¼dmt Et½Dxtþmjno realignment=m:dt ð1Þ
where:
gtmis the expected rate of devaluation (at periodt) of the central paritym
periods in advance (if it is positive a devaluation is expected); this is equal to the difference between the interest rate differential and the expected rate of depreciation within the band;
dmt ¼im
t itm is the interest rate differential (domestic rate – foreign
rate) at periodt, on bonds with maturitym;
xt5st–ctis the difference between the log of the market exchange rates
and the log of the bilateral central parity c;
m is the maturity measured in periods and dt is the length of the period;
Et½Dxtþmjno realignment=m:dt is the expected (at period t) depreciation
rate within the band, between periods tand (t1m), conditional upon the non-existence of a realignment andDxtþm¼xtþmxt.
The expected devaluation rate of the domestic currency (Escudo for Portugal and Peseta for Spain) in relation to the Deutschmark within a certain time horizon was calculated as the expected domestic rate of depreciation of the currency within the band, subtracted from the interest rate differential between each of the Iberian countries and Germany. The expected depreciation within the band was estimated by OLS using the following equation:
xtþmxt
ð Þ=m:dt¼X
j
b0jdjþb1xtþb2Dptem þb3Dmespþetþm ð2Þ
where:
dj: dummy variables, identifying each time period between two
realignments. We therefore allow for (and are able to test) different anticipated depreciation rates between realignments. If a coefficient is positive and significant, this means that, on average, the Escudo (Peseta) was a weak currency within the band during the period between the two realignments;
xt: as above, is the exchange rate within the band, and is frequently used
as the sole explanatory variable when explainingDxt1m. The coefficient of
pulling the exchange rate towards the central parity, i.e. the deviation of the exchange rate has a stabilizing effect;
DmpteandDmesprepresent the difference between the euro interest rates in
Portugal and Germany (Dmpte) and in Spain and Germany (Dmesp). The
use of Dmespallows us to test the influence of the stability of the Peseta
market on the Escudo market.
We wished to estimate the expected depreciation rate within the band, conditional upon information available at timetfor one, three and twelve-month horizons. Therefore, we consider m.dt equal to 1/12 year, 1/4 year and 1 year, respectively (this corresponds tomequal to 21, 64 and 254 daily observations anddtequal to 1/254). As we wished to calculate the expected depreciation rate within the band conditional upon no realignment between datestandt1m, therefore, for the 1-month horizon, we excluded from the sample the last 21 observations prior to each realignment. For the same reasons, we excluded from the sample 64 (254) observations prior to each realignment so as to estimate the expected depreciation rate within the band in the 3-month (12-month) horizon.
Exchange rate depreciation expectations were estimated by OLS. However, we computed standard errors using a Newey–West covariance estimator, allowing for both serial correlation and heteroscedasticity, since the dates overlap.
III. Data and Results
A. Data
The credibility of the Escudo exchange rate band in the EMS was empirically checked through the use of data covering the period from 14 April 1992, one week before the Escudo joined the European exchange rate mechanism, to 5 March 1995. During this period, the central parity of the Escudo against the Deutschmark was changed 3 times (involving three devaluations against the Deutschmark): on 23 November 1992 (6%), 14 May 1993 (6.5%) and 6 March 1995 (3.5%), which was practically the closing date of the series available to us.
The credibility tests were carried out using the official central parities of these currencies in relation to the Deutschmark as the standard reference. Our choice presupposed the recognition of the role of the Deutschmark as an anchor for the system. We used ECU spot exchange rates, which were recorded daily at a mid-morning central bank telephone conference.3 We therefore deduced the exchange rates of the Portuguese Escudo and the Peseta in relation to the Deutschmark. These exchange rates were compared with the official central parities of these currencies vis-a`-vis the Deutsch-mark, and with a variation range of76%, in spite of the widening of the official margins agreed to on 2 August 1993. Such a choice was justified by the fact that, after this date, the Escudo was kept within an implicit band, which corresponded to the earlier band of 12% (Abreu 1999a). As far as the Peseta was concerned, a similar phenomenon was to be noted until December 1994 (Cassola 1995; Dolado et al. 1992). After the crisis that occurred in the summer of 1993, the DEM–ESP exchange rate also seems to have been kept within an implicit band, corresponding to the ranges of variation authorized before the widening of the bands. However, from the beginning of December 1994 until the last realignment in March 1995, this exchange rate policy seems to have been abandoned, with the DEM–ESP parity exceeding the ceiling of 84 Pesetas per Deutschmark4on a continuous basis, despite the general increase in interest rates on the europeseta.
We used daily Portuguese, Spanish and Germany interest rates, for the period from 14 April 1992 to 5 March 1995. The interest rates used are annualized bid rates for 1-month, 3-month and 12-month euro-market deposits, recorded at 10 a.m. Swiss time.
B. Estimations of the Expected Rates of Depreciation Within the
Band
5The influence of monetary policy on expectations as regards the rate of depreciation of the Escudo
The assessment of the influence of interest rates on the expected rate of depreciation of the Escudo within the band can be considered as being a proxy for the effect of monetary policy on exchange rate expectations
3In comparison with the ‘official fixing’ dollar rates, the ecu-rates have the advantage of
being simultaneously recorded for the relevant currencies.
4The ceiling corresponds to the band of variation of76%.
5
(Svensson 1990; Moutot and Namur 1991).6 An effective Portuguese interest rate policy will be revealed by a positive b2 coefficient.
Likewise, the influence of Spanish monetary policy on the behaviour of the Portuguese exchange rate within the band will be revealed by a significant b3coefficient.
As far as the influence of interest rate differentials on the expected rate of depreciation of the Escudo is concerned, results in Table 1 seem rather disappointing. In fact, b2andb3are not significant for the one- and
three-month regressions, and only b3 is significant as regards the one-year
regression. For such a maturity,b3is, in fact, both negative and statistically
significant, while the Escudo–Deutschmark interest differential is negligible. The Peseta interest rate therefore seems to play a decisive guiding role, while the influence of the Escudo interest rate on the formation of expectations about the depreciation of the Escudo would seem to be negligible, both for this time period and for the 1- and 3-month horizons. The fact that b3is
negative suggests that an increase in the interest rate differential between the Peseta and the Deutschmark led to a reduction of the depreciation rate of the Escudo within the band. To put it more simply, an increase in Spanish rates (given German rates) reinforced the Escudo.
How can we interpret this set of results? Two possible explanations can be given:
1 Portuguese authorities were following the behaviour of their Spanish counterparts, who were pursuing an effective policy in terms of the exchange rate objective. While the rise in interest rates in Spain strengthened the Peseta (and this is confirmed by the negative sign of the coefficientb3estimated for the expected rate of depreciation of the
Peseta – Table 2), it also provoked an immediate increase in Portuguese interest rates, since the Portuguese authorities knew that otherwise their currency would be subject to an attack. Thus, an increase in Spanish interest rates would have the effect of restoring the equilibrium of the Escudo exchange rate within the band. An analysis of the correlation between the two series of interest rates, as well as a study of the possible relations of causality between the variations in
6In truth, it is not in fact monetary policy that is at stake here, but rather certain variables
interest rates, would help to clarify whether mimetic behaviour is likely to have occurred.
2 Statistical problems plague the results. It is possible to admit that the effectiveness of the Portuguese monetary policy as well as the Spanish influence may not always have had the same intensity, nor the same sign throughout the short period analysed, resulting in the inaccuracy of theb2andb3estimates.7On the other hand, it is also possible that Table 1: Exchange Rate Depreciation within the Band with Interest Rate Differentials as Independent Variablesw
DEM-PTE
1 month 3 months 1 year
d1:14/04/92 to 22/11/92 0.042 1.916
(0.003) (0.29) d2:23/11/92 to 12/05/93 7.483 2.633
(0.44) (0.28)
d3:13/05/93 to 05/03/95 11.203 12.814 6.050
(1.74) (2.097) (4.19)
b1 3.798 3.974 1.187
(2.05) (15.54) (42.83)
b2 0.752 0.286 0.079
(0.96) (0.58) (0.44)
b3 2.524 0.904 0.724
(1.37) (0.70) (4.21)
R-squared 0.27 0.86 0.99
N 669 547 208
Notes:ðxtþmxtÞ=mdt¼Pjb0jdjþb1xtþb2Dmpteþb3Dmespþetþm
w
OLS on equation (2) with Newey–West standard errors allowing for both serial correlation and heteroscedasticity. Regressand is (xt1m–xt)/mdt(% a year), withmdt521/254 for one month,
mdt564/254 for three months andmdt51 for one year (this corresponds tomequal to 21, 64 and 254 daily observations and dtequal to 1/254).djis a dummy variable for each period between
realignments. The first and second periods for the one year horizon are too short to be estimated.
Significant at the 1% level Significant at the 5% level Significant at the 10% level
t-stats shown in brackets
7As seen in Section II, in order to estimate the 1-year regression only the observations from
13 May 1993 (the date of the second realignment of the Escudo) to 5 March 1994 (one year before the third realignment of the Escudo) were kept. This shorter period of time corresponds to the longest sub period of Iberian exchange rate stability. This could explain the non-significant b2 and b3 in the one-month and three-month regressions and the
we have strongly correlated regressors due to the interdependent Iberian interest rates.
An understanding of the influence of interest rate differentials on the behaviour of the rate of depreciation of the Escudo within the band therefore requires the continuation of this study along two other tracks. On the one hand, possible changes in the sign and size of the coefficientsb2and
b3need to be looked for throughout the period of participation in the EMS.
From this perspective, new estimations were made of the rates of depreciation of the Escudo and Peseta, either by allowing the coefficients b2and b3to vary between sub-periods or by rearranging the sub-periods
and causing them to coincide with the different phases of credibility of the Escudo.
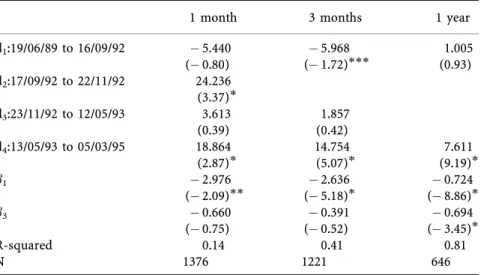
Table 2: Exchange Rate Depreciation Within the Band with Interest Rate Differentials as Independent Variablesw
DEM-ESP
1 month 3 months 1 year
d1:19/06/89 to 16/09/92 5.440 5.968 1.005
(0.80) (1.72) (0.93)
d2:17/09/92 to 22/11/92 24.236
(3.37)
d3:23/11/92 to 12/05/93 3.613 1.857
(0.39) (0.42)
d4:13/05/93 to 05/03/95 18.864 14.754 7.611
(2.87) (5.07) (9.19)
b1 2.976 2.636 0.724
(2.09) (5.18) (8.86)
b3 0.660 0.391 0.694
(0.75) (0.52) (3.45)
R-squared 0.14 0.41 0.81
N 1376 1221 646
Notes:ðxtþmxtÞ=mdt¼Pjb0jdjþb1xtþb3Dmespþetþm
w
OLS on equation (2) with Newey–West standard errors allowing for both serial correlation and heteroscedasticity. Regressand is (xt1m–xt)/mdt(% a year), withmdt521/254 for one month,
mdt564/254 for three months andmdt51 for one year (this corresponds tomequal to 21, 64 and 254 daily observations anddtequal to 1/254).djis a dummy variable for each period between
realignments. The second period for the three months horizon and the second and third periods for one year horizon are too short to be estimated.
Significant at the 1% level Significant at the 5% level Significant at the 10% level
On the other hand, possible relationships of interdependence need to be highlighted between the evolution of Spanish and Portuguese interest rates. In this sense, we need to analyse the correlation between the two series of interest rates and the variation of this correlation throughout the period, as well as the possible causality relation (in Granger’s sense) between the interest rate variations in the two countries.
In search of different characteristic periods marking the influence of interest rate differentials on the behaviour of the Escudo within the band
To test the influence of interest rate differentials on the behaviour of the Escudo within the band, the rate of depreciation of the Escudo was estimated for a one-month horizon, for each sub-period between realign-ments, using equation (3) below:
xtþ21xt
ð Þ=ð21=254Þ ¼b0þb1xtþb2Dmpteþb3Dmespþetþ21 ð3Þ
Results are presented in Table 3. Two initial statistical conclusions emerge from these results. First, the instability of the b2 coefficient is evident.
Second, the low model performance for the 14/04/1992–22/11/1992 sub-period: if one uses the conventional 5% significance level, the explanatory variables are useless. However, during the other two regimes, that is, between the first and the third Escudo realignments, the coefficientsb2and
b3 were both negative, suggesting that the increase in Spanish and
Portuguese interest rates strengthened the Escudo within the band. As far as the Portuguese rates were concerned, the differential with Germany (b2) was negative, as expected.8 This minus sign does in fact
confirm the relationship between the interest rate differential and the exchange rate predicted by the model of target zones, whenever the exchange rate band is credible: in this case, an increase in the differential (i.e. an increase in domestic interest rates) strengthens the currency within the band. In our opinion, the minus sign confirms that the management of interest rates in Portugal has been largely governed by the objective of
8Given that we have eliminated the observations preceding a realignment over a period that
was shorter than the horizon considered for the estimated depreciation rate, the information relating to the periods when attacks against the Escudo were not successfully counteracted by the monetary authorities was also eliminated (otherwise the realignment shouldn’t have happened). This means that, very probably, we have underestimated the possible existence of a positive relationship between the interest rate differential in relation to Germany and the expected Escudo depreciation rate. In other words, we have over-estimated the efficiency of the interest rate policy. It is therefore normal to obtain a negativeb2coefficient for the full
exchange rate stabilization and that, most of the time, this policy has proved to be effective.
As far as the influence of Spanish interest rates on the Escudo is concerned, the hypothesis that the Peseta has an influence on the Escudo cannot be rejected, at least for the period from November 1992 to May 1993 and the 10% significance level.
Thus, when taken together, the coefficientsb2andb3seem to support, for
the one-month time horizon, in the second and third sub-periods, the results that were obtained with the estimation of the rate of depreciation of the Escudo for a one-year horizon (Table 1). The credibility of the Escudo fluctuation band was guaranteed by the rise in Portuguese and Spanish interest rates. The rise in Spanish rates probably operated (or was perceived by Portuguese authorities) as a constraint on monetary policy in Portugal. Nevertheless, we cannot be satisfied with these results. In fact, given the aforementionedb2parameter instability and the irrelevance of the first
sub-period regression, we must be somewhat guarded about the conclusions put forward.
As a result, the question arose as to whether the breakdown into sub-periods marked by the occurrence of a realignment was in fact the best way to understand the possible changes in the influences of interest rate differentials on the depreciation rate of the Escudo. In fact, the realignments
Table 3: Exchange Rate Depreciation Within the Band for Each Period between Realignments (One Month Horizon)w
DEM-PTE
14/04/92 to 22/11/92 23/11/92 to 12/05/93 13/05/93 to 05/03/95
b0 1.381 25.432 34.930
b1 1.528 1.642 4.919
(1.61) (2.60) (14.08)
b2 1.239 1.490 2.240
(1.729) (4.618) (5.27)
b3 0.217 1.187 1.54
(0.12) (1.68) (1.43)
R-squared 0.04 0.29 0.40
N 135 100 441
Notes:ðxtþ21xtÞ=ð21=254Þ ¼b0þb1xtþb2Dmpteþb3Dmespþetþ21
w
OLS with Newey–West standard errors allowing for both serial correlation and heteroscedasticity. Regressand is (xt121–xt)/mdt(% a year), withmdt521/254 corresponding to one month.
Significant at the 1% level Significant at the 5% level Significant at the 10% level
do not seem to mark any significant changes in the evolution of the Escudo within the band. Using ‘simple’ credibility tests,9 Abreu (1999a) drew conclusions as regards the relevance of three other sub-periods. The first one, from the date when the Escudo joined the ERM to August 1992, was characterized by strong and stable credibility; the second, between September 1992 and July 1993, was marked by a growing nervousness in the markets (increased volatility), with credibility being restored in leaps and bounds and only temporarily after each realignment; the third period, between July 1993 and March 1995, was marked by an extreme lack of credibility of the Escudo band, which was much greater than that of the Peseta.
We therefore re-estimated the depreciation rate of the Escudo and the Peseta within the band, for all time horizons, in keeping with equation (2), this time taking into consideration the sub-periods from Abreu (1999a). We also re-estimated the rate of depreciation of the Escudo, for the time horizon of one month, separately for each sub-period between realignments, in keeping with equation (3). The results of these estimations are shown in Tables 4, 5 and 6. Results in Table 4 show remarkable differences with regard to the identification of regimes. The coefficientb03is now significant for all time horizons, andb02is significant for the 3-month horizon. On the other hand,
by taking these periods into account, we were able to identify more clearly the influence that, as a whole, pressures exerted on the Peseta have on the behaviour of the Escudo within the band. Theb3coefficient for the Escudo is
negative and statistically significant for time horizons of 3 months and one year. It therefore seems possible to confirm the hypothesis of a contagion effect of the Peseta on the Escudo for these horizons. The Spanish authorities increased their interest rates to strengthen the Peseta, an action in which they were successful (forb3is also negative for the Peseta, Table 5),
and the Portuguese authorities accompanied them in order to prevent the Escudo from being attacked, with equal success. Table 6 allows us to determine the variation, between the different sub-periods, in the influence of interest rates on the expected Escudo depreciation rate for one month. The coefficients b2 and b3 are significant for the first two sub-periods.10 Until August 1992,b2was negative whileb3was positive. This combination
represents,a priori, a competitive relationship between the two currencies: an increase in Portuguese interest rates strengthens the Escudo, while Spanish
9
In the ‘simple test’, the devaluation expectation is computed by adjusting interest rate differentials for the maximum and minimum rates of possible currency depreciation within the band. This method has the advantage of taking into account all the observations, but, on the other hand, the corresponding test of credibility of the exchange rate band is frequently inconclusive.
10
rates exert pressure in the opposite direction. A rise in interest rates in the neighbouring country would expose Portugal to an outflow of capital that would accentuate the depreciation of the Escudo. Between August 1992 and July 1993, b2and b3were both negative. We therefore find once again the situation envisaged by the hypothesis of a credible band guaranteed by an effective monetary policy which closely follows what is happening in Spain.
In the third sub-period, after August 1993,b2andb3were not statistically
significant.
Brief assessment of the correlation between Portuguese and Spanish interest rates and search for causalities
An assessment of the correlation, as well as possible relationships of causality, between Portuguese and Spanish interest rates, would seem indispensable for the interpretation of the aforementioned results.
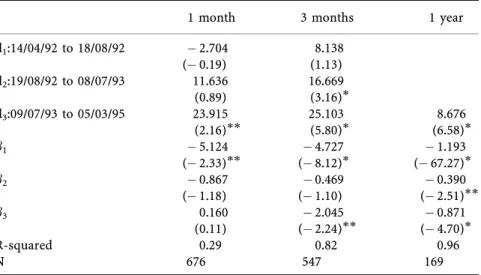
Table 4: Exchange Rate Depreciation Within the Band using a ‘Dummy’ for Each Regimew
DEM-PTE
1 month 3 months 1 year
d1:14/04/92 to 18/08/92 2.704 8.138
(0.19) (1.13) d2:19/08/92 to 08/07/93 11.636 16.669
(0.89) (3.16)
d3:09/07/93 to 05/03/95 23.915 25.103 8.676
(2.16) (5.80) (6.58)
b1 5.124 4.727 1.193
(2.33) (8.12) (67.27)
b2 0.867 0.469 0.390
(1.18) (1.10) (2.51)
b3 0.160 2.045 0.871
(0.11) (2.24) (4.70)
R-squared 0.29 0.82 0.96
N 676 547 169
Notes:ðxtþmxtÞ=mdt¼Pjb0jdjþb1xtþb2Dmpteþb3Dmespþetþm
w
OLS on equation (2) with Newey–West standard errors allowing for both serial correlation and heteroscedasticity. Regressand is (xt1m–xt)/mdt(% a year), withmdt521/254 for one month,
mdt564/254 for three months andmdt51 for one year (this corresponds tomequal to about 21, 64 and 254 daily observations anddtequal to 1/254).dj is a dummy variable for each period
between realignments. The first and second periods for one year horizon are too short to be estimated.
Significant at the 1% level Significant at the 5% level Significant at the 10% level
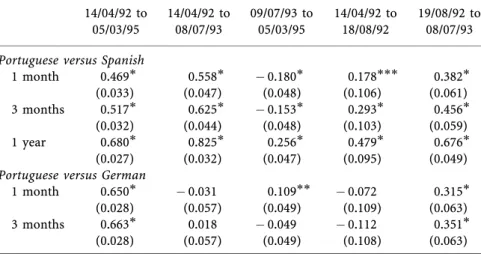
By observing the coefficients of correlation between the Portuguese and Spanish interest rates presented in Table 7, the following may be concluded:
1 That there is an important positive correlation between Portuguese and Spanish interest rates throughout the whole period of the Escudo’s participation in the ERM;
2 That this link is stronger whenever the maturity of the rates is longer; 3 That the strength of this link seems to vary greatly throughout the period of the Escudo’s participation in the ERM. After being very strong until July 1993, it diminished thereafter, to the point of becoming negative for time horizons of one month and three months.
The results referred to above attest that there is a strong interdependence11 between Portuguese and Spanish interest rates, and that this actually
Table 5: Exchange Rate Depreciation Within the Band taking a ‘Dummy’ for Each Regimew
DEM-ESP
1 month 3 months 1 year
d1:19/06/89 to 18/08/92 3.636 5.126 0.973
(0.63) (1.26) (0.80)
d2:19/08/92 to 08/07/93 11.43 7.933
(1.34) (1.52)
d3:09/07/93 to 05/03/95 18.708 16.048 7.642
(2.87) (4.82) (8.75)
b1 2.715 2.768 0.730
(2.19) (4.08) (6.27)
b3 0.867 0.658 0.692
(0.93) (0.83) (3.34)
R-squared 0.12 0.37 0.74
N 1376 1221 607
Notes:ðxtþmxtÞ=mdt¼Pjb0jdjþb1xtþb3Dmespþetþm
w
OLS on equation (2) with Newey–West standard errors allowing for both serial correlation and heteroscedasticity. Regressand is (xt1m–xt)/mdt(% a year), withmdt521/254 for one month,
mdt564/254 for three months andmdt51 for one year (this corresponds tomequal to about 21, 64 and 254 daily observations anddtequal to 1/254).djis a dummy variable for each period
between realignments. The second period for the one year horizon is too short to be estimated.
Significant at the 1% level Significant at the 5% level Significant at the 10% level
t-stats shown in brackets
11
Table 6: Exchange Rate Depreciation within the Band for each ‘Regime’ (One Month Horizon)w
DEM-PTE
14/04/92 to 18/08/92 19/08/92 to 08/07/93 09/07/93 to 05/03/95
b0 177.501 38.347 38.115
b1 11.378 1.566 10.120
(8.16) (2.29) (23.94)
b2 1.373 1.824 0.251
(1.72) (3.36) (0.91)
b3 57.587 2.565 0.099
(14.42) (2.97) (0.15)
R-squared 0.76 0.23 0.63
N 88 186 402
Notes:ðxtþ21xtÞ=ð21=254Þ ¼b0þb1xtþb2D21pteþb3D21espþetþ21
w
OLS with Newey–West standard errors allowing for both serial correlation and heteroscedasticity. Regressand is (xt121–xt)/mdt(% a year), withmdt521/254 corresponding to one month.
Significant at the 1% level Significant at the 5% level Significant at the 10% level
t-stats shown in brackets
Table 7: Pearson Correlation Coefficient between the Portuguese and Spanish/German Interest Rates on the Euromarket
14/04/92 to 05/03/95
14/04/92 to 08/07/93
09/07/93 to 05/03/95
14/04/92 to 18/08/92
19/08/92 to 08/07/93
Portuguese versus Spanish
1 month 0.469 0.558 0.180 0.178 0.382
(0.033) (0.047) (0.048) (0.106) (0.061) 3 months 0.517 0.625 0.153 0.293 0.456
(0.032) (0.044) (0.048) (0.103) (0.059) 1 year 0.680 0.825 0.256 0.479 0.676
(0.027) (0.032) (0.047) (0.095) (0.049)
Portuguese versus German
1 month 0.650 0.031 0.109 0.072 0.315
(0.028) (0.057) (0.049) (0.109) (0.063) 3 months 0.663 0.018 0.049 0.112 0.351
(0.028) (0.057) (0.049) (0.108) (0.063)
Notes: Interest rates are daily observations on annualized bid rates on euromarket deposits in escudos and in pesetas. Standard deviations shown in brackets.
increased after the 1992 crises. This interdependence remained positive until the widening of the bands in 1993, a period in which both the Peseta and the Escudo were under pressure. After July 1993, the correlation becomes negative, in a period when only the Portuguese Escudo was under attack.
The interdependence between Escudo and Peseta interest rates can be refined by using econometric techniques that look for causal relations. It is important to stress that the causality established in this way does not necessarily reflect the underlying existence of a fundamental economic law. The econometric causality that links two variables together simply indicates that knowledge of past values of one variable improves prediction (‘cause’) with regard to the other.
The results of the causality tests applied to the period from 6 April 1992 to 7 March 1995 are shown in Table 8. These results suggest that there is a relationship of instantaneous causality, in one direction only, from the Peseta to the Escudo, after the Escudo’s integration into the exchange rate mechanism. No other relationship of causality can be confirmed, either in the same direction (but nonetheless considering past values), or in the opposite direction (from the Escudo to the Peseta).
C. Principal Conclusions on the Rate of Depreciation of the Escudo
within the Band
With regard to the influence exercised by interest rate differentials, and therefore by monetary policy, on the expected rate of depreciation of the
Table 8: Granger Causality between Portuguese and Spanish Interest Rates – One Month Horizon
Equationz Equation§ Equationz
Spain c Portugal8
F-stat. 1.715 1.043 1.864
(probability) (0.126) (0.418) (0.046)
Portugal c Spain
F-stat. 3.388 2.531 3.387
(probability) (0.004) (0.007) (0.003)
w
We use the Sargent’s Tests to evaluate Granger causality. The following equations were estimated: z
Yt¼a0þ
Pn
i¼1aiYtiþetwithEðetÞ ¼0;Eðet;et1Þ ¼0. §
Yt¼a0þPni¼1aiYtiþPni¼11þbiXtiþetwithEðetÞ ¼0;Eðet;et1Þ ¼0.
z
Yt¼a0þPni¼1aiYtiþPni¼10þbiXtiþetwithEðetÞ ¼0;Eðet;et1Þ ¼0.
8
‘Spainc Portugal’ means that Spanish interest rates Granger-cause Portuguese ones. Tests have been applied to interest rate monthly average changes between 6/4/92 and 7/3/95. Interest rates are daily observations on annualized bid rates for 1-month euromarket deposits.
Escudo within the band, the principal results obtained allow us to deduce that the influence of the variation in (Portuguese and Spanish) interest rates on the position of the Escudo within the band did not have the same sign throughout the EMS period. In fact, for the time horizon of one month, results in Tables 1 and 4 show no significant b2 and b3 values, if one
considers these coefficients fixed for the entire EMS period.
For the one-month horizon, statistically significant coefficients of interest rate differentials were only obtained in the case of separate estimations of the depreciation rate within each sub-period. Results in Table 6 lead us to conclude that:
1 From April 1992, when the Escudo joined the ERM until the summer of 1993, Portuguese monetary policy could be regarded as successful (in relation to the exchange rate objective); the increase in domestic interest rates making it possible to strengthen the Escudo. In fact, the b2 coefficient, which expresses the efficiency of monetary policy in
relation to the exchange rate objective, is negative during this period.12 2 During a very short period only (between April and August 1992), the negativeb2coefficient13is linked to a positiveb3. This situation would
seem to indicate that during the first months of the Escudo’s participation in the ERM, monetary policy was effective and not constrained by the behaviour of the Spanish monetary authorities, with the relationship between the currencies demonstrating the typical features of a competitive relationship.
3 Between August 1992 and July 1993, both b2andb3are negative and
significant. It would therefore seem that, during this phase, monetary policy continued to show a tendency to be effective in Portugal (since the increase in Portuguese rates reduced expectations of a depreciation of the Escudo), although it was nonetheless largely determined by the behaviour of the Spanish authorities. A rise in interest rates in Spain (in view of the strengthening of the Peseta) was quickly followed by Portuguese authorities, who thus prevented the Escudo from being attacked. A study of the interdependence between the interest rates of the two countries seems to support this interpretation. In fact, we found a strong correlation between the interest rates of the two countries during this period. Furthermore, the instantaneous causality noted from the Peseta interest rates to those of the Escudo also seems to confirm this idea.
12This apparent efficiency of monetary policy does, however, need to be viewed with a
certain amount of reservation, since we have eliminated the observations preceding a realignment.
13
4 In the first two periods, in which the coefficients were seen to be significant,14 the coefficient associated with Spanish interest rates was always stronger, which would seem to account for the intensity of the exchange rate constraint exerted by Spain.
5 After July 1993, it is not possible to make any judgement; either about the influence of Portuguese interest rates or the influence of Spanish rates on the behaviour of the Escudo within the band, since neitherb2
norb3is significant. As far as Portuguese interest rates are concerned,
this fact seems to demonstrate a tendency towards a reduction in the efficiency of the interest rate policy. In the case of the Spanish influence, the fact thatb3is not statistically significant confirms that there was no real symbiosis in the behaviour of the exchange rates of the two currencies. In this phase, and unlike the earlier ones, the Peseta was not under attack (the Peseta was simply hovering close to the band’s ceiling of 6% throughout most of this period); it was the Escudo that was constantly subject to tensions in the foreign exchange market. The results forb3in this period, coupled with the results obtained for
previous periods, seem to suggest the existence of a one-way transfer of the weakness of the Peseta onto that of the Escudo. The recursive estimation ofb3(results not shown) seems to confirm this hypothesis,
namely that the influence of the Peseta on the Escudo was exerted at moments when the Peseta was ‘weak’, and not throughout each sub-period analysed here.
D. Estimations of the Expected Rate of Devaluation
The expected rate of devaluation of the Escudo and the Peseta in relation to the Deutschmark is obtained by deducting the expected rate of depreciation within the band from the interest rate differential on the euromarket between the currency of the country being considered and that of Germany, in keeping with equation (1).
On the one hand, the longer the horizon of expectation, the higher the expected rate of devaluation, which is natural given that a realignment is all the more likely to occur when the time period considered is longer. On the other hand, the shorter the horizon of expectation, the higher the volatility of the expected rate of devaluation, which is explained by the relatively high volatility of short rates in comparison with long rates.
14
Let us now focus on the shortest horizon: one month. Figure 2 retraces the evolution of the expected rate of devaluation (by time unit) of the Escudo and the Peseta against the Deutschmark for the time horizon of one month. The estimations chosen for the depreciation rate are those shown in Tables 1 and 2.15
Three sub-periods can be clearly identified.
1 The first of these sub-periods, April to August 1992, is marked by a weak volatility of the devaluation rate. On the other hand, the devaluation rate, which is negative throughout the sub-period, expresses a strong level of credibility in regard to the exchange rate band. This credibility of the Escudo exchange rate band was only to be
-60 -40 -20 0 20 40 60
92:4
92:6 92:892:1092:12 93:2 93:4
93:6 93:893:10 93:12
94:2 94:4
94:6 94:894:1094:12 95:2
ESP against DEM PTE against DEM 1st realign. ESP 2nd realign. ESP
1st realign. PTE
3rd realign. ESP 2nd realign. PTE
4th realign. ESP 3rd realign. PTE
Widening of the bands
Figure 2:Expected rate of devaluation for the time horizon of one month
15This choice arises from the fact that the estimation of equation (2) displays better quality
than that centred exclusively on the differential between the exchange rate and the central parity (xt). Opting for sub-periods between realignmentsvis-a`-vis‘regimes’ allows us, first of
seen again in a somewhat temporary fashion after the realignment of May 1993.
2 After August 1992, this state of grace enjoyed by the Escudo came to a sudden end. During this second sub-period, between August 1992 and July 1993, phases of credibility followed on from periods when a realignment was seen as imminent, i.e. phases in which the only common feature was an enormous volatility of the expected rate of devaluation. The devaluation of November 1992 brought little more than a temporary respite, for the rate of devaluation only briefly remained below zero. After the realignment, the rate of devaluation shot upwards again, becoming positive after March 1993. Credibility was once more temporarily restored for a brief two-month period after the realignment of May 1993.
3 Finally, in the third sub-period, between July 1993 and the realignment in March 1995, there was an almost continuous expectation of a devaluation of the Escudo, while, at the same time, its volatility was reduced. During this long period of roughly 20 months, two crises in the credibility of the Escudo can be distinguished: the first one in October 1993, the other in June 1994.
An analysis of Figure 2 allows us to compare the evolution of the expected rates of devaluation of the Escudo and the Peseta. There are several points that should be pointed out here:
1 It clearly seems that the credibility of the bands of the two currencies evolved in a practically concerted fashion following the second realignment of the Peseta (first of the Escudo) and until the widening of the bands, in August 1993. Thereafter, their evolutions diverged quite dramatically.
2 The moments of greatest weakness of the Peseta led almost system-atically to a realignment of parities, which therefore brought with them a devaluation of the Escudo. The only exception was the realignment of September 1992, after which expectations of a devaluation of the Escudo remained very high.
IV. Conclusion
The preceding analysis shows that the participation of the Escudo in the ERM was marked by a repeated lack of credibility after the autumn of 1992. In particular, the 76% Escudo exchange rate band, which had been implicitly defended by the Portuguese monetary authorities since August 1993, showed itself to be continuously lacking in credibility.
There are some fundamental reasons which justify the speculative attacks suffered by the Portuguese currency in 1992, particularly the over-appreciation of the Escudo real exchange rate which accumulated from the second half of the 1980s (Abreu 1999b; Kempa and Nelles 1999; Williamson 2000a). What is more difficult to understand is why the Escudo continued to be under pressure until March 1995, once this real over-appreciation had been absorbed by the first two realignments.
A credible explanation for this behaviour is suggested by the strong link noted between the Escudo and the Peseta. Yet, as we have seen, this was not a marriage of the ‘for better or worse’ type. The Escudo seems to have followed the Peseta when the expected rate of devaluation of the latter moved upwards, but it did not, however, pull the Peseta down with it in its moments of ‘weakness’, nor did it benefit from mirroring the Peseta in its periods of greater vigour. In other words, it seems that the credibility of the Peseta was not a sufficient condition, but was instead a necessary condition, for the credibility of the Escudo.
As Eichengreen et al. (1997) have clearly pointed out, we speak of contagion in foreign exchange markets when there exists a systematic effect on the probability of a speculative attack which stems from attacks on other currencies, and is therefore an additional effect above and beyond those of domestic ‘fundamentals’.
In the Portuguese and Spanish case, this spillover seems to be well explained by the anticipated mimetic behaviour of the Portuguese monetary authorities vis a` vis the Spanish monetary authorities. We evaluate this phenomenon as a particular case of the escape clause approach to new models of currency crises.
What would seem to be particular to the Portuguese case is that market expectations of the monetary authorities’ evaluation of benefits and costs depend mostly on the behaviour of Spanish monetary authorities in response to a speculative attack. If Spanish authorities respond to an attack with a devaluation of the Peseta, it is supposed that this will sharply increase the cost of the prevailing exchange rate policy in Portugal. A devaluation of the Peseta thus leads investors to revise their beliefs in the continuity of the Portuguese commitment to the exchange rate system.
Margarida Abreu
Departamento de Economia
Instituto Superior de Economia e Gesta˜o - U.T.L. Rua Miguel Lupi, 20,
1200-725 Lisboa, Portugal
Mabreu@iseg.utl.pt
References
Abreu, Margarida (1999a), ‘As Crises Cambiais do Escudo entre 1992 e 1995’,
Boletim de Cieˆncias Econo´micasde Coimbra.
Abreu, Margarida (1999b), ‘Exchange Rate Market Tensions in a Small Open Economy during the Transition to EMU: Can Asian Countries Learn from the Portuguese Experience en 1992–1995’, Instituto Superior de Economia e Gesta˜o, Economics Department Working Paper, WP7/1999/DE/CISEP, ISSN 0874-4548.
Abreu, Margarida, and Laurence Scialom (2000), ‘Prudential Policy and Exchange Rate Regime: The Lessons of the Asian Crisis’, in M. Abreu and V. Mendes (eds),
What Financial System for the Year 2000?Lisboa: Bolsa de Valores de Lisboa e Porto, 81–108.
Bartolini, Leonardo, and Alessandro Prati (1999), ‘Soft Exchange Rate Bands and Speculative Attacks: Theory and Evidence from the ERM since August 1993’,
Journal of International Economics, 49, 1–29.
Bertola, G., and R. Caballero (1990), ‘Target Zones and Realignments’, CEPR Discussion Paper No. 398, March.
Calvo, Guillermo (1996), ‘Capital Flows and Economic Management’, Federal Reserve Bank of San Francisco Working Paper in Applied Economic Theory No. 96–02
Caramazza, Francesco, Luca Ricci and Ranil Salgado (2000), ‘Trade and Financial Contagion in Currency Crises’, IMF Working Paper No. 00/55, March.
Cassola, N. (1995), ‘Indicadores de Credibilidade de um Regime Cambial: os casos do Escudo e da Peseta no Sistema Moneta´rio Europeu’, Bank of Portugal, Research Department, February.
Dolado, J. J., J. A. Ayuso and S. Sosvilla-Rivero (1992), ‘Efficiency in the Peseta Forward Exchange Rate Market’, CEPR Discussion Paper No. 627, February.
Eichengreen, Barry, and C. Wyplosz (1993), ‘The Unstable EMS’, INSEAD Working paper 93/38/EPS, Fontainebleau, France.
Eichengreen, Barry, A. Rose and C. Wyplosz (1997), ‘Contagious Currency Crises’,
Scandinavian Economic Review, 98, 4.
Favero, Carlo A., and Francesco Giavazzi (2000), ‘Looking for Contagion: Evidence From the ERM’, CEPR Discussion Paper No. 2591, October.
Forbes, K., and R. Rigobon (1999), ‘No Contagion, Only Interdependence: Measuring Stock Market Co-Movements’, NBER Working Paper No. 7267.
Glick, Reuven, and Andrew Rose (1999), ‘Contagion and Trade: Why are Currency Crises Regional?’,Journal of International Money and Finance, 4(18), 603–17. Goldstein, Morris, Graciela Kaminsky and Carmen Reinhart (2000), Assessing Financial Vulnerability: An Early Warning System for Emerging Markets. Washington: Institute for International Economics.
Go´mez-Puig, Marta, and Jose´ G. Montalvo (1997), ‘A New Indicator to Assess the Credibility of the EMS’,European Economic Review, 41, 1511–35.
Isard, P. (1995),Exchange Rate Economics. Cambridge, UK: Cambridge University Press.
Jeanne, Olivier (1999), ‘Currency Crises: A Perspective on Recent Theoretical Developments’, CEPR Discussion Paper No. 2170, June.
Kaminsky, Graciela (1998), ‘Currency and Banking Crises: The Early Warnings of Distress’, Board of Governors of the Federal Reserve System, International Finance Discussion Paper No. 629, October.
Kempa, Bernd, and Michael Nelles (1999), ‘Misalignments and Real Exchange Rates and the Credibility of Nominal Currency Bands’,Weltwirtschaftliches Archiv, 135(4), 613–27.
Kodres, Laura, and Matthew Pritsker (1998), ‘A Rational Expectation Model of Financial Contagion’, Board of Governors of the Federal Reserve System, Finance and Economic Discussion Paper No. 1998-48, December.
Peria, Maria Soledad Martinez (1999), ‘A Regime Switching Approach to Studying Speculative Attacks: A Focus on Monetary System Crises’, World Bank Policy Research Working Paper No. 2132, June.
Rose, A. K., and L. Svensson (1991), ‘Expected and Predicted Realignments: The FF/DM Exchange Rate during the EMS’, Institute for International Economic Studies Seminar Paper No. 485. Stockholm.
Sutherland, A. (1995), ‘Currency Crisis Models: Bridging the Gap between Old and New Approaches’, in C. Bordes, E. Girardin and J. Melitz (eds),European Currency Crises and After, Manchester: Manchester University Press, 57–81.
Svensson, L. (1990), ‘The Term Structure of Interest Rates Differentials in a Target Zone: Theory and Swedish Data’, NBER Working Paper No. 3374.
Svensson, L. (1991a), ‘Assessing Target Zone Credibility: Mean Reversion and Devaluation Expectations in the EMS’, CEPR Discussion Paper No. 580, September.
Svensson, L. (1991b), ‘The Simplest Test of Target Zone Credibility’, CEPR Discussion Paper No. 493, January.
Williamson, John (2000a), ‘Capital Mobility, Contagion, and Crises’, in M. Abreu and V. Mendes (eds)What Financial System for the Year 2000?, Lisboa: Bolsa de Valores de Lisboa e Porto, 219–27.