Estudos de Economia, vol. 1v, n. • 3, Abr.·Jun. 1984
THE EFFECT OF HOUSING ON SOCIAL INEQUALITY:
HUNGARIAN EXPERIENCES(*)
Zsuzsa
Daniel(**)
1 - Introduction: oo the Hlllgllrian housilg situation IIIII housilg poicy
As regards development level, Hungary is situated in the European medium zone. According to preliminary data of the 1980 population census, Hungary's population is 10.7 million, the housing stock is 3.5 million dwellings. 28 per cent of the dwellings have one (living) room, 48 per cent two rooms
and the share of dwellings with 3 and more rooms is merely 24 per cent.
More than one third of the dwellings are without any conveniences, the average density being rather high: there are 157 people for 100 rooms. The country had to cope with a shortage of flats already prior to World
War II. During the war more than 20 per cent of the housing stock was
annihiated or gravely damaged, thus war losses and the urbanization processes which accelerated after 1945 further aggravated the already existing housing shortage.
Housing policy after 1945 strove essentially after restoration of the damaged dwellings and after redistribution of the existing stock. Redistribution meant the allocation of dwellings having become vacant in the course of the war and the division of dwellings of families living under better than average conditions in favour of those having lost theirs in the war or of families living under very bad conditions as well as in favour of the members of the newly
established state machinery (1).
The stabilization of 1948 following an unprecedented inflation regulated housing rents anew- while maintaining the control of dwellings. In 1951 the tenement houses which had been privately owned were nationalized and only the family homes and dwellings used by the owner remained in private ownership.
Official housing policy regarded the state's responsibility to take care of the supply of dwellings. Up to the mid-fifties, however, it practically financed only the housing construction related to major industrial investment projects.
(*) Conferencia proferida no Institute Superior de Economia em Junho de 1982. (**) Institute of Planning, Budapest.
(1) The historical antecedents of the Hungarian housing shortage are analysed by Mihalyi (1977).
A change occurred after 1957. The rate of urban housing construction by the state accelerated, particularly in the capital, and gradually private construction also gained ground, that is the building of family homes, cooperative flats and owner-occupied flats. While in 1950 the number of flats built per 1000 inhabitants was 3.8, in 1960 it reached 6.6 and by 1980 8.2. The main characteristics of the present Hungarian housing sector are the following:
Tenement houses with a large number of dwellings are usually state-owned, they are maintained by enterprises under the control of local councils. Rents are centrally fixed, and at a very low level. Rationing of state-owned flats is effected by local councils. Such rationed dwellings are given only to those entitled to them according to certain priority rules based on such criteria as need, merit, (low) social status, queuing time, etc.
Another prevalent form of ownership is the privately owned dwellings. In a typical case the dwelling is a single-family house inhabited by the owner and his family. Apart from a few administrative restraints, such a house can be sold on a free market at a free price. One version of this form of ownership is the condominium: a house consisting of several dwellings each of which is privately owned while the collectively used parts of the building are common property.
It is possible to sublet privately owned dwellings but only under strict limitations. The most important limitation is that a tenement house consisting of many dwellings cannot be private property.
The building costs of family houses and of condominium are extremely high, particularly as compared to the wages in the formal sector (i.e. the legally accepted sector of the economy). Bank credits advance only a small portion of the costs. Therefore, the family house or condominium dwelling sells at a very high price on the free market. Calculating the imputed monthly rent of a such a privately owned dwelling and comparing it with the rent of a state flat of a similar quality, one finds that the former may be eight to ten times higher than the latter. This makes it clear that under such circumstances a
«grey market» exists in a wide sphere. The tenancy right of state~owned flats
is sold, or rather played into the hands of the «buyers», at high prices. There is no chronic intensive shortage on the market of privately owned houses and dwellings and of private tenements. Solvent demand is sooner or later satisfied at the high prices that are developing. However, the market is functioning with a lot of friction, it is confused and badly organized. Therefore, quite a long search time may be needed until seller and buyer can meet.
There is also a co-operative form of building large blocks of dwellings This is a special form mainly in respect of the organization of the construction 322
·work, the selection of membership, and financing; after moving in, the ownership is similar to that of condominium dwellings.
As for quantitative proportions: in towns, and especially in the capital, the prevailing form is the state-owned flat although there are (primarily in the suburbs) quite a number of privately owned dwellings. In the countryside, especially in villages, the single-family house occupied by the owner is the dominant form. According to census data 7 4.5 per cent of housing stock is privately owned at present, and 25.5 per cent is owned by the state. The ratio of publicly owned dwellings is close to 60 per cent in Budapest.
In spite of the accelerating public residential construction the supply of flats to be let could not keep pace with the demand for the almost freely
distributed flats rented for an almost nominal rent (2). The average waiting
time of 8-10 years hardly diminished even in these years. Although the share
of private residential construction increased, this mode of building - because
of moderate state subsidies and quickly rising building costs - involved a
very great burden for the households concerned.
By the end of the sixties the double allocation of dwellings (state-owned rented flats through administrative allocation and privately owned dwellings through market turnover) developed and became further polarized in the
seventies. It could not eliminate the shortage while it became a source of
new social tensions. The housing situation, the way of obtaining a flat became one of the most important differentiating factors of society. My study examines this differentiating effect.
2 - The redistributive effect of the subsidy
m
tenement flats (3)Those who live today in a state-owned flat and particularly those living in a tenement flat of high quality are given, indirectly, a considerable sum of state subsidy. The rent does not cover the simple reproduction costs of the flats, and not even the costs of repair and maintenance. The state budget largely subsidies the smooth functioning of the housing sector and finances the building of tenement flats.
In what follows, the question will be examined, what extent of state subsidy is received by the households living in tenement flats at today's nominal rent level.
(2) Analysis of the shortage phenomenon is given in Kornai (1980}.
(3) This study is a partial product of a research project pursued through several years. In the computations G. Spiegel and F. Thar from the Computer Centre of the National Planning Office participated. Their help is gratefully acknowledged.
Two versions are going to be analysed, based upon hypothetical computations:
Version 1. - The rent level is settled as if the housing sector
were a non-profit, non-taxable sector. This would necessitate an
average 4.8-fo/d rise in rents, in a zone between 2.2 and 5.4 depending on the quality of the flat.
Version 2. - The housing sector is considered to be a <<regular business sector» (profit plus tax); accordingly, rents should be raised, on average, up to 5.5-fold of the present ones, in a zone between
6.0 and 2.8 depending on the quality of the flat.
Using data of the 1976 household budget statistics we have calculated the rent which would be paid by households living in tenement flats, if the rent level developed according to Versions 1 and 2. The difference between the rents calculated and those actually paid wulli represent the indirect subsidy
obtained - in the course of redistribution - by the households living in
tenement flats.
These households spend, on average, 3.7 per cent of their per capita income on rent, this low rent level being possible through the subsidy of the housing sector. Computation according to Version 1 and Version 2 shows that those living in a tenement flat in Hungary today obtain, as a consequence
of low rents, an indirect subsidy of 14.5 to 16.5 per cent of their income.
Let us now examine the amount of subsidy received by the households living in tenement flats, grouped according to income. Since both versions of rent points to the same tendencies, further analysis will be based solely on Version 1.
Data of table 1 convince that it is not the households of low income, large families, and bad housing conditions that are favourably affected by redistribution. In the two lower income categories corresponding to 14 per cent of the households, in which three persons live in a room and the quality of the dwellings is very poor, the subsidy is of 11.5 per cent which remains below the 14.5 per cent received by the average of those living in tenement
flats. On the other hand, families with high income - including the two higher
income categories constituting 8 per cent of the households - enjoy a subsidy
of 13 to 15 per cent of their income in addition to their good housing
conditions - in respect of the average number of rooms and quality of the
flat.
It is worth having a look at the last but one column showing the absolute amount of the subsidy. It grows monotonously as a function of income. Even if the first and the last figures are disregarded (figures in the extreme zones are usually uncertain), the gap is very wide. The family with a per capita income of Ft 45 to 55 thousand receives three and a half times the subsidy of a family of the 12,000-16,800 Ft per capita income group.
TABLE 1
Extent of subsidy according to income categories
Income group: Average quality Yearly subsidy Subsidy
yearly per capita income Average number (number Yearly rent according in percentage (forint/head) of children of rooms (forint/head) to Version 1 of income
per head) (forint/head)
12,000 ... 2.5 0.62 308 945 9.6 12,001-16,800 ... 1.8 1.00 594 2.045 13.7 16,801-21,600 ... .... 1.3 1.30 781 2.922 15.2 21,601-24,000 ... 1.1 1.45 930 3.570 15.6 24,001-26,400 ... . . . . 1.0 1.46 903 3.580 14.2 26,401-31,200 .... 0.57 1.77 1.129 4.450 15.5 31 ,201-36,000 ... .... 0.53 1.83 1.114 4.491 13.4 36,001-45,000 .... .... 0.36 2.20 1.392 5.642 14.2 45,001-55,000 ... 0.14 2.58 1.727 7.162 14.6 55,001 . . . . . . . . . . ... 0.05 2.90 2.042 8.600 13.0' Total .. 1.04 1.53 953 3.703 14.5
The subsidies taken into account, it can be calculated, in which way the redistribution through tenement flats affects the development of vertical inequality. The way to compute the inequality indicator in official use is to divide the average income level of those with above-average income by the average income level of households with below-the-average income.
TABLE 2
The redistributive effect of the tenement flats distribution
Inequality of incomes ... .
Inequality of incomes after redistribution through flats
Households living in tenement flats 1.60 1.72 Total of households 1.74 1.78
To sum up, the statement can be made that, as against the original
intentions declared, the allocation of tenement flats does not reduce but, on
the contrary, rather increases the vertical inequalities within society (table 2).
The increasing vertical inequality holds not only for the households living in tenement flats, but also for the totality of households representing the whole society.
3 - Housing as a distributional issue
In the preceding chapter we were concerned only with households living in tenement flats. The following analysis will cover all households: those living in privately owned dwellings, those holding tenement flats and those not having an independent flat.
Two groups of questions will be discussed: (a) the distribution of money income and the distribution of dwellings, and (b) factors will be searched to explain the actual distribution of flats.
3.1 - Income distribution - distribution of dwellings
In the course of the analysis we used in parallel several indicators. Insofar as a similar ranking develops on the basis of various indicators, results
can be reliably evaluated according to any indicator (4
). The indicators used
in the course of the analysis were the following ones:
- standard deviation or coefficient of variation;
- the Gini coefficient and the Lorenz curve;
-Theil's entropy measure;
-the indicators of the distance between the extreme values «the lowest and upper deciles».
Although the computations were performed in parallel with several indicators, not all of them will be used here. In general, the indicator that best illustrates our message will be used. Let us consider the distribution of money incomes.
According to data of the household budget statistics for 1976 the distribution of personal disposable incomes (excluding benefits in kind like housing subsidy) showed the following picture: the value of the Gini coefficient was 0.222 and that of the Theil indicator was 0.087; the variation coefficient of the incomes of households was 44 per cent; the decile of the sarnple with the highest per capita income obtained altogether four times as much as the total income of the lowest decile.
Similarly to the indicators of income distribution we have computed the inequality indicators of housing circumstances determined by the distribution
of dwellings; i. e. number of rooms and quality number of rooms (5). These
are presented in table 3 and figure 1.
(4) For the measurement and problems of inequality see Atkinson (1973), Lindbeck (1975), Sahota (1978), Sen (1979) and Theil (1967).
(5) The indicator «rooms per head» does not require particular explanation. The same
doesn't happen with the indicator «quality number of rooms per headn which cannot be found in any statistics. This is an indicator which describes the quality of the dwelling, assembling the information of several parameters.
Good dwellings have been «upgraded>>, in accordance with the market evaluation, as compared with dwellings of the same size but of a poorer quality. This additional quality has been expressed not in terms of money but of an additional «number of roomsn. Therefore, if the value of a flat equiped with the necessary comfort is estimated to be the double of a flat without comfort, one room of the first case has been considered the equivalent of two rooms of the second one. The advantage of modern heating has been similarly appreciated. In the following this indicator is called «quality number of roomsn.
Income:
TABLE 3
Distribution of Incomes and dwellings
Per capita average Ft/head .. . . . 22 755 Rooms: Room/head. ... . . . . . . ' .... 0.64 Quality rooms: Room/head. ... . . . . . . . . . . . . . 1.27 FIGURE 1 Variation coefficient 44 59 78
Lorenz-curve for the whole population in 1976 @---@ Income 100
NtanberofniiiiiS 90
Ouaity oo. of rooms 80
·70 60 50 40 30 20 10 0 Theil indicator 0.087 0.136 0.251 10 20 30 40 50 60 70 80 90 100
It turns out that the extent of inequality was grater in the distribution of dwellings than in that of incomes. The inequality becomes even sharper
if also the quality of dwellings is taken into account with the aid of the «quality number of rooms». The variation coefficient of the latter indicator is double of that relating to incomes. The ratio of the lower and upper deciles is 1 :4.4 with regard to per capita incomes, 1 :5.2 with regard to rooms per head and 1:12.5 with regard to the indicator of quality rooms.
3.2 - Money income as explanatory variable
The most frequently heard stereotype describing the relationship between income and housing sounds: «He who has money, also has a good dwelling.» More exactly formulated, according to public opinion higher income is accompanied by better housing conditions. But this is merely a half-truth; in this form the statement simplifies reality.
Let us see first what is true from the statement. No doubt, there is a connection between per capita income and quality of housing. This is supported also by table 4. This table classifies the households (where the head of the household is economically active) into ten income groups and shows the per capita annual average income and the average housing supply in these groups.
TABLE 4
Income and housing supply
Average income (Ft/head) 1) 11 279... . ... . 2) 16 945 ... . 3) 20 388... . ... . 4) 22 746... . ... . 5) 25177... . ... . 6) 27 550.. . ... . 7) 29 944 ... . 8) 32 333.. . ... . 9) 36 561 . . . . . ... . 10) 50 589. Number of rooms (Room/head) 0.38 0.49 0.54 0.58 0.62 0.67 0.72 0.75 0.81 0.94 Quality number of rooms (Room/head) 0.61 0.92 1.08 1.24 1.35 1.46 1.58 1.70 1.86 2.29
The table supports the statement that the quantitative and qualitative housing conditions improve depending on the rise in income level.
Let us now consider the other side of the coin: to what extent is public opinion inexact? According to the theory of demand, the rise in money income should be boosted by the Engel effect. But the actual housing circumstances do not reflect this effect. Twice as high income involves only about twice as great number of quality rooms, though demand would grow to a greater extent as a function of income if supply could satisfy it.
We reach an even deeper understanding of the situation if we use data of all the households in full detail. We discussed the closeness of the relationship using also multiple regression analysis. The quality number of flats was the dependent variable, income, expenditures on dwellings and the number of children being explanatory variables. Computations have shown that although the relationship between housing circumstances and money incomes is significant, it is not particularly strong. The three indicators together only explain 24 per cent of the sum of square deviations, and, within this, income
level explains merely 17 per cent. In other words, a considerable part of the differences in the housing situation cannot be explained by income inequalities.
This is an important. -and to a certain extent suprising- result of our investigations. Public opinion believes that this relationship is much closer.
3.3 - Size of the family as an explanatory variable
It is only natural that large families (e. g. families with several children or families where several generations are living together) should live in larger dwellings. We attempted to examine to what extent this is happening. Clarification of the problem is rendered complicated by the fact that there
is a close relationship between size of the family and income, while - as
was
shown in the preceding point - income does influence the housingsituation. Let us first look at the relationship between the size of the family and income.
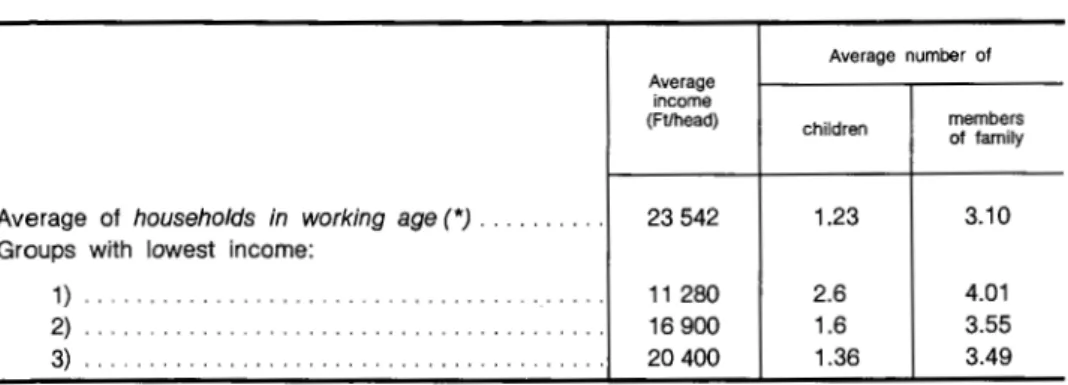
It is a world-wide phenomenon which asserts itself also in Hungary, that there is a negative correlation between income level and size of the family. And, of course, also a reverse relationship asserts itself: if from two families with the same total income there are more children and/or dependants in the first and few in the second, per capita income will obviously be smaller in the first one. The greater financial burden of a large family is only partially counterbalanced by family allowances and other social benefits. The work of this negative correlation may be seen in table 5.
TABLE 5 Income and family size
Average income (Ftlhead)
Average of households in working age (*) . . . 23 542 Groups with lowest income:
1) ... 2) ..
3) ..
(*) Where the head of the household is economically active.
11 280 16 900 20 400 Average number of children 1.23 2.6 1.6 1.36 members of family 3.10 4.01 3.55 3.49
Let us draw housing supply into the analysis now. The two lowest income brackets in table 5 comprise 36 per cent of the population and they only possess 23 per cent of the quality number of dwellings. If the lower three groups are added we realize that 49 per cent of the population get 35 per cent of the stock of dwellings.
Obviously, there should not be any positive linear relationship between the number of children and the size of the dwelling. A large family needs mainly more bedrooms, while the number of common rooms does not grow proportionally to the size of the family. But, instead of a non-linear «degressive» positive relationship we found a significant negative correlation in our statistical investigations: the larger the family, the more likely it lives under bad housing
conditions.
We selected the fourty households living under the worst housing conditions from among the 8500 families. All of them had several children.
The biggest had 11 children, the smallest 5 children - each were living in
a one-room flat without any conveniences. In these households the per capita annual income was between 7 and 20 thousand forints.
3.4 - Social status as an explanatory variable
First of all we have to mention a conceptual distinction frequently used in the professional literature on the problem of inequality which we shall adopt too. It is usual to distinguish between vertical and horizontal distributions. We speak of a vertical distribution when the different income brackets of society, situated <<above each other» are considered. The horizontal distribution means the distribution of groups of society according to other different criteria, irrespective of their place in the vertical distribution (by income). The vertical distribution has been already examined; we are going to discuss the distribution of dwellings according to the horizontal status in society, now. The horizontal differences will be investigated using three differentiating criteria:
- occupation, or rather <<stratum» comprising several occupational groups;
- domicile, that is, the institutional and economic conditions of the environment; and
- age or distinction between economically active and inactive state.
The household budget statistics classifies the economically active heads of families into 9 occupational groups. The occupational groups are associated to levels of education and qualification, their way of life and their consumption habits being different, which partly explains their different claims to dwelling. Table 6 presents the relative income and housing situation of the
occupational groups as well as the ranking by inequality within the group. The table expresses the income of the occupational groups and the relative housing situation in percentage of the group in the worst situation; the relative ranking by inequality is expressed in the increasing order of inequality.
TABLE 6
Survey by occupational groups
Average (in percentage Ranking by inequality of the lowest value) within the group
Quality Quality
Income number income number
of rooms of rooms
Skilled and semi-skilled workers ... 118 140 5-6 6
Unskilled workers ... . . . . ... 100 101 8 9 Foreman ... . . . . . . . ... 136 178 2 4 Cooperative peasants ... . . . . . .. . ... ' 113 117 9 8 Foreman in cooperative ... . . ... 149 166 1 3 Double-income workers ... . . . . ' ... 123 100 4 7 Double-income peasants ... . . . . ... 128 104 5-6 5 Leading intellectuals ... ... 168 250 7 1 Clerk ... ... 148 217 3 2
Causal analysis is not easy. It may be stated that the four occupational groups with highest income (leading intellectuals, clerks, foreman) are in the best housing conditions. But we have to add that also the educational and cultural level of these groups is highest. The proportion of those with secondary school or higher education is 72 per cent in the combined average of leading intellectuals and clerks, 55_2 per cent with foremen in cooperatives, while it is 8.1 per cent with manual workers and 1.6 per cent with cooperative peasants. In addition, also the social prestige of the first four groups is higher. To what can then the more advantageous housing supply be attributed? To the fact that these four occupational groups can get more money and can attain through it better housing conditions? Or is it that the family background, education, higher cultural level have developed greater claims for housing and -perhaps renouncing other expenditures- they try to create better housing conditions for themselves? Or can it be attributed to the fact that through their positions in the social hierarchy they can fight more easily or wangle for the housing conditions they want: they get advantages in the allocations of flats or - if they build their own homes - in acquiring the materials, ttie fittings, and in finding the building contractor?
It may be assumed that all three factors play a role. However, our investigations do not provide sufficient basis to determine also the numerical weight of the factors which participate in shaping the final outcome. But our computations have shown that it would be a mistake to overestimate the role of money income.
On this basis we may formulate a hypothesis:
Inherited conditions have an extremely great role in the development of the housing situation of a family. This is partly «intellectual inheritance», the cultural atmosphere of the family, the
ambitions of parents in connection with the education of children, and the pattern of demands developing in their wake. And it is partly <<physical inheritance», inheritance of a privately owned house or dwelling, or of the right to use a tenement flat. The more advantageous from this respect the start, the greater are the demands and also the chances for creating better housing conditions.
It is important to emphasize the demands and the chances depending
on the start so as to demarcate ourselves from the onesided and biassed
standpoints which are widespread regarding our subject. True, many people are induced by the claims brought from the family and developed during their education to create for themselves and their family more advantageous
housing conditions - even at the price of renouncing other claims. And it is
similarly true that a more favourable family background secures, if not surely better results, at least better chances in many respects for those fighting for better housing circumstances. We shall return to this subject later.
As far as higher incomes are concerned the Engel-law is still at work, that is, the demand for dwelling grows with income. At the same time
- because of greater monetary resources - also the chances substantially
improve. At this level, however, differences between subgroups with identical income but of different occupation status become blurred.
We have examined above the differentiating effect of occupation. Let us now turn to analysing the impact of another important factor, the domicile. The structure of table 7 is identical with that of the former one, with the difference that here we examine the number of rooms and the quality number of rooms separately, because in the supply with bathroom and other conveniences location has a particular role. Data refer to households which head of household is in working age.
TABLE 7
Survey according to location
Average (in percentage Ranking of levelling of the lowest value) within the group
Number Quality Number Quality
Income of rooms number Income of rooms number
of rooms of rooms
Budapest. . . . . . . . . . . . .. 131 114 166 1 1 1
Country towns . 112 105 141 2 2 2
Villages .. . . . . . . . .. 100 100 100 3 3 3
Whatever the indicator the relative situation of households in the villages is the worst. There is also evidence that the most unequal distribution of
The disadvantages of living in villages are indirectly reflected in the occupational groups where a considerable portion of the households are living in villages. In addition, part of them live far from the workplace and have to commute. Thus, beyond the educational and schooling disadvantages already mentioned, also the institutional and economic conditions of the village domicile provide an explanation for the relatively worse housing conditions of skilled and unskilled workers, cooperative peasants, double-income workers and peasants.
Differences between the housing conditions of the economically active
and inactive age groups are highly important. This is borne out by table 8.
TABLE 8 Survey by age groups
Room/head Average income Quality (Ft/head} Number number of rooms of rooms (room/head} (room/head} Head of households:
In economically active age ... . . ... 23 574 0.59 1.23 In economically inactive age ... ... 18 208 0.91 1.45
Differences in the number of rooms per person are particularly important. The housing situation of inactives is more favourable in spite of their lower
income. The explanation may be found in the fact that after children have
moved away and when old couples or widowlerls remain alone, it is most unusual to share the house or dwelling in the village, and in towns exchanges are rare because of the lack of mobility and of stimulating financial conditions. 3.5 - Form of ownership as an explanatory variable of the distribution of dwellings
The income and housing situation of households classified according to ownership are shown in table 9.
TABLE 9 Survey by ownership
Income Number of rooms Number of quality rooms Average Variation Average Variation Average Variation
coefficient coefficient coefficient (Ft/head}
(per cent) (rooms/head} (per cent) (rooms/head} (per cent)
Own property .... ... 21 860 45 0.65 55 1.21 75
It is unequivocally clear that it
is
not necessarily those who ~<Can afford» that are living in personally owned dwellings, since, with almost identical variation coefficient of incomes, the average income of those living in tenement flats exceeds the per capita income of those living in their own dwellings by almost 20 per cent.Detailed analysis shows that nature of ownership is an important explanatory variable of the distribution.
Ownership depends on domicile. For some groups the choice between forms of ownership exists, at least in principle. For others, particularly for households living in villages, the possibility of
access
to tenement flats is ab ovo excluded (apart from a few exceptions). It depends on the income position of the household. It depends also on the labour power available to the household, on the organizing capacity of families, and on how they can undertake the physical, intellectual and nervous strains accompanying private constructions. This building and organizing activity plays an important role in both village and urban housing constructions.Ownership depends also on family background. In well-to-do families everybody helps to build the relatives' houses; and the home, the dwelling · is inherited after the preceding generation. In case of own property inheritance
is legally secured.
Finally, obtaining a tenement flat depends on the probability of participation in state redistribution. He who lives in a state-owned tenement flat of inferior quality, gets little or quite negligible state support. He who has got a good quality tenement flat enjoys considerable state subvention.
There are no data available to clarify the relative weights of the above· -mentioned causal factors. Yet, with the available data we venture the statement that the main explanation for the present distribution is not the income distribution and the consumption preferences of the families, although, as it turned out from the earlier parts of the study, these play important roles too. It seems that the economic and legal constraints on acquiring a dwelling have much greater power: the forced choice following location (there are no tenement flats in villages), the chronic shortage of state-owned tenement flats (the long waiting seems hopeless). Finally, there is the family background effect: acquisition of property depends on the momentary income situation of the household. This is indirectly proven by the fact that the average income of those living in state-owned tenement flats exceeds the income level of those living in their own dwellings.
3.6 - Distribution of housing costs
I decided to leave the question of housing costs to the end of the analysis. This is perhaps the most intricate part of the subject; it certainly is the most difficult to survey and to quantify.
Let us first interpret the notion of «housing cost» in the framework of household budget statistics. The following forms of outlay concerning dwellings should be considered:
1) Tenants in state-owned flats pay housing rent; 2) Those living in sub-tenancy also pay rents;
3) Those who build their own homes or dwellings pay the costs of construction falling due. This kind of outlay does not exclude outlays of type 1 or 2, since the family has to live
somewhere until its own dwelling is ready;
4) Those who live in their own dwellings pay all the costs involved by use: maintenance and renewal costs, in condominiums the so-called «common costs», house tax, etc.
The category of housing costs summarizes the above outlays of types 1-4. We may now turn to analysing inequality. We will do that on the basis of the housing cost of a household, only, irrespective of the size of the dwelling and of quality. We examine thus the distribution of the indicator of housing cost/head.
Measured by the variation coefficient, the inequality of the indicator of income/head is 46 per cent, while that of housing cost/head is 269 per cent. The difference between the two figures is astonishingly high, although the surprise of the researcher diminishes if he thoroughly reflects about the everyday experience of his environment, among his colleagues and
acquaintances. The spending of the household on consumption items other
than housing is to an extremely large extent determined by how much it wants
(or is compelled) to spend on dwelling. It depends not only on the money
income and the size of the family, but much on the housing situation of the household, on the efforts and ambitions at changing this situation and on how much remains for food, clothing, cultural expenses, consumers' durables. The inequality of housing cost is also greater than that of the indicator accounting for the quality of the dwelling. This is illustrated in figure 2 with the aid of Lorenz-curves. It is conspicuous that the lowest curve showing the distribution of housing costs lies deep below the others, indicating the large extent of inequality.
The inequality of the distribution of housing costs is explained by several factors. Let us list here only a few of them:
1) The building and use of an own home or dwelling right to its demolition is a very long process, lasting for decades. The outlay just falling due depends on where the house or dwelling is in its total life-cycle;
2) The housing cost depends, to a large extent, on the specific situation of the household in question. A young couple moving into a privately owned dwelling inherited from deceased parents bears much smaller costs than another one which wants
to create a dwelling for itself from its own savings and credit raised on its future earnings. Here the same factor -inheritance- returns, but linked to housing costs, which we already discussed when speaking about getting a dwelling;
3) The role of state redistribution - as it was mentioned before
-is extremely strong. Those who live in state-owned tenement flats, particularly those who possess good quality flats, get indirectly significant state subventions.
FIGURE 2
Lorenz-curve for the whole population in 1976
0---{j) Income 1 00 N ... of.,... 90 Ollllty ... of ... 80 H ... - 70 60 50 40 30 20 10 / / ...
-
... / / / / / / / / 0~~---+--,_--+---~~---+--,_--+-~~ 10 20 30 40 50 60 70 80 90 1003.7 - The ethical principles and practice of distribution (6)
The analysis has been concerned so far with the actual characteristics of the distribution of dwellings. The practice of distributing flats will be discussed now in the light of the principles of distribution «officially» declared and socially accepted; that is, we shall discuss to what extent are other factors present in distribution, tolerated or condemned from the ethical point of view.
(6) Formulation of the problem has been much inspired by two studies of A. Sen. My own line of reasoning and the grouping differs somewhat from those of Sen at several points since the formulation of the principles here described was prompted expressly by the practice of socialist economy and the discussions about general economic and housing policies. See Sen (1973, 1978).
To simplify the problem, six distributional principles - existing in
Hungarian society- will be formulated (1).
TABLE 10
Alternative principles of distribution A According to work done ... .
B Levelling . . . . ... . C Right to an independent acceptable dwelling ... . D Helping those in a disadvantageous situation .... . E-1 By right of birth ... .
E-2 Inheritance/limited/; material assistance by the family ... . Social judgement Accepted Accepted Accepted Accepted Refused Tolerated
Although the principles listed above require no special explanation, a remark is to be made on the principles A, 8, C, and D. All are accepted by social judgement. Taken as a whole, they are the ones to be considered as the socialistic distributional principles. They are called socialistic principles so as to make it clear that, though their acceptance doesn't mean agreement with socialism, they are largely in harmony with the ideological traditions of the socialist movement and with the officially formulated distribution principles of the socialist countries.
Let us turn, now, to evaluating the computations.
Principle A is the principle of distribution according to labour performed,
and principle D is the one of helping those in a disadvantageous situation. The money income of the household includes wages and monetary social benefits. If the principles A+ D strictly prevailed in the distribution of dwellings, then the relationship between money incomes and housing circumstances would be very close. All that has been said earlier about the not too close relationship seems to verify that principles A
+
D are not consistently enforced in the distribution of dwellings in Hungary.Principle 8 was called levelling tendency. A consistent assertion of
principle B would be expressed in a close positive correlation between the size of the family (the household) and the number of rooms. If we consider the actual practice, we would expect the effect of the above principles coming to expression in one or another element of the Hungarian distribution system. I would stress here only what belongs to our subject: in the distribution of money incomes the family allowance works in the leveling direction and so does the principle that large families should as far as possible be preferred in the state allocation of flats. But it seems that in the final analysis the
(?) The ethical principles of distribution are discussed in detail in my study, «just» or «Unjust» distribution of dwell"lngs.
tendencies working against the principle 8 are much stronger. As regards the merits of the matter, the principle of levelling does not assert itself in the actual distribution of dwel/ings.
In Hungarian society the principle C «Right to an independent acceptable dwelling» is declared. Notwithstanding, almost 8 per cent of the families have no independent flats and are forced to live together with other families. The role of inheritance has been discussed in detail; here it is only to recall some of the statements made earlier. Inheritance has an extremely important role in the development of the housing conditions of families. This is partly an «intellectual» heritage and partly a «physical» one; in villages, however, the «inherited» backward state of the infrastructural supply works as well. Therefore, in spite of all deliberate interventions, it is not only the principle E-2 that asserts itself, but also the condemned principle E-1, which makes distribution dependent upon birth rights.
In the final analysis, we may state: in the present-day distribution of the Hungarian society, and within it in the distribution of dwellings, a compromise of the principles asserts itself. Although the majority of principles are accepted in themselves, their combined effect and their compromising coexistence with other, not accepted, but mostly tolerated forms of distribution brings about a particular distribution system of «mixed» morality. It seems that in this «mixture» the different principles get considerably blurred; the positive -reassuring, orientating and stimulating effect of the individual principles on the moral public feeling becomes blunted. This becomes manifest, among other things, in that the combined effect of the coexistence of alternative principles prevents that the principle unconditionally accepted and repeatedly declared as final ethical postulate by society, that «every man has the right to start with equal chances», does not prevail.
4 - The reform of the housing sector (8)
In Hungary, the necessity of reforming the housing sector has been a case at issue for years. There is no unanimity in the interpretation of the present situation, and much less as for the character and extent of the reform required. There are extreme viewpoints held in the dispute. For some people the present system of housing distribution is basically good; there are certain errors, which can however be eliminated with the aid of computers and better organisation. Others believe that the form of tenement flats is to be ceased altogether, in a way that the state-owned flats would be transferred into private
(8) The reform of the housing sector is discussed in detail in my earlier study under the same title Daniel (1981) for the dispute see also the articles Liska (1969), HegedOs·Tosics (1981), MiMiye (1981).
ownership by making the tenants buy them from the state. Relying upon my own empirical investigations, I shall set forth some of my views on the reform. I suggest to introduce a market mechanism to replace the central state allocation. The conceptions of the 1968 economic reform should be extended so as to cover the housing sector. The state should influence in several ways the functioning of the market: it could impose certain restrictions, legally as well as through taxation, social policy allowances, and the credit system. Within the framework of the reform no considerable change would be necessary in respect of the main proportions of collective and private property, whereas an essential reform should be effectuated in the state housing sector. There housing supply enterprises should be transformed into profitably functioning, market-oriented enterprises. State subsidy would cease, as well as the administrative limit on rents. The rents would be formed on the market: the lower limit imposed by the cost level, and the upper limit by the solvent demand. Of course, the rents formed on the market would result in a much higher rent level, therefore, assuming other prices unchanged, the total nominal income of the population should be raised.
The housing reform would leave the total real consumption unchanged, while it would effect a considerable regrouping in the distribution among the various groups of the population. First of all it would help to level out the high difference that exists between families getting state subsidy through low rents, and those living in dwellings in other forms of ownership and thus not receiving that kind of subsidy. The reform would be a step forward on the road to distribution according to work, since, if two households get the same financial income, their chances in respect of housing will be less unequal. At this point we wish to mention private home-building. It is not to be expected of any kind of home-building investment, not even of the one of private character, that should be covered entirely from own resources. 60 to 90 per cent of the costs of private home-bulding should be covered by credit granted to the builder at a positive real interest.
State subsidy is to be continued, however, directly addressed to households, and not by subsidising the losses of the housing sector. Social benefits must be unconcealed, and granted deliberately upon social, ethical, and humanitarian considerations, rather than on economic or efficiency ones. Assistance should be given to those families only which are entitled to have it in accordance with the state's social politics.
At given nominal incomes the rents or prices of flats formed on the market will delimit the demand, which has been practically limitless at the almost nominal rents, at least for the tenement flats. After a certain adjustment period, the general housing shortage would thereby be eliminated. Of course, the supply side should be used to contribute to the reduction of shortage and then to its elimination. One guarantee to this could be the reform of the economic mechanism within the housing sector.
The housing sector is one of those of which it is well known that the
allocation. There are a number of «external effects»: the construction of new flats or the maintenance of the old ones may carry such unfavourable effects which are not expressed in the rents, or in the price of the building. Planning, as well as the operative regulating role of the state could greatly help to reduce the negative phenomena. It is exactly the release from the everyday tasks of allocation, or, the shifting of these over to the market that enables to carry out, at a higher level, the specific planning tasks and central state activities.
REFERENCES
ATKINSON, A. B.- «On the measurement of inequality», in Atkinson, A. B., ed. Wealth, Income and Inequality, Penguin Harmondsworth, pp. 46·68, 1973.
DANIEL, Zs- <dgazsagos vagy 'igazsagtalan' lakaselosztas ('Just' or 'unjust' distribution of dwellings)>>, Val6sag, n. o 4, 1980.
DANIEL, Zs.- «A lakasszektor reformja•• (The reform of the housing sector), Val6sag, n.0 12, 1981 ..
HEGEDUS, J.; TOSICS, J. - «Lakaspolitika es lakaspiac•• (Housing policy and housing market),
Val6sag 7, n.0 7, 1981.
KONRAD, Gy.; SZELENYI, J. -«A lakaselosztas szociol6gia kerdesei>• (Sociological problems of housing distribution), Val6sag, n. o 8, 1969.
KORNAI, J . -Economics of Shortage, North-Holland, Amsterdam, 1980.
Kozponti Statisztikai Hivatal (Central Statistical Office), Haztartasstatisztika (Household statistics), Budapest, 1976.
LISKA, T. -«A berlakaskereskedelem koncepci6ja>> (The concept of the market of dwellings in public ownership), Val6sag, n. o 1, 1969.
LINDBECK, A. -Inequality and Redistribution Policy issues, (mimeographed), Institute of International Economic Studies, Stockholm, 1976.
MIHAL Yl, P. - «Torteneti szempontok a magyarorszagi lakashiany ertekelesehez•• (Historical viewpoints of evaluating the housing shortage in Hungary), Val6sag, n. o 5, 1977. MIHALY, P.- «Berl6b61 tulajdonos. Egy lakasreform vaziata» (From tenancy to ownership).
Val6sag, n. o 2, 1981.
RAWLS, J. - A theory of justice, Harvard UP, Cambridge, 1981.
RAWLS, J. - «Distributive justice>>, in Phelps E. S., ed., Economic justice, Penguin, harmondworth,
pp. 319·362, 1983.
SAHOTA, G. S.- «Theories of personal income distribution: a survey>>, Journal of Economic Literature, 16, pp. 1·15, 1978.
SEN, A.-On Economic Inequality, Clarendon, Oxford, 1973.
SEN, A.-«Ethical issues in income distribution>>, in Grassman, S. and Lundberg, E., eds., The World Economic Order: Past and Prospects, MacMillan, London, pp. 464·494, 1978. SEN, A.- «Personal utilities and public judgements: or what's wrong with welfare economics>>,
Economic Journal, 89, pp. 537-558, 1979.
THEIL, H.-Economics and Welfare, North-Holland, Amsterdam, 1967.
DANIEL, Zsuzsa- Os efeitos da habitac;ao sobre as desigualdades sociais
RESUMO:
Em resultado da permanente escassez de habitac;:ao, as diferenc;:as nas condic;:oes de alojamento tornaram-se um dos factores de diferencia-c;:ao mais importantes da sociedade hungara contemporanea. Desigual-dades nas condic;:oes de habitac;:ao e na atribuic;:ao de alojamentos reve-lam a existencia de efeitos redistributivos consideraveis quando compa-rados com a distribuic;:ao do rendimento. Neste artigo, sao quantificados e avaliados os efeitos redistributivos da polftica de distribuic;:ao de aloja-mentos alugados.
Verifica-se que esta forma de distribuic;:ao, em termos ffsicos, aumenta as chamadas desigualdades horizontais e verticais dentro da sociedade, em oposic;:ao aos objectives pretendidos. A «desordem» na distribuic;:ao de sub-sfdios elevados, que se refectem nas rendas, enfraquece o papel a de-sempenhar pelo rendimento na execuc;:ao da polftica e, simultaneamente, afecta os objectives de justic;:a social e portanto a propria polftica social.
DANIEL Zsuzsa -The effect of Housing on Social Inequality
ABSTRACT:
In consequence of the lasting housing shortage, differences in housing conditions have become one of the most important differentiating factores of contemporary Hungarian society. Inequalities housing conditions and allocation of flats indicate that considerable redistribution effects take place as compared to the distribution of money incomes by means of flats. In this article the redistributive effects of the distribution of rented flats on social groups are measured and evaluated.
It is stated that this form of allocation in physical terms increases the so called vertical and horizontal inequalities within society contrary to the original objectives. The «disorder>• of the distribution of high subsi-dies included in rents weakens economic stimulation through incomes and simultaneously hurts social justice to be enforced in social policy.