FACULDADE DE MOTRICIDADE HUMANA
Thigh Composition, Cardiorespiratory Fitness
and Physical Activity in a Weight Loss
Program with Overweight and Obese Women
Dissertação apresentada com vista à obtenção do grau de Doutor no Ramo de Motricidade Humana, Especialidade de Saúde e Condição Física
Orientador:
Doutor Luís Fernando Cordeiro Bettencourt Sardinha, Professor Catedrático da Faculdade de Motricidade Humana
Júri:
Presidente
Reitor da Universidade Técnica de Lisboa Vogais
Doutor José Alberto Ramos Duarte, Professor Catedrático da Faculdade de Desporto da Universidade do Porto
Doutor Joaquim Adelino Correia Ferreira Leite-Moreira, Professor Catedrático da Faculdade de Medicina da Universidade do Porto
Doutor José Henriques Fuentes Gomes Pereira, Professor Catedrático da Faculdade de Motricidade Humana da Universidade Técnica de Lisboa
Doutor Luís Fernando Cordeiro Bettencourt Sardinha, Professor Catedrático da Faculdade de Motricidade Humana
Para:
Acknowlegements/Agradecimentos
Este é o único capítulo da presente Tese escrito em português pois destina-se a partilhar
a minha gratidão por todos aqueles que contribuíram para que este trabalho pudesse ser
desenvolvido e, finalmente, concluído.
O primeiro agradecimento destina-se ao Professor Doutor Luís Bettencourt Sardinha
pela confiança que depositou em mim ao convidar-me para trilhar este percurso, ainda
antes de eu ter terminado o curso de Mestrado em Exercício e Saúde. O seu espírito
empreendedor foi determinante para a criação das condições de investigação que
levaram a que o LabES (Laboratório de Exercício e Saúde) conjugue um conjunto de
valências de investigação de qualidade mundial, constituindo, assim, um envolvimento
propício ao desenvolvimento científico de todos os que têm oportunidade de poderem
usufruir daquele local. O Professor Doutor Luís Bettencourt Sardinha foi o mentor
científico do programa PESO (Promoção de Exercício e Saúde na Obesidade), programa
este que se tornou simultaneamente no “cenário” e “matéria prima” que permitiram a
realização da investigação aqui apresentada, para além de muitas outras publicações
científicas, quer de carácter nacional como internacional. A sua visão, orientação,
disponibilidade e amizade foram fundamentais para iniciar e levar a bom termo esta
jornada científica. Mais ainda, mostrou-me a importância de apurar o meu espírito
crítico face às facilidades (por vezes aparentes) e obstáculos que surgiram ao longo do
percurso, levando-me a “crescer” e a desenvolver a autonomia que me permitiu seguir
em frente no rumo profissional que tracei até aqui, e que certamente vai continuar a
ser-me útil no futuro.
Ao Professor Doutor Pedro Teixeira, colega e amigo, orientador científico do programa
PESO, pelo conhecimento, método, rigor e organização que permitiram a concretização
site Peso & Medida), os quais constituem referências no que à investigação na área da
Obesidade diz respeito. A colaboração que me proporcionou no decorrer da concepção e
implementação do programa PESO, envolvendo tarefas e funções muito diversificadas,
proporcionaram-me experiências fundamentais para a aquisição das competências que
levaram à conclusão do presente trabalho e, também, de outros desafios.
À Professora Doutora Helena Santa-Clara e à Professora Doutora Fátima Baptista, pelo
acolhimento e formação que me proporcionaram no LabES, uma verdadeira mais-valia
para a aquisição de competências laboratoriais, bem como pela amizade que sempre
demonstraram.
Um agradecimento muito especial aos meus colegas e amigos ao longo de toda esta
epopeia: Teresa Branco, António Palmeira, Cláudia Minderico, Analiza Silva, Paulo
Rocha, José Luís Themudo Barata e Elvis Carnero. Somente o trabalho de equipa
permitiu corresponder às muitas e diversificadas solicitações decorrentes do facto de
que “No LabES não há almoços grátis!” Foi, realmente, um prazer e um privilégio
poder trabalhar e privar com todos, num ambiente onde sempre se destacou a amizade, a
entreajuda, o respeito mútuo e a boa disposição, mesmo quando as divergências de
opinião ocorriam. Um agradecimento especial à Alexandra Rodrigues que já não se
encontra em nós.
Ao Professor Doutor Jorge Proença pela confiança e pelo desafio que me lançou, bem
como pela paciência e compreensão demonstradas para a concretização desta etapa.
À Professora Doutora Helena Fonseca por me ter dado a oportunidade de trabalhar na
obesidade adolescente, como parte integrante de uma equipa multidisciplinar,
devem estar subjacentes ao trabalho realizado. Obrigada, também, pela sua amizade e
estima.
À Professora Doutora Isabel do Carmo pela sua disponibilidade e apoio, que me têm
permitido compreender e colaborar na área da cirurgia da obesidade, bem como pelo
apreço que sempre demonstrou.
Aos meus colegas de trabalho Raquel Madeira, Susana Veloso, Sofia Fonseca, Luís
Bom, José Brás, João Oliveira, Luís Cerca, Frederico Raposo, António Marques-Vidal,
Sandro Maximiliano, Rita Cordovil, Pedro Passos, entre outros, que me têm permitido
trabalhar num ambiente de amizade, respeito e entreajuda, com resultados muito
positivos no desempenho de todos. Um agradecimento especial ao António Palmeira
por ser o meu braço direito na ULHT, contribuindo para que eu possa trilhar novos
percursos e participar noutros projectos de investigação para além do programa PESO.
À Teresa Branco, minha colega do curso de Mestrado em Exercício e Saúde, parceira
desde a preparação do projecto de candidatura ao doutoramento e, acima de tudo,
grande amiga. Com uma sensatez e inteligência emocional claramente acima da média,
sempre disponível e presente, com uma palavra de incentivo para ajudar a ultrapassar os
obstáculos que foram surgindo (e que não foram poucos)! Obrigada por me ajudares a
“crescer” profissionalmente e, acima de tudo, pessoalmente, ensinando-me a ser mais
tolerante e atenta em relação às pessoas e, sobretudo, aos sentimentos. A Teresa é
realmente um ser humano excepcional e é para mim uma honra tê-la conhecido e ser sua
amiga.
Por fim, mas garantidamente não por último, a minha gratidão e enorme apreço
dirigem-se à minha família: marido, filhos, pais, avó, sogra, irmão, cunhados e
este percurso e por ter estado ao meu lado nos “altos e baixos” que ocorreram ao longo
do mesmo. O seu apoio e amor foram essenciais para chegar a este momento. Ao
Guilherme e à Inês por me relembrarem permanentemente do que é mais importante,
definindo o “Norte” da minha vida. Aos meus pais pelo apoio incondicional que sempre
me deram e pelo encorajamento para persistir nos meus objectivos de vida. À minha
querida avó pelo amor e auxílio insubstituível. À minha sogra, pelo enorme afecto,
amizade e apoio que me tem demonstrado. Ao meu irmão, cunhados e sobrinhos
agradeço o incentivo e carinho que sempre me deram e que tão importantes são para o
General Abstract
The purpose of the present Thesis was to analyze thigh composition through body
composition methods and alterations research areas and its associations with
cardiorespiratory fitness (CRF) and physical activity (PA) in overweight and obese
premenopausal women. Three studies were conducted within the PESO program
(Promotion of Execise and Health in Obesity), a behaviourally-based intervention with
a strong emphasis on PA and nutrition. Study I developed and validated predictive
equations for thigh composition assessment, using computed tomography (CT) as the
reference method and with dual-energy X-ray absorptiometry (DXA) and
anthropometry indicators as prediction models. Study II aimed the cross-sectional
analysis of the associations between CRF and daily PA with thigh composition volumes
determined by CT. In Study III a longitudinal approach allowed the investigation of the
effects of a weight-loss intervention on thigh composition, CRF, and daily PA. Key
results show that: a) prediction equations for the different thigh components may be
useful in different settings where body composition may be critical and need to be
followed longitudinally, such as in wasting illnesses; b) women with higher levels of
CRF presented greater thigh skeletal muscle mass, independently from their PA level; c)
greater low intensity PA was associated with lower thigh subcutaneous adipose tissue;
d) maximal oxygen consumption level is associated with different thigh composition
phenotypes; e) a 16-month weight-loss intervention positively impacted thigh low
density SM tissue area, along with a decrease in low density SM quality and increases
in CRF, and daily PA, suggesting the occurrence of the athlete’s paradox in overweight
and obese premenopausal women; f) beneficial changes were observed from 0-16
months in body composition determined by CT, DXA and anthropometry indicators
Keywords: Obesity, body composition, computed tomography, exercise,
cardiorespiratory fitness.
Resumo Geral
O objectivo da presente Tese foi analisar a composição da coxa através das áreas de
investigação dos métodos e das alterações da composição corporal, estudando, também,
as suas associações com a aptidão cardiorrespiratória (ACR) e com a actividade física
(AF), em mulheres pré-menopáusicas com excesso de peso e obesas. Foram realizados
três estudos no âmbito do programa PESO (Promoção do Exercício e Saúde na
Obesidade) - uma intervenção comportamental com grande ênfase na AF e na nutrição.
No Estudo I procedeu-se ao desenvolvimento e validação de equações preditivas para a
estimação da composição da coxa, utilizando como método de referência a tomografia
axial computorizada (TAC), enquanto a densitometria radiológica de dupla energia
(DXA) e a antropometria foram utilizadas como modelos preditivos. O Estudo II teve
como objectivo investigar transversalmente as associações entre a ACR e a AF diária
com os volumes da composição da coxa determinados pela TAC. O Estudo III recorreu
a uma abordagem longitudinal para investigar os efeitos de uma intervenção de perda de
peso na composição da coxa, ACR e AF diária. Os principais resultados demonstraram
que: a) as equações preditivas para as diversas componentes da coxa podem ser úteis em
diferentes contextos, nos quais a composição corporal possa ser crítica e necessite de ser
monitorizada longitudinalmente; b) mulheres com níveis de ACR mais elevados
apresentam maior massa muscular na coxa, independentemente do seu nível de AF; c)
maiores níveis de prática de AF de intensidade leve estão associados a uma menor
acumulação de tecido adiposo subcutâneo na coxa; d) o nível de utilização máxima de
oxigénio encontra-se associado a diferentes fenótipos da composição da coxa; e) uma
intervenção de perda de pesa com a duração de 16 meses promoveu o aumento da área
de tecido muscular de baixa densidade, simultaneamente com a redução da qualidade
ocorrência do paradoxo do atleta em mulheres pré-menopáusicas com excesso de peso e
obesas; f) dos 0-16 meses verificaram-se modificações benéficas na composição
corporal determinada pela TAC, DXA e antropometria, simultaneamente com melhorias
na ACR e na AF habitual.
Palavras-chave: Obesidade, composição corporal, tomografia axial computorizada,
exercício, aptidão cardiorrespiratória.
Table of Contents
CHAPTER 1
General Introduction………1
Introduction to the Thesis………..…2
The Study of Body Composition………..…….3
The Five-Level Model of Body Composition……….…...…………4
Skeletal Muscle Tissue………..……….5
Adipose Tissue……….……11
Body Composition Assessment………..…….20
Computed Tomography………..….20
Dual-energy X-ray Absorptiometry……….…25
Anthropometry……….…28
Body Composition versus Physical Activity and Physical Fitness…………..…36
Research Goals………40
References………42
CHAPTER 2 General Methods………...……….….51
Introduction………..………52
Sample……….52
Participants Eligibility and Recruitment………..…52
Eligibility Visits………...53
Participants………...53
Intervention Design………..54
Comparison Group………...55
Monthly Meetings Group……….55
Monthly Meetings + Structured PA Group………..55
Body Composition Assessment………...56
Computed Tomography………...56
Dual-energy X-ray Absorptiometry……….58
Anthropometry……….58
Maximal Aerobic Capacity………..59
Physical Activity………..60
Objective Assessment of PA………60
PA Questionnaire……….61
Statistical Analysis………...61
References………64
CHAPTER 3 Study I – Predictors of total thigh composition: DXA and anthropometry-based prediction models…...………...………....…66
Abstract…..………..………67
Background………..69
Experimental Methods……….70
Body Composition Measurements...………71
Anthropometry……….71
Computed Tomography………71
Dual-energy X-ray Absorptiometry……….73
Statistical Analysis………...73
Results………..75
Participants Characteristics………..75
Model Development……….75
Reference SM versus Predicted SM……….77
Reference SMHU versus Predicted SMHU……….78
Reference TTAT versus Predicted TTAT………78
Reference TSAT versus Predicted TSAT………80
Reference TIAT versus Predicted TIAT………..80
Discussion………82
Model Development……….82
CT and DXA Soft Tissue Validity and Accuracy………83
Model Utility………85 Study Limitations……….86 Conclusions………..87 Acknowledgements………..87 References………88 CHAPTER 4 Study II – Cardiorespiratory fitness and physical activity are associated with thigh composition determined by computed tomography in overweight and obese premenopausal women………...…….……..91
Abstract…..………..………92
Background………..94
Experimental Methods……….95
Participants………...95
Body Composition Measurements...………96
Anthropometry……….96
Computed Tomography………97
Measurement of Cardiorespiratory Fitness...……….….98
Objective Assessment of Physical Activity……….99
Abstract…..………..………..115
Background………116
Experimental Methods………...117
Participants Eligibility and Recruitment...……….117
Eligibility Visits……….118
Participants………...119
Study Design………..119
Comparison Group………...120
Monthly Meetings Group………...120
Monthly Meetings + Structured PA Group………120
Monitoring the Intervention………...120
Laboratory Measurements………..120
Subclinical Measurements………..121
Other Measurements………..121
Body Composition Measurements...………..122
Anthropometry………...122
Dual-energy X-ray Absorptiometry………...122
Computed Tomography………..122
Cardiorespiratory Fitness………...……….…...124
Physical Activity Questionnaire………..………...124
Statistical Analysis………...125
Results………126
Discussion………..129
Conclusions………135
Acknowledgements………136
References………..137
CHAPTER 6 General Discussion………...…...………141
Main Research Findings…..………..142
Interactions Between the Two Body Composition Research Areas…………..144
References………..147
CHAPTER 7 General Conclusion………...………148
Summary of the Main Research Findings…..………..………..149
Tables and Figures
Tables
Table 1.1. (General Introduction): Classification of adipose tissue (AT) focusing on nonvisceral AT………..…..12
Table 1.2. (General Introduction):Thigh SM tissue prediction equations…………...31
Table 1.3. (General Introduction):Thigh AT prediction equations ……..………..34
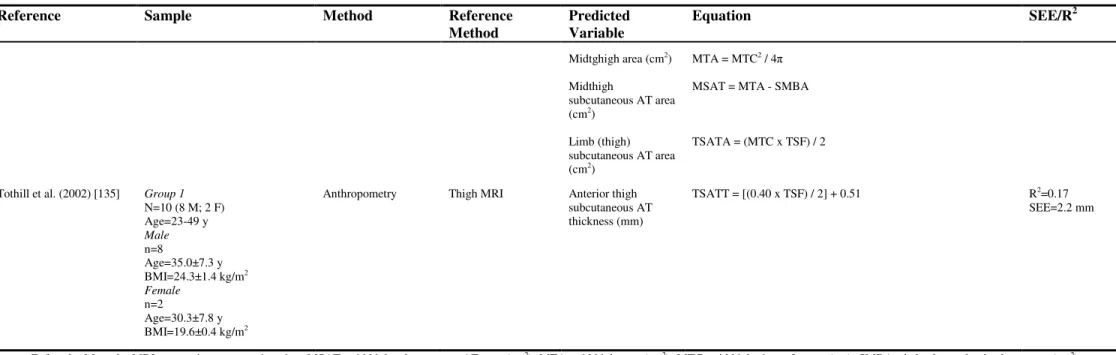
Table 3.4. (Study I): Subject characteristics of the whole group, with thigh composition results from CT and body composition estimated by DXA ……..………...……..76
Table 3.5. (Study I):Calibration models for SMHU, SM, TTAT, TSAT and TIAT...77
Table 4.6. (Study II):Subject characteristics………...102
Table 4.7. (Study II): Multiple regression models examining the associations between thigh composition and CRF, and objectively measured daily PA, controlling for age and BMI, in pre-menopausal, overweight and obese women………..103
Table 5.8. (Study III):Baseline and 16-month characteristics, in the total sample and by intervention group: comparison group (Comp. Group), monthly meetings group (M.M. Group) and monthly meetings+structured PA group (M.M.+SPA Group). P-value of the differences from baseline to 16-months (t-test and Wilcoxon signed ranks test)…….127
Table 5.9. (Study III): Linear regression analysis (unstandardized beta) for the alterations in the selected dependent variables and changes (0m-16m) in all others variables...130
Table 7.10. (General Conclusion):The main contribution from chapter 3...149
Figures
Figure 1.1. (General Introduction): The study of human body composition. Adapted from Wang et al. (1992)...………..…...4
Figure 1.2. (General Introduction):The five levels of human body composition. Adapted from Wang et al (1992)………...5
Figure 1.3. (General Introduction): Relations between total body SM and regional SM distribution. Adapted from Kim et al. (2002)………...6
Figure 2.5. (General Methods): Integrated three dimensional representation of thigh composition showing SM tissue, TSAT and TIAT volumes..………...57
Figure 3.6. (Study I): Linear regression for SM and SMHU estimation using the reference method (CT) and the respective calibration models with DXA and anthropometry variables (A) and regression between prediction errors against predicted scores (B). The solid lines represent the mean differences between the reference method and the developed equations, and the dashed lines represent (1.96 SD) confidence intervals (B)………...………...79
Figure 3.7. (Study I):Linear regression for TTAT, TSAT and TIAT estimation using the reference method (CT) and the respective calibration models with DXA and anthropometry variables (A) and regression between prediction errors against predicted scores (B). The solid lines represent the mean differences between the reference method and the developed equations, and the dashed lines represent (1.96 SD) confidence intervals (B)………...………...81
Figure 4.8. (Study II): Mean Z score (continuous variable) of thigh composition for tertiles of maximal oxygen consumption (mL/kg/min). One-way ANOVA with the post-hoc analysis of Bonferroni were used for the comparison of means between tertiles (1st vs 3rd, *** P<0.05; 1st vs 2nd, ¥ P=0.061)………...104
Figure 4.9. (Study II): Mean Z score (continuous variable) of thigh composition for tertiles of total daily PA (total counts). One-way ANOVA with the post-hoc analysis of Bonferroni revealed no differences between tertiles (P>0.05)………...105
Figure 5.10. (Study III):Consort diagram...121
Abbreviations List
AT – Adipose tissue
BCa - Bias corrected and accelerated
BMI – Body mass index
CRF – Cardiorespiratory fitness
CT – Computed tomography
DistalTCirc – Distal thigh circumference
DXA – Dual-energy X-ray absorptiometry
EMCL – Extramyocellular lipid content
FFM – Fat-free mass (DXA)
FM – Fat mass (DXA)
FMLl – Lower limbs FM (DXA)
HD – Haemodyalisis
HipCirc – Hip circumference
HRR – Heart rate reserve
HU – Hounsfield units
ICC – Intraclass coefficient of correlation
IMCL – Intramyocellular lipid content
IPAQ - International Physical Activity Questionnaire
LST – Total body lean soft tissue mass (DXA)
LSTLl – Lower limbs lean soft tissue (DXA)
MET – Metabolic equivalent
MRI – Magnetic resonance imaging
PA – Physical activity
SD – Standard deviation
SEE – Standard error of the estimation
SM – Skeletal muscle
SMHU – Skeletal muscle quality quantified by Hounsfield units
SS – Sum of squares
T2DM – Type 2 diabetes mellitus
TEM – Technical error of measurement
TIAT – Thigh intermuscular adipose tissue
TSAT – Thigh subcutaneous adipose tissue
TTAT – Total thigh adipose tissue
VO2max – Maximum oxygen uptake
CHAPTER
1
General Introduction
“The beginning of knowledge is the
discovery of something we do not
understand.”
Introduction to the Thesis
With the worldwide increase of obesity epidemic and its associated comorbidities, the
treatment of this population became imperative. The accurate assessment of body
composition changes in association with other health indicators, namely physical fitness
and physical activity (PA) levels, before and after weight loss interventions, will allow a
better understanding of the impact of different approaches to obesity treatment. The
general aim of the current Thesis was to address this important issue within the scope of
weight loss interventions in overweight and obese women.
More precisely, this Thesis was developed within the context of P.E.S.O. program
(Promotion of Exercise and Health in Obesity), at the Faculty of Human Movement,
between 2002 and 2004. P.E.S.O was a community program, empirically-based on the
cognitive-behavioural approach, targeted to promote healthier lifestyles through PA and
nutrition, in overweight and obese premenopausal women.
The present Thesis is based on independent research articles submitted or in press, in
peer-review scientific journals with a recognized ISI Impact Factor. Despite the
advantages, this format increases the risk of redundancy throughout the written
document. So, to avoid repetition, the following structure was adopted:
- The general introduction is presented in Chapter 1, reviewing skeletal muscle (SM)
and adipose tissue (AT) quantification by imaging methods state of the art, with special
emphasis on thigh composition tissues, namely SM tissue and quality, as well as AT
compartments, focusing methods to assess body composition at the tissue-organ level,
such as computed tomography (CT) and magnetic resonance imaging (MRI). The
obesity, were also reviewed, in addition to relations between thigh composition and,
fitness and PA indicators, in obese subjects, before and after weight loss.
- In Chapter 2 is offered a detailed description of the methods used in the current
Thesis.
- Chapters 3, 4, and 5 present the original research contributions. In Chapter 3 it was
addressed body composition methodology, through the development and validation of
predictive equations for total thigh composition assessment, in pre-menopausal
overweight and obese women, with dual-energy X-ray absorptiometry (DXA) and
anthropometry-based prediction models using CT as the reference method. The
associations, at baseline, between cardiorespiratory fitness (CRF) and daily PA, with
thigh composition volumes determined by CT were analyzed in Chapter 4. In Chapter
5, a longitudinal design allowed the investigation of the effects of a weight-loss
intervention on thigh composition, CRF, and daily PA in premenopausal overweight
and obese women.
- Based on this original scientific research, Chapter 6 discusses these findings within
the range of the areas of body composition methods and alterations, and its
interrelations with fitness and PA.
- Finally, in Chapter 7 it is presented a summary of the main findings of this Thesis.
The Study of Body Composition
The living being’s composition reflects net baseline accumulation of several substrates
and nutrients acquired from the environment and retained by the body, empowering life.
techniques allow researcher
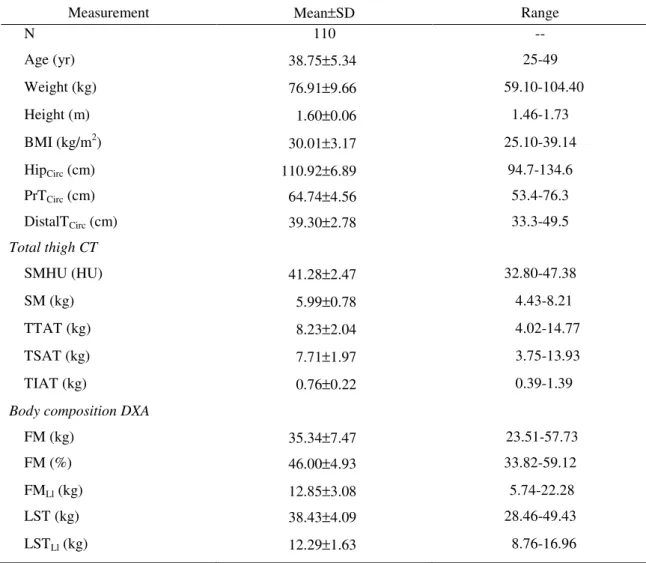
The science of human bod
body composition rules and
and interrelations between
available methods for in viv
composition variation (cent
or pathological conditions),
Taking into consideration
research studies, are include
variation areas.
Figure 1.1. Th from Wang et al
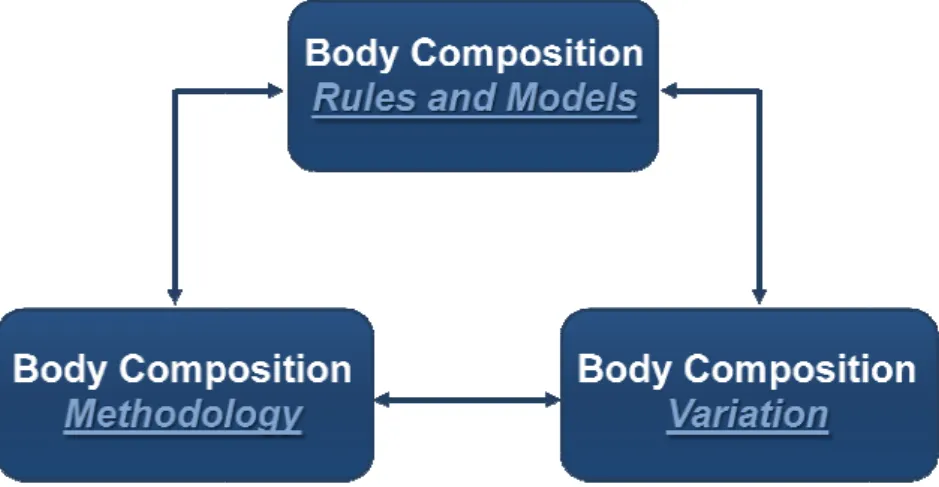
The Five-Level Model o The central model in body
mass is considered as the s
integrated, levels of increa
and whole body [1], as pres
region of interest, and CT
hers to study how these building blocks functi
ody composition is organized into three intera
and models (involves the components themsel
en them), body composition methodology (
vivo and in vitro quantification of body compon
enters on the changes in body composition relat
s), as showed in Figure 1.1.
n these three areas, the current Thesis, and
uded in body composition methodology and bo
The study of human body composition. Ada t al. (1992) [1].
l of Body Composition
y composition research is the five-level model
e sum of all components from five distinct an
reasing complexity: atomic, molecular, cellula
resented in Figure 1.2. Considering this model,
T as the main body composition assessment t
ction and change.
eracting areas [1]:
selves, definitions
(focuses on the
onents), and body
lated to biological
d particularly the
body composition
dapted
del, in which body
and separate, but
lular, tissue-organ,
el, the thigh as the
current Thesis, special scope will be focused at the tissue-organ level, particularly on
SM tissue and AT.
Skeletal Muscle Tissue
The presence of muscle in the body occurs in three distinct forms: skeletal, smooth, and
cardiac. Whole body SM mass is influenced by several modifying biological factors
such as gender, age, ethnicity, physical activity, and disease [2].
Figure 1.2. The five levels of human body composition. Adapted from Wang et al (1992) [1].
In adult humans, SM, also known as striated or voluntary muscle, is the largest
component of body composition at the tissue-organ level, representing approximately
30% to 40% of the body mass of a healthy 58-kg woman or a 70-kg man, as showed by
cadaver dissection [3].
Atomic Molecular
Cellular Tissue
Whole-Body
Oxygen N, Cu, P, K,
Minerals
Other
Hydrogen
Carbon
Water Lipid Protein
Cells Extracellular
Fluid
Visceral Organs
Bone
Adipose Tissue Skeletal
Muscle
Head
Trunk
Arms and Legs Adipocytes
Myocytes Extracellular
Solids
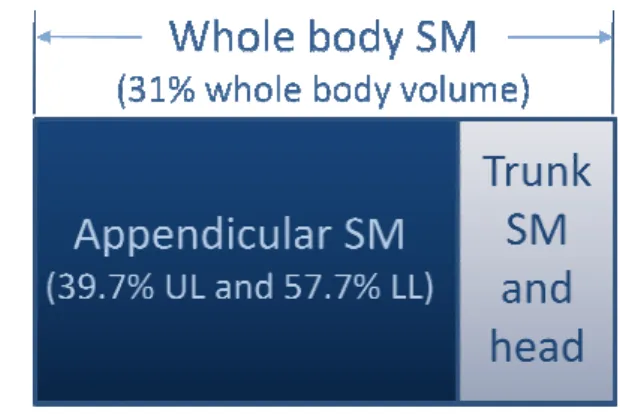
The Visible Human Project
woman study, allowed the q
images of the major body ti
analysis, it was observed t
volume (25.6%), as well
respectively). In the trunk
(27.3%), while SM represe
the relations between total b
1.3.
Figure 1.3. Rela SM distribution. from Janssen et a
The cross-sectional analysis
body weight was 38% in m
what concerns SM distrib
absolute and relative terms
versus 42.9%, respectively)
SM mass (12.2 versus 18.1
results indicate that women
extremities in comparison to
The discrepancies between
ect of the National Library of Medicine, specifi
e quantification of body composition based on
tissues of a woman cadaver [4]. As a result of
d that SM was the second major contributor
ell as in the upper and lower limbs (39.2
unk region the second greatest component
sented the third component (21.4%). A graphi
al body SM and regional SM distribution is pres
elations between total body SM and regional n. Adapted from Kim et al. (2002) [5], and
al. (2000). UL, upper limbs; LL, lower limbs.
sis of whole body MRI [6], revealed that SM
men and 31% in women. The same authors o
tribution, women showed lower upper body
s when compared to men (8.4 kg versus 14.1
ly), while in the lower body women presented
8.1 kg) but higher relative SM (57.7% versus
en have a larger proportion of their total SM
n to men.
en women SM results in Janssen et al. [6] and
ifically the visible
n MRI segmented
of the tissue-organ
or of whole body
9.2% and 37.9%,
nt was remainder
phic illustration of
resented in Figure
al d .
M mass relative to
s observed that, in
dy SM, either in
4.1 kg, and 39.7%
ted lower absolute
sus 54.9%). These
SM in their lower
the researchers, and also by the sample size, because the data on the visible woman
represent only one subject, and as consequence a bias enlargement may occurred.
Traditionally, CT has been used to quantify areas of SM, either by planimetry or by
measuring the muscle area within a specific range of attenuation values (-29 to +150
HU – Hounsfield units)[7]. With this type of procedure, CT has been able to estimate
the SM component of a region of interest excluding the visible AT, in and around
muscle, providing more precise measurements [8]. In addition, the analysis of the
attenuation characteristics of SM has provided information on the quality of the SM: a
reduced muscle attenuation was interpreted to reflect an increased lipid component
within muscle [9, 10]. This concept seems intuitive because as AT is negative on CT
HU, an increase in muscle lipid content will reduce the attenuation of SM. The findings
of a reduced muscle attenuation are consistent with an increased muscle lipid content
determined histochemically [11, 12].
Accordingly to Mitsiopoulos et al. [7], considering tissue density, two types of SM can
be distinguished, the first related to muscle tissue that includes interstitial AT,
“anatomic SM”, and the second specifically related to AT-free SM. Based on SM
attenuation coefficients, several authors [13, 14] proposed a distinction between the two
SM components: high density or normal density SM tissue (from +31 to +100 HU) and
low density SM tissue (from 0 to +30 HU, representing lipid-rich SM, which includes
fat components between and inside the muscle fibers). Other authors [7] proposed a
different HU range for low density SM which includes HU from -29 to +30 HU.
Several changes occur in SM and its compartments, influenced by age and disease.
Increasing age is associated with the loss of SM mass and function, and this occurrence
loss). As a consequence of individual differences in peak SM mass and the rate at which
SM decreases, SM mass varies widely in older adults [15].
Evidence from cross-sectional studies revealed that relative SM mass reduction seems
to start in the third decade, while absolute SM mass seems to be fairly stable, on
average, up to the end of the fourth decade, after which there are accelerating rates of
loss in both genders - sarcopenia [6]. Longitudinal studies with CT measurements that
have examined changes in SM mass or size obtained similar results, and allowed the
estimation of a mean decrease in SM of approximately 6% per decade [16, 17].
As age progress, the rates of loss are greater for lower-body and thigh muscle than for
upper-body and arm muscle [6]. The greater loss of SM in the lower body could be
associated with the reduction in SM strength in the lower extremities [18, 19], and with
the age related reduction in PA [20, 21], whom, as consequence, may contribute for the
regional differences in sarcopenia. Accordingly to Janssen & Ross (2005) [15], it is
reasonable to assume that a decline in PA would primarily be associated with a
decreased use of lower body muscles, given that the muscles used for most common
activities (i.e., walking, climbing stairs) are located in the leg and thigh. Considering the
strong influence SM has on bone mineral density [22, 23], the increased prevalence of
osteoporosis, particularly at the femoral neck, may be partially explained by the lower
SM mass [6].
Besides the elderly, sarcopenia assumes particular interest in SM wasting diseases, such
as haemodyalisis (HD) and HIV-infected patients. Subjects who underwent dyalisis
treatment for chronic kidney disease exhibited more functionally significant SM
wasting, determined by CT, than chronic kidney disease patients who were in a previous
disease stage without HD. Furthermore, the reduction in SM cross-sectional area was
measures of physical performance [24]. Loss of SM mass and limitations in activity
have been reported in HIV patients, but Scott and colleagues [25] found that although
impaired ability to activate knee extensors was associated with weakness and decreased
specific force, the reduced central activation was not related to CT SM cross-sectional
area. The authors suggest the possibility of different mechanisms contributing to SM
impairment rather than atrophy, which reinforces the need for further research with
larger and more diverse population in order to understand the nature and implications of
these findings. Its importance relies on the fact that SM atrophy may be prevented with
targeted exercise and/or improvement of other factors such as medication and
nutritional factors.
The exact cellular and molecular mechanisms for the age-related loss of protein are not
yet fully elucidated, but they are probably highly complex and involve multiple
mechanisms, such as: impairments in neuromuscular function, alterations concerning
the systemic environment (such as, testosterone, growth hormone/insulin growth
factor-I axis, thyroid hormones, catecholamines and cytokines), and alterations intrinsic to the
SM (myogenic regulatory factors, notch signaling pathway, myostatin and intracellular
calcium) [26].
Age-related changes also take place in the composition of SM, reflecting an
enlargement in SM lipid infiltration with increasing age, revealed through the
measurement of CT attenuation coefficients in the thigh region [27-30]. This was
observed even when changes in physical function were not detected, suggesting that
dynamic remodeling of soft tissues occurs even in healthy, ambulatory, weightstable
elderly subjects [31]. Similar findings were verified regarding the absence of mediation
effects of several muscle parameters (including SM density) between PA and mobility
functional ability, as proposed by Visser et al. (2005) [28], who found that a greater fat
infiltration into SM contributed to an increased risk of mobility loss in older men and
women.
A greater lipid infiltration of SM is also related with increasing obesity, and is more
relevant in obese patients with type 2 diabetes mellitus (T2DM) [13, 33-35]. These
changes in lean-tissue density are due to an increased volume of lean tissue with
attenuation values below the normal range for SM (<+31 HU). Despite the increase in
low density SM in obesity, the volume of normal density SM (>+30 HU) seems to be
unaffected, and varies relatively little among those subjects [13, 14, 34]. This occurred
regardless of pronounced differences in body composition and overall midthigh volume.
Insulin-stimulated glucose disposal was positively correlated with SM attenuation, in
caucasian men and women, ranging from lean to obese (body mass index -BMI
19.6-41.0 kg/m2) [9], and with insulin resistance in obese non-diabetic asian-pacific subjects
[36]. Independently from total body adiposity, the area of low density SM revealed
negative associations with insulin sensitivity, both in men and women, even after
controlling for age. Furthermore, the area of low density SM accounted for 30% of the
variance in insulin sensitivity, while the area of normal density SM was not associated
with this parameter [13, 34]. So, it seems that low and normal density SM might have
different metabolic implications thus requiring further investigation in different age
groups and health conditions.
Other authors found associations indicating that lower SM attenuation determined with
CT represents increased lipid content within muscle [13], supporting the association
between the triglyceride content of skeletal muscle and insulin resistance, independent
of obesity [37]. Recently, a set of clinical experiments with T2DM and obese non-DM
stores producing results in the soleus muscle that are moderately correlated with the use
of magnetic resonance spectroscopy as the reference method [38]. However, further
testing in other SM groups, e.g., thigh SM, is warranted.
In healthy individuals, bone and muscle develop in harmony with the change in weight,
but this adaptive physiological mechanism may be impaired in some older individuals
that combine SM loss with obesity, determining a combination of excess weight and
reduced SM mass and/or strength, defined as sarcopenic obesity [39, 40]. Considering
the age-related changes in body composition, obesity and low SM mass (or strength), it
is possible that they could coexist in the same subject simply by chance, but it is
reasonable to hypothesize that they may be pathophysiologically connected. The
imbalance between obesity and SM impairment, either defined by low SM mass or poor
muscle strength, is associated with important negative health outcomes in older
individuals [40, 41]. Epidemiological studies suggest that this syndrome is related to
accelerated functional decline and high risk of diseases and mortality [28, 42] and, that
when obesity and muscle impairment co-exist they act synergistically on the risk of
developing multiple health related outcomes [43, 44], making the identification of these
patients an essential goal in clinical settings. As a consequence, early screening starting
in the fourth decade of life might be advised in order to identify subjects at risk for
sarcopenic obesity and allowing for preventive measures to be implemented, before old
age is reached.
Adipose Tissue (AT)
AT is a heterogeneous compartment consisting of adipocytes, extracellular fluid, nerves,
and blood vessels. These components are dispersed throughout the body with varying
Accordingly to Shen et al. (2003) [49], AT can be divided into several components: the
two main measurable components are subcutaneous and internal AT. Subcutaneous AT
is defined as the layer found between the dermis and the aponeuroses and fasciae of the
muscles, including mammary AT. Internal AT can be divided into visceral and
nonvisceral components, and among this last component some small AT regions are
specially named. That is the case of intramuscular AT, considered as the AT within SM
fascicles, and of perimuscular AT, which is the AT inside the muscle fascia. The
perimuscular AT is composed by intermuscular (between muscles) and paraosseal (in
the interface between muscle and bone) AT. These small depots are difficult to measure:
the perimuscular AT depots are small and not always visible when images are collected
by CT or MRI acquisition, while the in vivo intramuscular layer can only be inferred
from the attenuation coefficients of SM tissue. An adaptation of the proposed
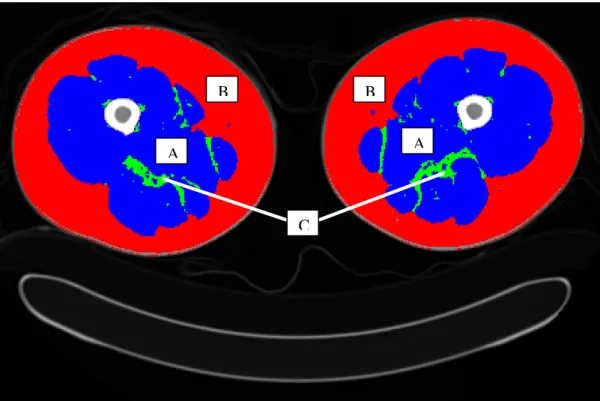
classification of AT by Shen et al. (2003) [49] is presented in Table 1.1, and a CT image
of an axial plane of both thighs is showed in Figure 1.4.
Table 1.1. Classification of adipose tissue (AT) focusing on nonvisceral AT.
Adipose tissue compartment Definition
Total AT Sum of AT, usually excluding bone marrow and AT in the
head, hands, and feet.
Subcutaneous AT The layer found between the dermis and the aponeuroses
and fasciae of the muscles. Includes mammary AT.
Internal AT Total AT minus subcutaneous AT.
Nonvisceral internal AT Internal AT minus visceral AT.
Intramuscular AT AT within a muscle (between fascicles).
Perimuscular AT AT inside the muscle fascia (deep fascia), excluding
intramuscular AT.
Intermuscular AT AT between muscles.
Paraosseal AT AT in the interface between muscle and bone (e.g.,
AT is distributed throughout the human body and the pattern of distribution is
influenced by many factors, including sex, age, genotype, diet, PA level, health status,
and others conditions [13, 50-52]. As observed by cadaver dissection in the reference
man study [3], AT represents approximately 21%, about 15 kg of body weight of a
healthy 70-kg man. According to these authors, in men about 11% of total body is
composed by subcutaneous AT, 7.1% is considered as “other separable” AT, 1.4% as
interstitial AT, and 2.1% as yellow marrow (included with skeleton) AT.
Figure 1.4. Axial plane of both thighs on a typical resolution CT scan. (A) Skeletal muscle tissue; (B) Subcutaneous adipose tissue; (C) Intermuscular adipose tissue.
The visible woman project [4], based on whole body MRI segmented images of a single
female cadaver, revealed that subcutaneous AT presented the largest section of body
volume (37.5%), followed by SM (25.6%), remainder (21.9%), head and neck (6.7%),
visceral AT (5.2%), and lung (3.1%). Similarly, subcutaneous AT was the largest
compartment in each region: 37.4% of trunk volume, 43.4% of upper limb volume, and
45.7% of lower limb volume. Remainder represented 27.3% of trunk volume, while
B B
A A
visceral AT and lung were the minor contributors of this body region volume (8.7% and
5.2%, respectively).
Sexual dimorphism was observed [53], with the use of whole-body MRI, indicating that
total AT was significantly smaller in men when compared to women (18.8 ± 8.1 L
versus 25.2 ± 11.9 L). Ethnic differences were found with MRI assessment, indicating
that total AT was lower in African-american men than in Asian men, after controlling
for age, height, weight and gender [54]. The same study revealed no ethnic differences
for total AT in women.
Different health conditions may also influence total AT, as observed by Gallagher et al.
[55], accordingly to which T2DM women presented less total AT than non-diabetic
controls, while men with T2DM showed more total AT than controls. These results may
indicate sex-specific differences in total adiposity in response to metabolic alterations.
Because total AT represents the sum of different AT depots, the implications of
between-group differences in total adiposity should be considered in regard of the
differences observed in its subdepots, reinforcing the relevance of measures of AT
distribution in order to understand regional adiposity contribution.
Only in the last decades, AT distribution within the thigh, whether it’s subcutaneous or
located beneath the fascia, adjacent or inside SM, started to be investigated as ectopic
depots of AT. The specific components that have been studied include subcutaneous AT
(TSAT), intermuscular AT (TIAT), and intramuscular AT. This last component can
only be inferred from SM density analysis, by means of the HU values, as previously
referred, so it will be indicated as SM density or quality and it has already been
addressed.
In what concerns total subcutaneous AT, cross-sectional data indicate that, although
decreases with advancing age, after approximately 35 years of age [53]. Differences
between genders were observed with females presenting larger subcutaneous AT across
the entire age range (23.7 L versus 16.5 L), representing approximately 94.0% and
87.8%, in women and men, respectively, indicating clear gender differences in AT
partitioning. Similar results had already been observed with a single CT slice at
midthigh, showing greater subcutaneous AT area in women than in men [13].
Accordingly to Shen et al. [53], in both genders, a smaller slope of the regression line
between subcutaneous AT and age was found over the age of 50 years when compared
with younger subjects, suggesting a decreased influence of the subcutaneous AT
compartment in older ages [53]. More precisely, in women, subcutaneous AT was larger
with increasing age before the age of 35 years and was smaller with increasing age after
the age of 35 years, after adjustment for total AT and ethnicity.
When menopause status was taken into account, Shen et al. [53] observed an association
between subcutaneous AT and age in premenopausal women, while in postmenopausal
females no connection was found between the same variables. When pre and
postmenopausal subjects were pooled together, menopausal effects were no longer
significant, either as an individual term or as interactions with age. These results suggest
that age and subcutaneous AT relationships should be considered when screening is
performed in premenopausal women.
It is important to note that the sample used by Shen et al. [53] only included healthy
subjects and the mean BMI was of 25.6±3.7 kg/m2 and 25.5±5.4 kg/m2 in adult males
and females, respectively. Whether the inclusion of obese individuals in the study might
have induced changes in the results, particularly if AT partitioning was considered as a
Yim et al. [54] found ethnic differences in subcutaneous AT, more precisely when
Caucasians, African-americans and Asians were compared. Asian men and women
revealed significantly less total subcutaneous AT than Caucasians and
African-americans, after adjustment for age, gender, and total AT. Identical results were
observed for femoral-gluteal subcutaneous AT [54].
Subcutaneous AT in the thigh represents the majority of total thigh AT area, comprising
nearly 90%, either in lean, obese glucotolerant, and obese T2DM subjects [13].
Similarly to total subcutaneous AT, women showed greater subcutaneous
femoral-gluteal AT than men [13].
Different health conditions may also be characterized by distinct subcutaneous AT
distributions. Whole-body MRI revealed that subjects with T2DM presented
significantly less total subcutaneous AT, including a lesser amount of femoral-gluteal
subcutaneous AT, than control subjects [55]. Previous studies with obese subjects based
on a single CT slice at midthigh reported greater areas of subcutaneous AT in obese
glucose tolerant and obese type 2 diabetic subjects than in their lean counterparts [13].
A negative association was found between midthigh subcutaneous AT area and glucose
tolerance indicators, in women, suggesting that increased thigh AT lipid content was
associated with better glucose tolerance.
Accordingly to Kelley et al. (1991) [14], the analysis of midthigh CT scans in obese
middle-aged males, revealed that increased AT and SM tissue contributed two-thirds
and one-third, respectively, to increased thigh volume. Furthermore, the increment in
SM verified in the obese was due to an increased volume of SM, with attenuation values
below the normal range for SM, which enlarged in a reciprocal relationship with
increasing obesity. Despite the increase in low density SM, the volume of normal
In a multiethnic sample, femoral-gluteal subcutaneous AT was inversely associated with
insulin and triglyceride concentrations, suggesting a negative relationship between these
metabolic risk factors and subcutaneous AT located in the thigh region [54]. Previous
reports by Snijder et al. [56] indicated that larger subcutaneous thigh AT was
independently associated with more favorable blood glucose (in men) and lipid levels
(in both genders), which is in agreement with the findings of Goodpaster et al. [57] who
found that subcutaneous AT in the thighs of obese men and women was associated with
a lower prevalence of the metabolic syndrome.
These results suggest that femoral-gluteal subcutaneous AT may have a protective
effect on metabolic risk factors but the mechanisms thought to be involved in the
protectiveness in relation to insulin resistance and cardiovascular disease are not fully
clarified. Some authors suggest that femoral-gluteal AT may act as a reservoir for
circulating non-esterified fatty acid [58]. Due to its lipolytic activity, with a relatively high lipoprotein lipase activity, subcutaneous thigh AT [59, 60] is more likely to take up
non-esterified fatty acid from the circulation, protecting other organs against a higher exposure. Simultaneously, subcutaneous femoral-gluteal AT presents a low rate of fatty acid release [58, 61]. This way, ectopic fat storage is prevented, leading to a lower risk of insulin resistance [58, 62]. Another hypothesis is that there could be also regional differences in adipokines secretion, namely in subcutaneous thigh AT, that might contribute to the associations of this AT depot with glucose and lipid levels [56].
Regarding TIAT, several research studies quantified this component with the use of a
single-CT slice measurement [13, 33], or by whole body MRI [63]. Comparisons of CT
and MRI for TIAT data with corresponding cadaver analysis showed a high correlation
(r=0.92) for leg and arm [7]. Gender comparison revealed that men showed
Accordingly to Goodpaster and colleagues [13], TIAT represented approximately 1.1%
(1 cm2) of thigh AT in lean subjects, 3.1% (5 cm2) in obese glucose tolerant individuals,
and 5.7% (9 cm2) in obese diabetic patients, showing an enlargement in TIAT with
increasing BMI and in T2DM. In what concerns obese subjects, similar results were
obtained by the same authors in another study [33] showing TIAT absolute and relative
contributions of 4.6 cm2 and 3.0%, respectively.
Ethnic differences were observed in this thigh component revealing that with increasing
adiposity, African American women and men accumulate greater deposits of TIAT than
do whites or Asian females and males, and the difference grow across the range of total
AT [63]. Asians showed TIAT levels similar to those of whites, but because they
present higher amounts of total AT, they obtained, too, the highest proportion of total
body AT as TIAT. So, an ethnic difference occurs for TIAT, and because of its location
surrounding SM, it is possible that it will have implications in glucose regulation,
suggesting that this type of AT distribution could interact with ethnicity in metabolic
risk [63].
Concerning health implications of TIAT, it was showed that this distribution of AT
deposition estimated by CT was an important body composition determinant of insulin
resistance in obesity and T2DM. Specifically, TIAT was highest in obese DM, and
although it accounted for only <3% of thigh AT, it was a strong marker of insulin
sensitivity [13]. These results were confirmed by those of Larson-Meyer et al. [38],
who, in addition, found that a 1-kg increase in body fat mass (FM), either in T2DM or
in obesity, was associated with a 0.5-1.0 cm2 increment in TIAT.
Findings obtained through MRI assessment performed in the whole body corroborated
CT data, indicating that more TIAT was found in T2DM than in healthy non-T2DM
to be involved in the pathogenesis of insulin resistance, as shown by the significant
negative correlation with the glucose infusion rate in both women and men (r=-0.43 vs.
r=-0.40, respectively) [64]. Yim et al. [65] obtained strong independent associations of
TIAT, derived by MRI, with fasting glucose (P<0.001) and protein bound glucose
(P<0.001), suggesting that TIAT may be related to glucose metabolism in Caucasian
and African American healthy individuals; however, TIAT was also associated with
total cholesterol in Caucasian. Furthermore, another research of the same group [45]
revealed that although femoral-gluteal TIAT distribution varies by sex and ethnicity
(Asian and African-American men had greater femoral-gluteal TIAT than Caucasians,
adjusted for age and TAT), it presented an independent positive relationship with
cardiovascular disease risk factors.
Some authors consider that AT interspersed around SM my impair muscle blood flow,
reduce insulin diffusion capacity, or increase local concentrations of fatty acids, all of
which have been shown to be associated with insulin-resistant glucose metabolism in
SM [66-68]. Further, it has been suggested that an increase in TIAT contributes to
insulin resistance through enhanced rates of lipolysis within SM [69]. Accordingly to
other researchers, one possible explanation about the probable mechanism of action
linking TIAT with insulin signaling is through triacylglycerol metabolites interfering
with insulin signaling transduction, thereby altering whole body glucose and lipid
metabolism [63]. These findings reveal that, although an association exists between
TIAT and insulin resistance, controversy on the possible biological causes of these
association remain, indicating the need of future research.
In what concerns thigh AT location and its metabolic implications, further research is
warranted, particularly with longitudinal approaches, either in different ethnic groups,
Body Composition Assessment
The demands of the scientific community to estimate AT as a useful predictor of risk
development of chronic diseases (such as ischemic heart disease, and
non-insulin-dependent diabetes) has contributed to the increase of methods to measure this body
tissue. Conversely, until recently, the assessment of SM tissue has been limited, but the
increased awareness of the significance of developing and maintaining SM mass has
stimulated the focus on approaches for the in vivo estimation of this metabolically active
body component, reflecting multidisciplinary interests. Nevertheless, SM mass remain a
difficult or impractical body component to accurately quantify in living humans.
The most accurate techniques to assess in vivo SM and AT are the two imaging
methods: CT and MRI [70, 71], allowing the identification of tissue-organ components.
MRI will not be addressed in detail in this review due to the fact that is not part of the
methods used in the present Thesis. Inversely, because the molecular and the whole
body levels will be analyzed through dual-energy X-ray absorptiometry and
anthropometry, respectively, these methods characteristics will be referred in the current
literature review.
Computed Tomography (CT)
Originally, CT was used in body composition research to estimate tissue dimensions,
but this technique has been refined to allow the analysis of tissue composition [9, 34,
70, 72]. CT uses ionizing radiation and differences in tissue X-ray attenuation
characteristics to construct cross-sectional images of the body [70]. The X-ray
attenuation is expressed as the linear attenuation coefficient or CT number, which is a
number is expressed in Hounsfield units (HU), on the basis of a linear scale using air
and water as the reference (-1000 and 0 HU, respectively).
Cross-sectional CT images are composed of picture elements or pixels, usually 1mm by
1mm square, each of which has a CT number or HU value on a gray scale, that reflects
the composition of the tissue. The lower the density of the tissue, the lower will be the
HU values for the pixels that make up that tissue [34, 70, 73]. For example, AT density
is lower than that of water, and the CT number for AT pixels ranges from -190 to -30
HU, while for SM ranges from -29 to +150 HU, and for bone tissue from +152 to +1000
HU [7, 74, 75]. These characteristics allow the determination of the tissue area (cm2) for
the different tissues in each cross-sectional image, using a computer-automated
procedure that identifies the area of the target tissue, by selecting pixels within a given
HU range [74].
Through multiplying the number of pixels for a given tissue by the surface area of the
individual pixels, the area (cm2) of the tissue is obtained. If multiple CT images are
acquired, tissue volumes (cm3) can be calculated by integrating cross-sectional area data
from consecutive slices. As tissue densities for AT, SM and organs are fairly constant
from one person to another, CT volume measures for these tissues can be converted to
mass units by means of multiplying the volume by the assumed density values for that
tissue [70]. For example, the assumed constant densities for AT and SM are 0.92 g/cm3
and 1.04 g/cm3, respectively [76].
Additionally, the average HU for SM can be used as an index of SM lipid content: the
lower the average SM HU value (i.e., mean attenuation value), or the greater the number
of low density SM pixels (e.g., <+30 HU), the higher the SM lipid content. But, it is
important to note that, SM attenuation values by CT are not analogous to
spectroscopy, because CT is not capable of distinguishing between these two layers.
Meaning that, SM attenuation determined by CT is a reflection of both intramyocellular
and extramyocellular lipid content [70].
The validity and accuracy of area and volume measurements from CT have been
established by comparing CT measures in human cadavers with direct measures (e.g.,
dissection, planimetry). A good agreement was found between CT and cadaver
dissection for AT areas (correlations ranged from 0.77 to 0.94) [77], SM cross-sectional
areas from the proximal thigh (correlations >0.95) [78], and SM and subcutaneous AT
areas in the arms and legs (correlations from 0.97 to 0.99) [7].
For tissue quality, no comparisons have been made between CT measures of tissue
composition and direct chemical extraction from human cadavers. So, the validity of CT
has been determined by comparing the imaging methods with tissue biopsy samples in
humans. CT-determined SM attenuation characteristics were well correlated with SM
lipid levels determined in muscle biopsy samples, more precisely, between SM
attenuation in the midthigh with SM triglyceride content and oil red O staining of lipid
in muscle fibers, measured in percutaneous biopsy (correlations of 0.53 and 0.43,
respectively) [11, 12, 34]. These results indicate that in vivo determination of SM by CT
is associated with muscle lipid content.
In what concerns the reproducibility of tissue quantity by CT, in general, CT tissue area
and volume are highly reproducible, revealing low coefficient of variation for repeated
CT SM measurements in the thigh (1.4%) [79], and for whole-body AT volume (0.6%)
[74]. Very little is known regarding the reproducibility of the measurement of tissue
quality by CT. Goodpaster et al. (2000) [34] reported that the test-retest coefficient of
CT body composition assessment is being used in multiple-component analysis to
quantify total body and regional AT, SM, bone, liver, and other organ-tissue volumes,
across age groups, and disease states. By this means, is allowing to study the effect of
aging, gender, ethnicity, obesity, weight loss, exercise, inactivity, type 2 SM size and
quality, on associated function and metabolic implications [9, 13, 28, 34, 36, 45, 56, 57,
80]. The majority of these studies have based their observations on a single CT image,
tipically, in the case of the SM, at the midthigh level [70].
Although CT is more accessible than MRI, exposure to radiation limits its use for
multiple-image whole-body tissue quantification, and limits applicability in children
and premenopausal women [81]. Thus, it is common for researchers and clinicians to
use a single image (cross-sectional area, in cm2) for the purpose of estimating whole
body components. Some authors investigated how well the measurement of a single
image could provide estimates of total body SM, AT and intermuscular AT, in healthy
adults, whether its location was in the midthigh or in the abdomen (L4-L5), but due to
ionizing radiation exposure in CT, these studies were conducted only with MRI [82-84].
Lee et al. (2004) [82], observed that thigh measures of SM resulting either from a single
image, or from a succession of 7 consecutive images, obtained by MRI, were better
predictors of whole-body SM, with smaller standard errors of the estimate (SEE), than
abdominal SM measures. Nevertheless, SM in the abdomen was also a strong marker of
whole-body SM which can be useful every time that a routinely abdominal single image
is acquired to estimate FM in the abdomen. Shen et al. (2004) [83], obtained high
correlations between SM and AT areas from a single abdominal slice and the
corresponding total body SM and AT volumes, estimated by MRI. More precisely, these
authors verified that the highest correlation with whole body SM volume occurred with
volume was found with AT area 5 cm below L4-L5, with a relative small influence of
age, sex, ethnicity and prone or supine imaging collection position. Other authors (Ruan
et al., 2007)[84] estimated whole body IMAT volume from single-slice IMAT areas at
different body locations, assessed by MRI, in a multiethnic population. Accordingly to
these authors, midthigh was the near best single predictor in all ethnic groups, with
adjusted R2 ranging from 0.49 to 0.84. When a second and third slice were added, an
increase in R2 occurred (ranging from 0.49 to 0.92), along with a reduction of the
standard error of the estimate, which ranged from 0.15 L to 0.36 L, independently from
menopausal status and degree of obesity. So, although individual applicability of a
single-slice image is limited, the literature indicates that group studies could be
conducted economically using a single cross-sectional SM and AT areas.
Merely a few studies have made a direct comparison between CT and MRI. Engstrom
and colleagues [78] compared SM cross-sectional area measurements in the midthigh of
three cadavers to corresponding MRI images, and found that CT and MRI measures
were highly correlated for each muscle (r=0.81 to 1.00). Two other studies, that
combined a total of 18 subjects, compared CT and MRI measures of subcutaneous AT
and found correlation coefficients ranging from 0.98 to 0.99 [85, 86]. Mitsiopoulos et
al. [7] reported a strong correlation between CT and MRI measures for SM (r=0.97) and
subcutaneous AT (r=0.99), obtained from an arm and leg from each of two cadavers.
These findings indicate that additional research is required to compare CT and MRI
images in larger and more heterogeneous samples regarding age, gender, ethnicity, BMI
status, among others, in order to determine the degree of interchangeability of these
methods in the evaluation of the different tissue-organ components of the body. Only
accept MRI findings (such as those regarding single slice versus multi slice results) to
be used in CT assessments, and vice-versa.
Dual-energy X-ray Absorptiometry (DXA)
Another imaging method used to estimate body composition, not at the tissue-organ
level but at the molecular level, is dual-energy x-ray absorptiometry (DXA). Originally,
DXA was applied to assess bone mineral content and density, but technology has been
refined for the analysis of soft tissue mass [87]. DXA assesses body composition by
measuring the attenuation of X-rays emitted using pencil- or fan-beam technology at
two energy levels as it traverses the body [88]. DXA software allows the distinction
between bone mineral and soft tissue, after which occurs the soft tissue separation into
fat and lean soft tissue (LST).
Beside these estimations, DXA software permit the definition of particular regions of
interest, such as the thigh, providing specific information about bone mineral, fat and
lean soft tissue. Although there is a good agreement between DXA regional body
composition assessments and whole body scans, in the precision found for bone mineral
density, fat, and lean soft tissue mass, regional measurements (lower and upper limbs,
trunk, pelvis, and spine) seem to be less precise than total body measurements [89, 90].
Measures of total and regional fat-free soft tissue mass (coefficient of variation from 1
to 7%) [5, 91, 92] and FM (coefficient of variation from 1 to 7%) [91] using either
pencil- or fan-beam technology are highly repeatable, but results may differ between the
two methods or model types (e.g., Hologic, Lunar, etc.) [93]. Besides to the scanner
type (pencil- or fan-beam), estimations of fat and lean soft tissue mass using DXA are
affected by the software used (algorithms), the sagital diameter, and the hydration status
![Figure 1.2. The five levels of human body composition. Adapted from Wang et al (1992) [1]](https://thumb-eu.123doks.com/thumbv2/123dok_br/16926297.759477/22.892.135.753.441.851/figure-levels-human-body-composition-adapted-wang-et.webp)
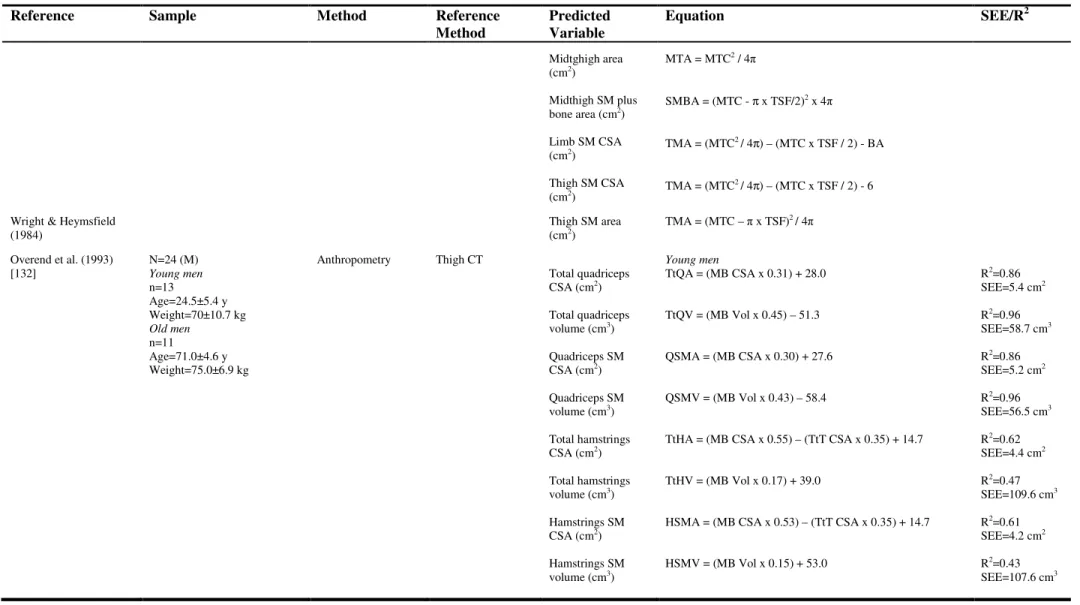
![Table 1.2. Thigh SM tissue prediction equations (continuing). Overend et al. (1993) [132] Total quadriceps CSA (cm 2 ) Total quadriceps volume (cm 3 ) Quadriceps SM CSA (cm 2 ) Quadriceps SM volume (cm 3 ) Total hamstrings CSA (cm 2 ) Total h](https://thumb-eu.123doks.com/thumbv2/123dok_br/16926297.759477/49.1263.61.1139.165.668/prediction-equations-continuing-quadriceps-quadriceps-quadriceps-quadriceps-hamstrings.webp)
![Table 1.2. Thigh SM tissue prediction equations (continuing). Knapik et al. (1996) [134] N=18 (9M; 9F) Age=23±5 y Male n=9 Age=21.0±2.3 y Weight=81.6±7.0 kg Female n=9 Age=25.2±5.5 y Weight=59.6±7.0 kg](https://thumb-eu.123doks.com/thumbv2/123dok_br/16926297.759477/50.1263.75.1155.152.481/table-prediction-equations-continuing-knapik-weight-female-weight.webp)