CHAPTER
3
94 Faculdade de Motricidade Humana – LabES
*Usefulness of different techniques for measuring body
composition changes during weight loss in overweight and obese
women
Cláudia S. Minderico1, Analiza M. Silva1, Kathleen Keller2, Teresa L. Branco1, Sandra
S. Martins1, António L. Palmeira1, José T. Barata1; Elvis A. Carnero1, Paulo M. Rocha1,
Pedro J. Teixeira1 and Luís B. Sardinha1
1
Exercise and Health Laboratory, Faculty of Human Movement-Technical University of
Lisbon, Portugal
2
New York Obesity Research Center, St. Luke's-Roosevelt Hospital, Columbia
University Institute of Human Nutrition
College of Physicians and Surgeons, New York, NY
Running Title: Comparison of Methods in Estimating Fat Mass Changes
Luís Bettencourt Sardinha Exercise and Health Laboratory Faculty of Human Movement Technical University of Lisbon Estrada da Costa
1499-688 Cruz-Quebrada Portugal
Tel: (351) 21 414 91 60
Fax: (351) 21 414 91 93
A
BSTRACTObjective: Compare measures from DXA, BIA, and anthropometry with a reference
4-component molecular model to estimate FM and FFM changes in overweight and obese
women after a weight loss program.
Methods: 48 women (age: 39.8±5.8 y; weight: 79.2±11.8 kg; BMI: 30.7±3.6 kg/m2)
were studied in an outpatient but interventional weight loss program, before and after
16-months. Women attended weekly meetings for the first four months, followed by
monthly meetings from four to twelve months. Body composition variables were
measured by the following techniques: [DXA, Anthropometry (Antrform), bioelectrical
impedance analysis (BIA) using Tanita and BF300] and a reference multi-compartment
model (4C).
Results: Body weight decreased significantly (3.3±3.1 kg) across the intervention. At
baseline and after the intervention, FM, %FM, and FFM assessed by Antrform, Tanita,
FM300, and DXA differed significantly from the reference method (p≤0.001), with the
exception for FFM assessed by Tanita (baseline p=0.071 and after p=0.007). DXA
significantly overestimated the change in FM and %FM across weight loss (-4.5 vs -3.3
kg, p<0.001 and -3.7 vs -2.0%, p<0.001, respectively), while Antrform underestimated
FM and %FM (-2.8 vs 3.3 kg; p=0.043 and -1.1 vs 2.0%, p=0.013), compared to the 4C
model. Tanita and BF300 did not differ (p<0.05) from the reference model in any body
composition variables.
Conclusion: These methods are widely used in clinical settings, but applying them
interchangeably to detect changes in body composition may not produce accurate
results. Therefore, in the clinical settings DXA and Tanita are recommended to assess
body composition changes in weight loss programs.
96 Faculdade de Motricidade Humana – LabES
B
ACKGROUNDThe accurate measurement of body composition is crucial to understanding the
impacts of different types of weight loss interventions on body compartments. Although
impressive advances have been made in the techniques available for measuring human
body composition, due to cost and limited availability, use in clinical practice has been
limited. The most common methods for estimating body-composition changes that are
available to clinicians include dual-energy X-ray absorptiometry (DXA), bioelectrical
impedance analysis (BIA), anthropometry, and the most widely applied, body mass
index (BMI).
At the simplest level, techniques for measuring body composition can assume
that the body is divided into two compartments, fat (FM) and fat-free mass (FFM). The
fat component is of relatively homogeneous composition, but FFM consists of a
heterogeneous mix of water, mineral, protein and additional minor constituents (1, 2). In
order to quantify the amount of FM and FFM, using a two-compartment model, one
must assume that these components exist in a known relationship to each other. For
example, hydrodensitometry, or underwater weighing, assumes known densities of FM
and FFM. By measuring the mass and volume of a subject, one could estimate the
amount of FM and FFM, based on the assumed densities of these compartments. In
clinical practice, however, there is considerable inter-individual variability in the
density of FM and FFM that can affect the accuracy of these measures (1, 2). There are
even within-subject differences, particularly in the proportion of water and mineral in
FFM (2). This variability contributes to the absolute error of these methods.
Because of the changes in FFM and total body composition that can occur
during a weight loss program, multi-compartment models have been developed in
error involved with body composition measurement (3). An early example of this
approach was that of Siri (4) who divided the body into a three-compartment model
comprising of fat, water, and a “fat-free dry substance” (protein plus mineral).
Moreover, four-compartment models, that also take into account the measurement of
body mineral, can further reduce the variability in the density of FFM measurement.
Four-compartment models provide more accurate estimates of body composition than
do other methods, particularly because they require fewer assumptions than do three-
and two-compartment models, and thereby reduce the variability(5) . Despite their
apparent advantages, few studies have used four-compartment models to evaluate
changes in body composition that result during weight loss (6).
Any changes in the assumed constants induce inaccurate FM assessment when
two-compartment models are used. This is the case of body composition measurement
in obese patients, in which changes of DFFM were observed due to an increased
hydration of FFM (7). Within the scope of weight loss this methodological issue
assumes further importance for the use of a reference four-compartment model, because
it is plausible to consider that the composition of FFM change may differ from the
assumed constants in the two-compartment model and may change from subject to
subject.
In addition to the aforementioned applications in a research setting, clinicians
might also benefit from the use of four-compartment models in clinical diagnosis and
patient care. For this use, however, it is critical to define what methods are most
convenient, reliable, and accurate to measure changes in body composition that occur
with weight loss. Only three studies have assessed the validity of different body
composition measures in overweight and obese populations by making comparisons
98 Faculdade de Motricidade Humana – LabES studies used a long-term weight loss program in overweight and obese women with a
wide range of fatness change. Therefore, the aim of the present study was to compare
measures from DXA, BIA, and anthropometry with a reference four-component
molecular model to estimate FM and FFM changes in overweight and obese women
after a weight loss program management.
E
XPERIMENTALM
ETHODSA
DOPTEDSubjects
Subjects were recruited from a community sample for a 2-year weight
management program through newspaper ads, the internet, and announcement flyers.
Inclusion criteria were age greater than 24 years, premenopausal and not currently
pregnant, BMI greater than 24.9 kg/m2, healthy, and not currently taking medications.
After one orientation session, 152 women signed up for the program. During the run-in
phase, four women decided not to participate (reporting new time and scheduling
conflicts), four did not comply with testing requirements and were excluded, three
women found out they were pregnant or decided to attempt pregnancy and were also
excluded, and one subject was found ineligible due to medical reasons (untreated
hyperthyroidism), leaving a total of 140 women who started the intervention. An initial
visit with the study physician ensured that subjects met all medical inclusion criteria.
Participants agreed to refrain from participating in any other weight loss program and
gave written informed consent prior to participation in the study. The Institutional
Review Board of the Faculty of Human Movement, Technical University of Lisbon,
approved the study, described elsewhere (10).
One year after the intervention, 93 women were evaluated but only 48 women
BODY COMPOSITION MEASUREMENTS
Measurements of body composition using each technique were conducted
according to standard procedures. Subjects came to the laboratory, after a 12-hour fast,
and 24-hours without exercise, alcohol or stimulant beverages. All measurements were
carried out in the same morning. In brief, the procedures were as follows.
Anthropometry
Subjects were weighed to the nearest 0.01 kg wearing a bathing suit and without
shoes on an electronic scale connected to the plethysmograph computer (BOD POD,
Life Measurement Instruments, Concord, CA, USA). Height was measured to the
nearest 0.1 cm with a stadiometer (Seca, Hamburg, Germany).
A trained researcher measured circumferences (waist, abdomen) according to the
procedures of Lohman (11). Based on 10 repetitions, the technical error of measurement
(TEM) and intraclass coefficient of correlation (ICC) were 0.37 cm and 1.00 for the
abdominal circumference measured between the appendix xifoid and 0.62 cm and 1.00
for for the waist circumference measured at the umbilical level.
The Trans & Weltman (12) formula was used to estimate %FM, as this measure
it was developed for overweight and obese subjects. The equation for this measurement
is as follows:
%FM = 0.11077*ABCirc-0.17666*Ht+0.14354*Wt+51.03301
where ABCirc is the mean abdominal circumference, [(AB1+AB2)/2], AB1 is the
abdominal circumference measured between the appendix xifoid and umbilical levels
and AB2 is measured at the umbilical level, Ht is height (cm), and Wt is body weight (kg).
BIA
BIA from foot-to-foot, was measured using the Tanita Body Composition
100 Faculdade de Motricidade Humana – LabES measured impedance and calculated body fat. Subjects were measured without shoes,
and in bathing suits. BIA from hand–to-hand was measured using the OMROM BF300
which provides absolute and percentage body fat.
Dual energy X-ray absorptiometry
To estimate FM and FFM, DXA measurements were made with a total body
scanner (QDR-1500, Hologic, Waltham, USA, pencil beam mode, software version
5.67 enhanced whole-body analyses) that measured the attenuation of X-rays pulsed
between 70 and 140 kV synchronously with the line frequency for each pixel of the
scanned image. Following the protocol for DXA described by the manufacturer, a step
phantom with six fields of acrylic and aluminum of varying thickness and known
absorptive properties was scanned alongside each subject to serve as an external
standard for the analysis of different tissue components. The same lab technician
positioned the subjects, performed the scans and executed the analysis according to the
operator’s manual using the standard analysis protocol. Based on ten subjects, the
coefficients of variation in our laboratory for FM and FFM were 2.9% and 1.7 %,
respectively.
4-Compartment model
The 4C model developed by Heymsfield et al. (5) was used as the reference
method. Accordingly, FM was assessed with the following equation:
FM (kg)=[(2.513×BV)-(0.739×TBW)]+[(0.947×Mo)-(1.79×BW)]
where BV is body volume (L), TBW is total body water (kg), Mo is bone mineral (kg),
and BW is body weight (kg).
Calculation of FFM density
(residual is equal to BM minus FM from the 4C model, TBW and Mo) contents of FFM
(estimated as BM minus FM from the 4C model) and densities of TBW, Mo, and
residual, 0.99371 g/cc, 2.982 g/cc, and 1.404 g/cc, respectively,
DFFM= 1 / [(TBW/DTBW) + (Mo/DMo) + (Residual/Dresidual)]
Body Volume
Body volume was assessed by air displacement plethysmograph (BOD POD ,
Life Measurement Instruments, Concord, CA, USA). The use of this method is
described in detail elsewhere (13, 14). Briefly, after voiding the bladder, each subject
was weighed to the nearest gram while wearing a swimsuit. The BOD POD was
calibrated according to the manufacturer’s instructions, and raw body volume (Vbraw)
was determined. The effects of clothing and hair are accounted for by using minimal
clothing, such as a bathing suit, and by compressing hair with a swim cap. Finally,
thoracic gas volume (Vtg) was measured in the BOD POD by using a technique,
common to standard pulmonary plethysmography, called the “panting manouver” (15).
While wearing a noseclip, the subjects breathed through a tube; after two to three
normal breaths, the airway occluded for 3 s at mid-exhalation. During this time, the
subject was instructed to gently puff against the occlusion by alternately contracting and
relaxing the diaphragm.
All measurements were conducted with the BOD POD software version 1.68.
Based on 10 repetitions, the technical error of measurement (TEM) and the coefficient
of variation (CV) for BV were 0.2 L and 0.5 %, respectively.
Total Body Water
An accurate method to estimate TBW is the bioelectrical impedance
102 Faculdade de Motricidade Humana – LabES USA). Before the test, subjects were instructed to lie in a supine position with their arms
and legs abducted at a 45 degree angle for 10 minutes. This impedance spectra was
modelled with the Cole-Cole cell suspension model (16) to derive a theoretical
impedance at zero and infinity frequency, based on a nonlinear curve fitting from the
measured resistance and reactance. Intracellular water (ICW) and extracellular water
(ECW) were predicted from the Hanai mixture theory (17), and TBW was estimated by
the sum of ICW and ECW. To estimate TBW a correlation coefficient of 0.96 between
this method and a dilution method has been reported (18). Using isotopic ratio mass
spectrometry and deuterium in our laboratory, this correlation was found to be 0.94.
Considering 10 repeated measures, the TEM and CV for TBW were 0.47 kg and 1.1 %
respectively.
Bone Mineral
Total body bone mineral was measured using DXA (QDR-1500, Hologic,
Waltham, USA, pencil beam mode, software version 5.67 enhanced whole body
analysis) as described above for FM and FFM. Considering that bone mineral content
(BMC) represents ashed bone, BMC was converted to total body bone mineral (Mo) by
multiplying it by 1.0436 (19). The TEM and CV for BMC in our laboratory were 0.02
kg and 1.6 %, respectively.
Propagation Measurement Error
In the present study we selected ADP to assess BV, DXA to estimate Mo, and
deuterium dilution to estimate TBW. The propagation of measurement errors associated
with the determination of BV, TBW, and Mo can be calculated by assuming that the
Accordingly,
TEM = [TEM2 for effect of ADP on % FM + TEM2 for TBW % FM + TEM2
for Mo % FM] 0.5
using the above equation,
TEM = [0.812 + 0.342 + 0.042] 0.5 = 0.77 % FM from TEM values
From these calculations, the test-retest reliability in the present study was ~ 0.8% FM
units.
Statistical analysis
Data were analysed with SPSS for Windows version 13.0 (SPSS Inc, Chicago).
Descriptive statistics including means ± SD were calculated for all outcome
measurements (age, weight, height, BV, FM, FFM, TBW, Mo, Protein, density).
Simple linear regressions were performed to calculate the relationship between
FM, %FM, and FFM estimated by the reference four-compartment model and DXA,
BIA-Tanita, BIA-BF300, and Antropomethrics. Bias between methods were assessed
with paired T-tests. Independent T-tests were used to compare means within groups for
the body composition variables. Where differences were found between the test
measures and the four compartment model, linear regression models were developed to
determine if the observed differences were explained by variation of FFM density and
hydration. Agreement between methods was assessed (20), including the 95% limits of
agreement. The correlation between the mean of the reference method and the assessed
method with difference between both was used as an indication of trend, i.e, the
difference between the methods varied across fatness levels. Linear regressions were
also performed to assess the relationship between initial body weight and the
104 Faculdade de Motricidade Humana – LabES compartment model and DXA, BIA-Tanita, BIA-BF300, and Antropomethrics. For all
tests, statistical significance was set at p<0.05.
R
ESULTSSubjects characteristics
Baseline and After Intervention
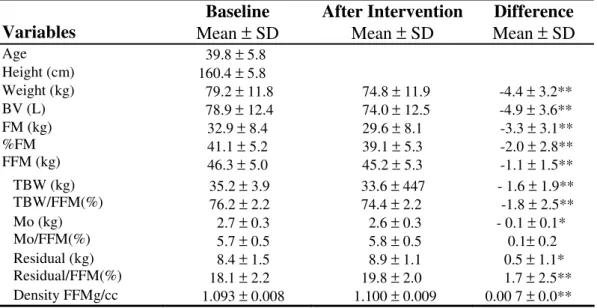
The mean and SDs for the descriptive characteristics are summarized in Table 1.
It is worth mentioning that after the intervention, DFFM was identical to the reference
man (1.1 g/cc). There were no significant differences in Mo/FFM at baseline and after
intervention (0.1±0.2; p=0.096). All the other variables were significantly different
(p<0.05) after intervention,
Table 1: Subjects (n=48) characteristic and body composition (multi-compartment model)
BV, body volume; FM, fat mass; FFM, fat free mass; TBW, total body water; Mo, mineral Osseo (formula)
* Measurements at before weight loss and after weight loss were significantly different, p≤0.05 ** Measurements at before weight loss and after weight loss were significantly different, p≤0.001
The mean and SDs at baseline, after intervention, and respective differences in
FM, %FM and FFM by the indicated methods are summarized in Table 2. When
compared with the reference four-compartment model, FM, %FM, and FFM assessed Variables
Baseline Mean ± SD
After Intervention Mean ± SD
Difference Mean ± SD Age 39.8 ± 5.8
Height (cm) 160.4 ± 5.8
Weight (kg) 79.2 ± 11.8 74.8 ± 11.9 -4.4 ± 3.2** BV (L) 78.9 ± 12.4 74.0 ± 12.5 -4.9 ± 3.6** FM (kg)
%FM FFM (kg)
32.9 ± 8.4 41.1 ± 5.2 46.3 ± 5.0
29.6 ± 8.1 39.1 ± 5.3 45.2 ± 5.3
-3.3 ± 3.1** -2.0 ± 2.8** -1.1 ± 1.5** TBW (kg)
TBW/FFM(%)
35.2 ± 3.9 76.2 ± 2.2
33.6 ± 447 74.4 ± 2.2
- 1.6 ± 1.9** -1.8 ± 2.5** Mo (kg)
Mo/FFM(%)
2.7 ± 0.3 5.7 ± 0.5
2.6 ± 0.3 5.8 ± 0.5
- 0.1 ± 0.1* 0.1± 0.2 Residual (kg)
Residual/FFM(%)
8.4 ± 1.5 18.1 ± 2.2
8.9 ± 1.1 19.8 ± 2.0
by Antrform, BIA-Tanita, BIA-BF300 and DXA were significantly different at baseline
and after intervention (p≤0.001), with the exception for FFM assessed by BIA-Tanita
(baseline, p=0.071 and after, p=0.007).
Changes
All body composition methods presented a significant (p<0.05) decrease in FM
and %FM after intervention. The largest decrease was obtained by DXA that
overestimated FM change (-4.5 vs -3.3 kg, p<0.001 and -3.7 vs -2.0%, p<0.001) when
compared to the four-compartment model. Conversely, the Antrform method
underestimated this variable FM (-2.8 vs 3.3 kg; p=0.043 and -1.1 vs 2.0%, p=0.013).
BIA-Tanita and BIA-BF300 did not differ (p<0.05) from the reference
multi-compartment model in any body composition variable.
Table 2: Body-composition parameters in the sample (n=48) at baseline, after intervention and respective differences.
Variables
Baseline Mean ± SD
After Intervention Mean ± SD
Difference Mean ± SD FM (kg)
Antrform Tanita BF300 DXA
35.5 ± 7.3ª 31.4 ± 8.4ª 29.8 ± 7.4ª 36.8 ± 9.4ª
32.7 ± 7.2ª 28.3 ± 8.2ª 26.7 ± 7.5ª 32.3 ± 9.6ª
-2.8 ± 2.1**b -3.1 ± 3.0** -3.1 ± 2.6** -4.5 ± 3.7**ª %FM Antrform Tanita BF300 DXA
44.5 ± 2.4ª 39.4 ± 4.6ª 37.2 ± 4.1ª 46.4 ± 5.8ª
43.4 ± 2.5ª 37.3 ± 4.9ª 35.3 ± 4.7ª 42.7 ± 6.4ª
-1.1 ± 0.8**b -2.1 ± 2.6** -1.9 ± 1.9** -3.7 ± 3.3**ª FFM (kg)
Antrform Tanita BF300 DXA
43.7 ± 4.7ª 46.9 ± 3.8 49.4 ± 5.4ª 41.7 ± 4.5ª
42.1 ± 4.9ª 46.1 ± 4.2b 48.1 ± 5.3ª 42.2 ± 4.5ª
-1.6 ± 1.2**b -0.8 ± 1.3** -1.3 ± 1.1** 0.5 ± 1.3*ª FM, fat mass; FFM, fat free mass; SD, standard deviation
* Measurements at baseline and after intervention were significantly different, p≤0.05 ** Measurements at baseline and after intervention were significantly different, p≤0.001 ª significant different from changes observed using the reference method (p<0.001)
b
106 Faculdade de Motricidade Humana – LabES Accuracy of Body Composition Changes
The accuracy data of the Antroform, BIA-Tanita, BIA-BF300 and DXA methods
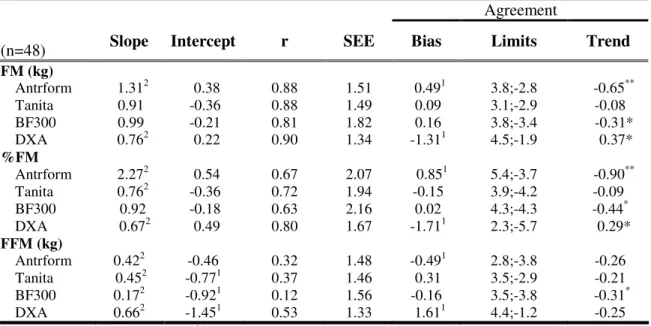
to estimate FM, %FM, and FFM changes is presented in Table 3.
For FM and %FM all intercepts were not different from zero (p<0.05). A similar
result was found for FFM in the Antrform method. For FM, only for the BIA methods the
slopes were not different from 1 (p>0.05), while for %FM only BIA-BF300 was not
different from 1 (p<0.05). All slopes for FFM were different from 1 (p<0.05).
Agreement Analysis
The agreement between the four-compartment model and the other methods is also
indicated in Table 3. A bias was found between the four-compartment model and
Antrform and DXA in all body composition variables. The 95% limits of agreement
ranged from -3.4 to 4.5 for FM, from -5.7 to 5.4 for %FM, and from -3.8 to 4.4 for
FFM. For FM and %FM, a trend was found for the Antrform method, BIA-BF300, and
DXA, i.e. there was a correlation between the mean of each of theses methods with the
four-compartment model and the difference between both.
Table 3. Performance criteria: slope, intercept, coefficient of correlation (r), standard error of estimation (SEE), and the agreement (bias, limits and trend) between FM, %FM, and FFM changes using the four-compartment model as the reference.
Agreement
(n=48) Slope Intercept r SEE Bias Limits Trend
FM (kg)
Antrform 1.312 0.38 0.88 1.51 0.491 3.8;-2.8 -0.65** Tanita 0.91 -0.36 0.88 1.49 0.09 3.1;-2.9 -0.08 BF300 0.99 -0.21 0.81 1.82 0.16 3.8;-3.4 -0.31* DXA 0.762 0.22 0.90 1.34 -1.311 4.5;-1.9 0.37*
%FM
Antrform 2.272 0.54 0.67 2.07 0.851 5.4;-3.7 -0.90** Tanita 0.762 -0.36 0.72 1.94 -0.15 3.9;-4.2 -0.09 BF300 0.92 -0.18 0.63 2.16 0.02 4.3;-4.3 -0.44* DXA 0.672 0.49 0.80 1.67 -1.711 2.3;-5.7 0.29*
FFM (kg)
Antrform 0.422 -0.46 0.32 1.48 -0.491 2.8;-3.8 -0.26 Tanita 0.452 -0.771 0.37 1.46 0.31 3.5;-2.9 -0.21 BF300 0.172 -0.921 0.12 1.56 -0.16 3.5;-3.8 -0.31* DXA 0.662 -1.451 0.53 1.33 1.611 4.4;-1.2 -0.25
1
FFM Hydration and Density
The effect of the FFM hydration and density on the body composition
differences was investigated to determine if it could explain some of the disparities
between body composition measures and the four-compartment model. The body
composition changes were only significantly associated with the differences obtained
between body composition variables from the four-compartment model and DXA
(Hydration, FM: β=-19.3, p=0.039; FFM: β=17.0, p=0.035; Density, FM: β=59.1,
p=0.021; FFM: β=-54.6, p=0.013). All the others differences using the other methods
were not associated with FFM hydration or density.
Relationship between Body Weight Changes and Differences between
Methods
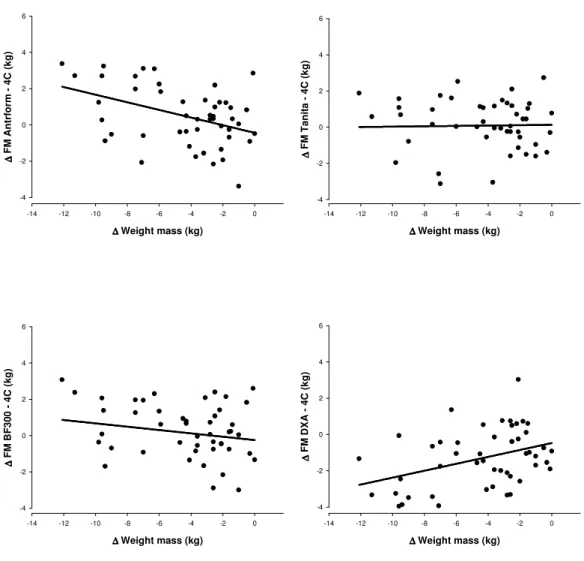
The relationship between the differences in FM using each method and the
reference method is illustrated in Figure 1. A positive correlation was found between
body weight changes and the difference between the reference four-compartment model
and Antrform and DXA (r=0.418, p<0.05 and r=0.386, p<0.05, respectively). Thus, the
more weight subjects lost, the greater the disparity in FM measures from Antrform and
DXA and FM measures from the reference method. The difference between methods
explained 17.5 %FM and 14.9 %FM respectively, by body weight changes during the
intervention. The magnitude of body weight change did not explain the differences
between FM measured from BIA-Tanita and BIA-BF300 and FM from the reference
108 Faculdade de Motricidade Humana – LabES Figure 1. Relationship between body weight changes and the differences between
methods
∆ ∆ ∆
∆ Weight mass (kg)
-14 -12 -10 -8 -6 -4 -2 0
∆ ∆ ∆ ∆ F M A n tr fo rm 4 C ( k g ) -4 -2 0 2 4 6 ∆ ∆ ∆
∆ Weight mass (kg)
-14 -12 -10 -8 -6 -4 -2 0
∆ ∆∆ ∆ F M T a n it a 4 C ( k g ) -4 -2 0 2 4 6 ∆ ∆ ∆
∆ Weight mass (kg)
-14 -12 -10 -8 -6 -4 -2 0
∆ ∆ ∆ ∆ F M B F 3 0 0 4 C ( k g ) -4 -2 0 2 4 6 ∆ ∆ ∆
∆ Weight mass (kg)
-14 -12 -10 -8 -6 -4 -2 0
∆ ∆∆ ∆ F M D X A 4 C ( k g ) -4 -2 0 2 4 6
D
ISCUSSIONThe primary goal of this study was to examine the validity of clinical
body-composition assessment methods for measuring changes in body body-composition across a
16-month intervention program of weight loss using a molecular four-compartment
model as reference. Four-compartment models provide more accurate estimates of body
composition than the other methods used to estimate body composition (21), thus this
study is unique in it’s approach. To our knowledge, only three studies have validated
four compartment model (6, 8, 9), but our study extends these reports by including
additional measures of comparison. The present findings reveal that the mean bias in
estimating FM and %FM changes by Antrform, BIA-Tanita and BIA-BF300 were not
similar when compared to the reference method. As in the cross-sectional data analysis,
DXA overestimated FM and %FM change (1.3 kg, p<0.05, and 1.7%, p<0.05) while
Antrform underestimated FM and %FM changes (-0.5 kg, p<0.05, and -0.9%, p<0.05).
The other two single frequency BIA devices similarly estimated the FM and %FM
changes when compared to the four-compartment model.
These results extend the findings of Evans et al (9) that found no bias in %FM
changes in the diet only and diet plus exercise weight loss groups using BIA.
Conversely, Fogelholm et al (6, 8, 9) found that BIA underestimated the change in FM
when compared with the four-compartment model. However, in this short-term 12-week
weight loss study, it is worth noting that, contrary to expected, FFM hydration increased
from 72.9% from baseline to 75.7% after the intervention, which may explain why
changes in FM and %FM were underestimated when compared with the reference
model. Besides this methodological issue, the authors speculate that TBW may have not
been detected accurately by BIA due to the expansion of the intracellular water
associated with the refeeding weight loss-stabilization period after weight loss, because
the BIA method is essentially dependent on the extracellular pool.
In addition to differences in measuring the change in body composition, baseline
measures of FM and %FM by Antrform, BIA-Tanita, BIA-BF300 and DXA were not
similar to the reference model. Antrform and DXA overestimated FM and %FM while
BIA-Tanita and BIA-BF300 underestimated FM and %FM. Similar results were found
after the intervention. Before weight loss, FFM hydration in the present study was
110 Faculdade de Motricidade Humana – LabES individuals (7). After weight loss, FFM hydration changed to 74.4%. It is important to
note that before weight loss FFM hydration was significantly higher than the assumed
hydration status (73.8%) based on chemical cadavers analysis (22). These results
indicate that women in the present study may have been overly hydrated which would
result in an overestimation of FFM before weight loss. Indeed, our results extend the
results found by Frisard (23) and Carella (24) and are in agreement with the knowledge
that there is large variation in the water content of FFM (25), and that these differences
can lead to an underestimation of FFM with BIA in the dehydrated state and an
overestimation in the overhydrated state (26). These findings may explain the
significant increase in the DFFM after weight loss. No differences were found between
FFM density observed and the assumed FFM density (1.1 g/cc) after weight loss, while
the baseline values were significantly lower.
As extensively documented the pencil beam DXA technology used in the present
study (Hologic QDR 1500W with enhanced software version 5.71) tends to
overestimate FM (9, 27), with an average error that is higher in obese subjects (28). We
also found this trend. As compared with the four-compartment model, at baseline when
subjects were fatter DXA overestimated FM by 3.9 kg, while after weight loss this
difference decreased to 2.7 kg. It has been suggested that “beam hardening” due to
increased body tissue thickness may be explain these differences (29). New fan-beam
technology and algorithms have already improved DXA accuracy to estimate FM (30,
31). The highest correlation coefficient between body composition changes was found
for DXA.
The slopes and intercepts for FM and %FM changes with the two BIA methods
were not different from 1 and 0, respectively, when the four-compartment model was
BIA-BF300. However, considering the data from the agreement analysis, this latter method
had a wide range for the 95% confidence interval and a significant trend, i.e., a
significant correlation between the mean changes with the four-compartment model and
the difference between both. In other words, the fact that there were not differences
between mean FM and %FM changes estimates by the four-compartment model and
BIA-BF300 is due most likely because BIA-BF300 overestimated in subjects that lost
less FM and underestimated in subjects that lost more FM. These results underscore
the notion that this method is not sensitive to track accurately individual across large
changes in body composition.
Results using the Antrform method are in line with the recognition that it is very
difficult for anthropometric methods to be accurate estimating body composition
changes (32). Besides the significant mean bias found for FM and %FM changes with
DXA, this method also presented significant trend in the opposite direction. DXA
overestimated more FM loss in subjects that lost more FM. This finding agrees with the
lower DXA accuracy to estimate in larger FM subjects (28). As depicted in Figure 1,
this was further emphasized by the finding that body weight changes explained 17.5%
the difference between the methods. Similar but opposite results were found with
Antrform. Differences between FM changes with the BIA devices and the
four-compartment model were not associated with the body weight changes. Thus, the
estimate changes are not dependent of the amount of body weight loss.
The effect of the FFM hydration and density on body composition differences
observed using the several methods and the four-compartment model was also
investigated. The findings showed that there were no associations between changes in
FFM hydration and the disparities between the test body composition measures and the
112 Faculdade de Motricidade Humana – LabES density: β=59.05, p=0.021). Our findings are consistent with those obtained by Kohrt et
al (33) that found no influence of FFM hydration changes in assessing small changes of
body composition.
Early work showed that the high precision of DXA for estimation of body
composition components provided the technology to detect very small changes in body
composition (34). Studies in haemodialysis patients and healthy adults have shown that
DXA accurately assessed acute changes in soft tissue (35, 36). DXA also appears to be
a suitable method for assessing body-composition changes in longitudinal studies (23,
37). It is important to note that the conclusions regarding DXA’s ability to correctly
assess FM and %FM may not be applicable to the equipment used in the current
investigation, existing significant differences between manufacturers and software (33,
38).
Although the above findings are based on the assumption that differences
between clinical estimates of FM and %FM from the reference four-compartment model
resulted from error in the alternative method estimation, absolute FM from the reference
model is not without error. It has been suggested that the increased error associated with
the greater number of measurements contributing to FM estimation with the
four-compartment modelmay negate its greater theoretic accuracy (39). The present
investigation and the results from Friedl (40) found, however, that the within-subjects
SD for replicate measurements FMis low (<0.8% of BW) and similar to that derived
with other indirect methods based on fewer measurements, indicating that propagation
of measurement error is not a significant problem. For example, the SEEs for predicting
changes for all group in %FM from the reference method from changes in %FM from
DXA BIA-Tanita, Antrform, and BIA-BF300 were 1.7%, 1.9%, 2.1% and 2.2% of BW,
of the lawof propagation of errors and assuming that the criterion measure is not error
free (TEE for %FM of the four-compartment model: 0.8% of BW), the portion of the
SEE attributable to the clinical method is reduced to1.8% of BW. To detect a true
change in %FM from a weight loss in 95% of individuals, %FM would have to change
by ≥3.2%. Regarding that the propagation of measurement error is nearly 0.8% and that
the mean %FM change obtained by the reference method is of 2.0%, this study agrees
with other authors that highlight the difficulty in accurately assessing small changes in
body composition with clinical methods (9, 41).
C
ONCLUSIONIn conclusion, the findings of this study highlight the fact that methods widely
used at clinical settings, should not be applied interchangeably to detect body
composition changes after a weight loss management program. DXA and BIA-Tanita
were valid methods to detect FM and FFM changes in subjects that lost body weight in
comparison with the reference molecular model. BIA-Tanita with the relevant finding
that was able to track FM changes regardless of the amount of body weight change.
BIA- BF300 and Antrform were less accurate to detect changes in body composition
compared with criterion method. It is important to note that, even tough, overall DXA
presented good performance criteria as compared with the four-compartment model, it
is a more expensive clinical method than the portable BIA-Tanita device that presented
the best performance criteria to detect in FM changes. Therefore, in the clinical settings
DXA and BIA-Tanita are recommended to assess body composition changes in weight
114 Faculdade de Motricidade Humana – LabES
R
EFERENCES1. Baumgartner, R. N., Heymsfield, S. B., Lichtman, S., Wang, J. & Pierson, J. N., Jr (1991) Body composition in elderly people: Effect of criterion estimates on predictive equations, American Journal of Clinical Nutrition, 53, 1345-1353. 2. Heymsfield, S. B. & Waki, M. (1991) Body composition in humans: Advances
in the development of multicompartment chemical models, Nutrition Reviews, 49, 97-108.
3. Fogelholm, M. & van Marken Lichtenbelt, W. (1997) Comparison of body composition methods: a literature analysis, Eur J Clin Nutr, 51, 495-503. 4. Siri, W. E. (1961) Body composition from fluid spaces and density: Analysis of
method, in: Henschel, A. (Ed.) Techniques for measuring body composition, pp. 223-244 (Washington, DC, National Academy of Sciences).
5. Heymsfield, S. B., Lohman T.G., Wang ZM, Going S.B. (2005) Human Body Composition (Human Kinetics).
6. Fogelholm, G. M., Sievanen, H. T., van Marken Lichtenbelt, W. D. &
Westerterp, K. R. (1997) Assessment of fat-mass loss during weight reduction in obese women, Metabolism, 46, 968-75.
7. Leone, P. A., Gallagher, D., Wang, J. & Heymsfield, S. B. (2000) Relative overhydration of fat-free mass in postobese versus never-obese subjects, Ann N Y Acad Sci, 904, 514-9.
8. Albu, J., Smolowitz, J., Lichtman, S. et al. (1992) Composition of weight loss in severely obese women: a new look at old methods, Metabolism, 41, 1068-74. 9. Evans, E. M., Saunders, M. J., Spano, M. A. et al. (1999) Body-composition
changes with diet and exercise in obese women: a comparison of estimates from clinical methods and a 4-component model, Am J Clin Nutr, 70, 5-12.
10. Teixeira, P. J., Going, S. B., Houtkooper, L. B. et al. (2004) Pretreatment predictors of attrition and successful weight management in women, Int J Obes Relat Metab Disord, 28, 1124-33.
11. Harrison, G. G., Buskirk, E. R., Carter, J. E. et al. (1988) Anthropometric standardization reference manual, in: Lohman (Ed.).
12. Weltman, A., Levine, S., Seip, R. L. & Tran, Z. V. (1988) Accurate assessment of body composition in obese females, Am J Clin Nutr, 48, 1179-83.
13. McCrory, M. A., Gomez, T. D., Bernauer, E. M. & Mole, P. A. (1995) Evaluation of a new air displacement plethysmograph for measuring human body composition, Med Sci Sports Exerc, 27, 1686-91.
14. Dempster, P. & Aitkens, S. (1995) A new air displacement method for the determination of human body composition, Med Sci Sports Exerc, 27, 1692-7. 15. Dubois, A. B., Botelho, S. Y., Bedell, G. N., Marshall, R. & Comroe, J. H., Jr. (1956) A rapid plethysmographic method for measuring thoracic gas volume: a comparison with a nitrogen washout method for measuring functional residual capacity in normal subjects, J Clin Invest, 35, 322-6.
16. Cole, K. S. & Cole, R. H. (1941) Dispersion and absorption in dielectrics, Journal of Chemical Physiology, 9, 341-351.
17. Hanai, T. (1968) Electrical properties of emulsions, in: Sherman, P. (Ed.) Emulsion Science, pp. 354-477 (New York, Academic Press).
19. Ballor, D. L. (1996) Exercise training and body composition changes, in: Lohman, T. G. (Ed.) Human Body Composition, pp. 287-304 (Champaign, IL, Human Kinetics Publishers).
20. Bland, J. M. & Altman, D. G. (1986) Statistical methods for assessing
agreement between two methods for clinical measurement, Lancet, 8, 307-310. 21. Lohman, T. G. (1986) Applicability of body composition techniques and
constants for children and youths, Exerc Sport Sci Rev, 14, 325-57. 22. Brozek, J., Grande, F., Anderson, J. T. & Keys, A. (1963) Densitometric
Analysis of Body Composition: Revision of Some Quantitative Assumptions, Ann N Y Acad Sci, 110, 113-40.
23. Frisard, M. I., Greenway, F. L. & Delany, J. P. (2005) Comparison of methods to assess body composition changes during a period of weight loss, Obes Res, 13, 845-54.
24. Carella, M. J., Rodgers, C. D., Anderson, D. & Gossain, V. V. (1997) Serial measurements of body composition in obese subjects during a very-low-energy diet (VLED) comparing bioelectrical impedance with hydrodensitometry, Obes Res, 5, 250-6.
25. Hewitt, M. J., Going, S. B., Williams, D. P. & Lohman, T. G. (1993) Hydration of the fat-free body mass in children and adults: implications for body
composition assessment, Am J Physiol, 265, E88-95.
26. de Fijter, C. W., de Fijter, M. M., Oe, L. P., Donker, A. J. & de Vries, P. M. (1993) The impact of hydration status on the assessment of lean body mass by body electrical impedance in dialysis patients, Adv Perit Dial, 9, 101-4. 27. Lohman, T. G., Harris, M., Teixeira, P. J. & Weiss, L. (2000) Assessing body
composition and changes in body composition. Another look at dual-energy X-ray absorptiometry, Ann N Y Acad Sci, 904, 45-54.
28. Williams, J. E., Wells, J. C., Wilson, C. M. et al. (2006) Evaluation of Lunar Prodigy dual-energy X-ray absorptiometry for assessing body composition in healthy persons and patients by comparison with the criterion 4-component model, Am J Clin Nutr, 83, 1047-54.
29. Blake, G. M., McKeeney, D. B., Chhaya, S. C., Ryan, P. J. & Fogelman, I. (1992) Dual energy x-ray absorptiometry: the effects of beam hardening on bone density measurements, Med Phys, 19, 459-65.
30. Tylavsky, F. A., Fuerst, T., Nevitt, M. et al. (2000) Measurement of changes in soft tissue mass and fat mass with weight change: pencil- versus fan-beam dual-energy X-ray absorptiometry. Health ABC Study, Ann N Y Acad Sci, 904, 94-7. 31. Visser, M., Fuerst, T., Lang, T., Salamone, L. & Harris, T. B. (1999) Validity of
fan-beam dual-energy X-ray absorptiometry for measuring fat-free mass and leg muscle mass. Health, Aging, and Body Composition Study--Dual-Energy X-ray Absorptiometry and Body Composition Working Group, J Appl Physiol, 87, 1513-20.
32. Bellisari, A. R., A.F. (2005) Anthropometry and Ultrasound Human Body Composition, pp. 109-127 (Human Kinetics).
33. Kohrt, W. M. (1998) Preliminary evidence that DEXA provides an accurate assessment of body composition, J Appl Physiol, 84, 372-7.
116 Faculdade de Motricidade Humana – LabES 35. Stenver, D. I., Gotfredsen, A., Hilsted, J. & Nielsen, B. (1995) Body
composition in hemodialysis patients measured by dual-energy X-ray absorptiometry, Am J Nephrol, 15, 105-10.
36. Formica, C., Atkinson, M. G., Nyulasi, I. et al. (1993) Body composition following hemodialysis: studies using dual-energy X-ray absorptiometry and bioelectrical impedance analysis, Osteoporos Int, 3, 192-7.
37. Svendson, O. (1996) Body composition and fat distribution by dual energy x-ray absorptiometry in overweight postmenopausal women (Dan Med Bull).
38. Van Loan, M. D., Keim, N. L., Berg, K. & Mayclin, P. L. (1995) Evaluation of body composition by dual energy x-ray absorptiometry and two different software packages, Med Sci Sports Exerc, 27, 587-91.
39. Fuller, N. J., Jebb, S. A., Laskey, M. A., Coward, W. A. & Elia, M. (1992) Four-component model for the assessment of body composition in humans:
comparison with alternative methods, and evaluation of the density and hydration of fat-free mass, Clin Sci (Lond), 82, 687-93.
40. Friedl, K. E., DeLuca, J. P., Marchitelli, L. J. & Vogel, J. A. (1992) Reliability of body-fat estimations from a four-compartment model by using density, body water, and bone mineral measurements, Am J Clin Nutr, 55, 764-70.