Universidade de Lisboa
Faculdade de Ciências da Universidade de Lisboa
Departamento de Biologia Vegetal
Dissecting lineage priming in mouse embryonic
stem cells
Andreia Sofia Faria Pereira
Trabalho orientado por:
Doutor Domingos Henrique
(Instituto de Medicina Molecular) e
Professor Doutor Pedro Silva
(Faculdade de Ciências da Universidade de Lisboa)
Mestrado em Biologia Molecular e Genética
Dissertação
2015
I
Agradecimentos
Para mim, este último ano representou um conjunto de aprendizagens, a todos os níveis, que me fizeram crescer e serão úteis para o resto da minha vida, profissional e pessoal. E, por isso, deixo aqui o meu agradecimento a todos aqueles (sem exceção!) que tornaram isso possível.
Ao meu orientador externo, Domingos Henrique, que me deu a oportunidade de desenvolver a minha dissertação no seu laboratório e por me ensinar que quando o sábio está a apontar para as estrelas é nelas que nos devemos focar e não na mão do sábio;
Ao professor Pedro Silva, pela sua disponibilidade em coordenar este projecto ao nível da FCUL;
Aos meus colegas de laboratório, Alexandra, Elsa, Cláudia, Pedro e Sara, pelo acolhimento, apoio e disponibilidade que sempre demonstraram;
Um agradecimento muito especial à Ana Guedes, pessoa fundamental no desenvolvimento deste projecto. Sou profundamente grata, não só pelo ensino das técnicas e pela discussão dos resultados, mas também pela preocupação, disponibiliidade e amizade que demonstrou ao longo deste ano;
Aos meus amigos e colegas de mestrado, Inês, Pedro, Tiago e Vânia pelos momentos bons (e menos bons) que passamos juntos, mas, principalmente, pela amizade incondicional que demonstraram nestes dois anos;
À A. Francisca, A. Paula, Débora, Diana P., Inês S., Inês V., Joana, Laura, Marina, Patrícia, Tânia Daniela, Valentina pelo carinho e companheirismo ao longo destes anos; um especial agradecimento à Maria Teresa, amiga de todas e quaisquer horas, obrigada por toda a partilha de “xaine”;
Aos meus tios e primos, Carlos, Luísa, Rafael e Rúben, e à Filipa, Goreti, João, Luis, Marina, Paulo e Vitinho, por todo o carinho e alegria nos fins de semana deste último ano;
Ao Gonçalo, pelo carinho, ternura e paciência inesgotáveis;
E, por fim, a toda a minha família (sem exceção), pelos valores que me transmitiram; em especial aos meus pais e irmã, por serem para mim um exemplo de amor, honestidade, generosidade, coragem e perseverança. Obrigada por tudo!
II
Abstract
Embryonic stem (ES) cells derived from the epiblast of mouse blastocysts are characterized by the ability to self-renew and to give rise to all embryonic lineages (a feature known as pluripotency). Therefore, mouse ES cells represent a unique tool to understand how transcription factor networks are modified during embryogenesis. Several knowledge has been accumulated concerning the gene regulatory networks and their transcriptional dynamics during pluripotency and lineage commitment. However, the understanding, at the single cell level, of how pluripotent transcriptional networks are dismantled, while lineage-affiliated genes networks emerge during lineage commitment of ES cells is still scarce.
The general aim of this study was to investigate single cell gene expression during neural commitment of pluripotent (Oct4, Sox2, Nanog), stochastic (Car2, Cldn6) and lineage-affiliated genes (Cdh2, Sox3, Crabp2, Fgf5, Dnmt3b, T). For that, I cultured mouse ES cells in conditions that allowed neural differentiation and performed single molecule RNA FISH analysis from cells collected at different time points of the differentiation protocol.
Here, I confirm that the highest expression of pluripotency genes occurs when mouse ES cells are cultured in pluripotent conditions. I also show that the pluripotency network is dismantled when cells enter neural lineage differentiation, due to decreased expression of
Oct4 and Nanog. In the first days of neural differentiation, neural genes start to be upregulated
but their transcription is mainly bursty, similar to genes that are stochastically expressed in the first days of differentiation. Moreover, postimplantation epiblast markers (Fgf5 and Dnmt3b) were found upregulated at day 3, when Nanog is also transiently upregulated, suggesting that a first transition from pluripotent mouse ES cells to a primed state similar to mouse epiblast stem cells occurs during early neural commitment. Later in neural differentiation, neural genes start to be expressed in a constitutive pattern and no expression of stochastic genes is observed, suggesting a second transition to irreversible neural commitment with formation of neural progenitors.
Overall, this work reveals molecular transitions and formation of intermediate subpopulations with specific gene signatures when mES cells are driven to neural fate.
Keywords: Embryonic Stem Cells, Pluripotency, Neural Differentiation, Single cell gene expression, Stochasticity
III
Sumário
As células estaminais embrionárias de ratinho representam hoje em dia uma ferramenta extremamente últil para o estudo do desenvolvimento embrionário, uma vez que são capazes de se multiplicarem indefinidamente e são pluripotentes, isto é, são capazes de dar origem a todas as células das linhagens embrionárias. Estas células foram descritas como sendo semelhantes às células do epiblasto que compõem o blastocisto, antes da implantação uterina, por volta do dia embrionário (E) 4.5. Durante a implantação ocorrem várias mudanças morfológicas e de expressão genética no blastocisto e, por volta do dia E6.5, ocorre a gastrulação, processo onde as células do epiblasto pós-implantatório originam percursores das três linhagens embrionárias: mesoderme, endoderme e neuroectoderme.
A manutenção da capacidade de auto-renovação e pluripotência das células estaminais embrionárias é regulada principalmente por três fatores de transcrição: NANOG, OCT4 e SOX2. Estes fatores compõem o centro de uma vasta rede interativa de factores reguladores da pluripotência. Inicialmente, as células estaminais embrionárias eram vistas como uma população clonal de células com uma expressão genética homogénea destes fatores. No entanto, vários estudos vieram contrariar esta ideia demonstrando a sua expressão heterogénea nas células estaminais embrionária, bem como o impacto funcional desta heterogeneidade. Por exemplo, no caso de Nanog, as células estaminais que apresentam baixos níveis de NANOG têm tendência para expressar genes associados a linhagens embrionárias e, assim, estão mais propensas à diferenciação. Este processo, denominado de “lineage priming”, carateriza-se pela expressão esporádica e reversível de genes envolvidos na diferenciação em células pluripotentes e é considerado indispensável para a capacidade pluripotente das células estaminais, uma vez que confere plasticidade e competência para se diferenciarem.
Ultimamente, vários laboratórios têm-se dedicado a desvendar os possíveis mecanismos que desencadeiam esta heterogeneidade na expressão génica, sendo que flutuações estocásticas a nível da transcrição tem sido apontada como a principal causa. Um gene pode ser constitutivamente expresso, estando o seu promotor continuamente ativo ou o promotor pode alternar entre um estado ativo e inativo que desencadeia variações no número de trancritos desse gene ao longo do tempo. Esta alternância está presente nas células estaminais embrionárias, desencadeando variabilidade individual entre células que permite a distinção de subpopulações com diferentes níveis de susceptibiliadde para se diferenciarem. Aquando da gastrulação, ocorre a formação do nó primitivo na parte posterior do embrião. A partir do nó primitivo, surge a linha primitiva de onde surgem os percursores da mesoderme e endoderme. Na parte anterior do embrião forma-se a placa neural anterior que dará origem à maior parte das células que compõem o sistema nervoso central. Quanto à
IV formação da placa neural posterior, que originará parte do sistema nervoso central, existem dois modelos que tentam responder a essa questão: o primeiro proposto por Niewkoop, em 1952, defende que a placa neural posterior deriva da regionalização de uma parte da placa neural anterior por sinalizadores de “posteriorização”. Recentemente, outro modelo propõe a existência de uma população de progenitores neuromesodermais (PNMs) bipotentes na parte posterior do embrião, independente da placa neural anterior, que contribui para a formação da espinal medula, bem como da mesoderme paraxial, e, por isso, é caraterizada pela coexpressão de: T, marcador mesoendodermal e Sox2, marcador de células neuroprogenitoras.
Devido à difícil acessibilidade para estudar a gastrulação em embriões de ratinho, o desenvolvimento de protocolos de diferenciação in vitro têm sido cruciais para o estudo do surgimento das várias linhagens durante o desenvolvimento embrionário. Um desses protocolos consiste na diferenciação neural de células estaminais embrionárias aderentes em monocamada originando progenitores neuroepiteliais que se organizam em forma de rosetas, semelhante ao que acontece aquando da formação do tubo neural in vivo. A análise global da expressão genética ao longo deste protocolo já foi efetuada, permintindo a identificação de diferentes estadios que ocorrem quando as células estaminais embrionárias são direcionadas para a diferenciação neural. No entanto, é necessário um conhecimento mais detalhado da expressão genética a nível de células individuais.
Assim, o principal objetivo deste trabalho foi a análise da dinâmica transcricional de um conjunto de genes em células estaminais embrionárias individuais sujeitas a diferenciação neural. Os genes analisados pertencem a três classes distintas: genes pluripotentes (Oct4,
Nanog e Sox2); genes associados a linhagens embrionárias, nomeadamente, genes neurais
(Cdh2, Sox3 e Crabp2), genes expressos no epiblasto pós-implantatório (Fgf5 e Dnmt3b) e gene associado ao desenvolvimento mesoendodermal e marcador de PNM’s (T) e genes estocásticos (Car2 e Cldn6), isto é, genes sem uma função direta no desenvolvimento embrionário, mas com maior expressão em células com baixos níveis de NANOG comparando com os níveis em células com altos níveis de NANOG, em condições de pluripotência.
Para tal, 3 linhas de células estaminais embrionárias foram, inicialmente, mantidas em condições de pluripotência (BMP4 LIF) e, posteriormente, transferidas para um meio que promove a diferenciação neural, RHB-A. Em diferentes dias do protocolo de diferenciação, algumas células foram recolhidas e fixadas para single molecule RNA FISH (smFISH), um método que permite a quantificação de transcritos de um dado gene em células individuais.
Assim, foi possível observar, no estado de pluripotência, a existência de duas subpopulações: uma com elevada expressão de transcritos dos 3 fatores de transcrição de pluripotência, e outra com níveis intermédios de transcritos de Oct4 e baixos níveis de transcritos de Nanog e Sox2 . Quando as células são direcionadas para a linhagem neural,
V ocorre a desestruturação da rede de fatores de transcrição reguladores da pluripotência devido à diminuição da transcrição de Oct4 e Nanog. No entanto, ao dia 3 do protocolo de diferenciação neural, 10% das células ainda expressam níveis elevados de transcritos de
Nanog e Oct4, representando uma população de células ainda pluripotentes. O número de
transcritos de Sox2 por célula sofre apenas um ligeiro decréscimo, mantendo-se significativamente expresso durante a diferenciação neural, o que confirma a importância deste gene quer na manutenção da pluripotência, quer no desenvolvimento neural.
Quanto à expressão de genes estocáticos (Car2 e Cldn6) ao longo do protocolo de diferenciação neural, esta é estocástica, havendo uma maior frequência de células que expressam altos níveis de transcritos destes genes ao dia 1; no entanto, ao dia 6 do protocolo de diferenciação, a frequência de células que expressam altos níveis destes genes é praticamente nula, sugerindo que a transcrição destes genes é restrita aos primeiros dias de diferenciação. No estado de pluripotência, as células com maior expressão de Car2 e Cldn6 apresentam simultaneamente níveis baixos de transcritos de Nanog, sugerindo um estado de “priming” nestas células pluripotentes. Foi ainda possível verificar que, ao dia 1 da diferenciação neural, ao contrário dos dias 0 e 3, a elevada expressão destes genes era independente, o que sugere uma janela temporal onde as células são mais permissivas a explorar o genoma, resultado da configuração “aberta” da cromatina e do decréscimo da expressão dos factores de transcrição que regulam a pluripotência.
A análise da expressão dos genes neurais em células individuais revelou que, nos primeiros dias de diferenciação, Cdh2 e Sox3 apresentam uma transcrição estocástica. No entanto, em dias mais avançados do protocolo é possível extrapolar que a transcrição destes genes é feita de uma forma constitutiva. Esta mudança no padrão de expressão de Cdh2 e
Sox3 sugere que a expressão estocástica destes genes nos primeiros dias de diferenciação
é um potencial mecanismo de “priming”, que ocorre antes das células se compromoterem para a linhagem neural. Estas observações confimam a hipótese que o compromisso irreversível para uma dada linhagem é dependente de dois eventos consecutivos: a) ativação da transcrição de genes associados a uma dada linhagem e b) expressão desses genes acima de um dado nível.
Quanto ao estudo da expressão em células individuais de marcadores de epiblasto pós-implantatório, Fgf5 e Dnmt3b, é possível constatar um aumento na frequência de células que expressam altos níveis de transcritos destes genes, do dia 1 para o dia 3 do protocolo de diferenciação neural. Este aumento está associado à reexpressão transiente de Nanog ao dia 3, sugerindo o aparecimento de uma população de células com expressão genética semelhante a células do epiblasto pós-implantatório.
Em conjunto, estes resultados sugerem que os primeiros dias de diferenciação neural são caracterizados pela desintegração da rede de fatores reguladores da pluripotência, bem
VI como por um contínuo aumento da expressão de genes neurais e transiente expressão de genes estocásticos e característicos do epiblasto pós-implantatório. Este estadio precede o estadio em que as células estão irreversivelmente comprometidas para a diferenciação neural. Por fim, quando avaliando a existência de PNM’s, pela co-expressão de Sox2 e T, o número de células com altos níveis de transcritos destes dois genes foi muito baixo, devido à transcrição residual de T. Esta observação pode dever-se ao facto de o meio neural RHB-A ser bastante selectivo, inibindo a sobrevivência de células que expressam genes de linhagens não-neurais. Além disso, este meio, leva à diferenciação de células com características de tecidos neurais anteriores, o que dificulta o surgimento de células com expressão semelhante aos PNM’s.
Palavras-chave: Células Estaminais Embrionárias, Pluripotência, Diferenciação neural, Expressão génica em células individuais, Estocacidade
VII
Contents
AGRADECIMENTOS ... I ABSTRACT ... II SUMÁRIO ... III CONTENTS ... VII 1 INTRODUCTION ... 11.1 EARLY MOUSE EMBRYONIC DEVELOPMENT ... 1
1.2 MOUSE EMBRYONIC STEM CELLS ... 1
1.2.1 In Vitro Culture Systems of mES cells ... 2
1.2.2 Pluripotent Gene Regulatory Network of mES cells ... 3
1.2.3 Heterogeneous gene expression in mES cells ... 4
1.3 STOCHASTIC AND NOISY GENE EXPRESSION IN MOUSE ES CELLS... 5
1.4 FROM PLURIPOTENCY TO DIFFERENTIATION ... 6
1.4.1 Neural differentiation of mES cells ... 7
2 AIMS ... 8
3 MATERIAL AND METHODS ... 9
3.1 MATERIALS ... 9
3.1.1 Reagents ... 9
3.1.2 Embryonic stem cell lines ... 9
3.2 METHODS ... 9
3.2.1 Expansion of Embryonic stem cells ... 9
3.2.1.1 Polymerase Chain Reaction (PCR) and Electrophoresis for Mycoplasma detection 10 3.2.1.2 Fluorescence Activated Cell Sorting (FACS) ... 10
3.2.2 Neural differentiation in adherent monolayers cultures ... 11
3.2.2.1 PDL-Laminin coating ... 11
3.2.2.2 Immunofluorescence ... 11
3.2.2.3 Single Molecule RNA Fluorescent In Situ Hybridization (smFISH) ... 12
4 RESULTS ... 13
4.1 CHARACTERIZATION OF NEURAL DIFFERENTIATION IN MES CELLS ... 13
4.1.1 Cell morphology ... 13
4.1.2 Dynamics of Nanog:VNP and Sox1-GFP reporters during monolayer differentiation ... 13
VIII
4.1.3 Formation of rosette-like structures ... 14
4.2 SINGLE CELL ANALYSIS OF GENE EXPRESSION DURING EARLY STEPS OF NEURAL DIFFERENTIATION ... 14
4.2.1 Dismantling of the Pluripotency Gene Regulatory Network ... 15
4.2.2 Expression of stochastic genes along neural differentiation ... 18
4.2.3 Expression of lineage-affiliated genes along neural differentiation ... 21
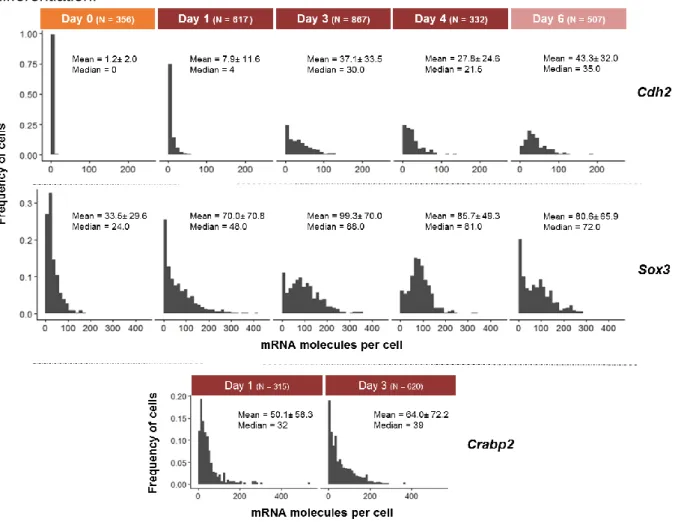
4.2.3.1 Neural genes: Cdh2, Sox3 and Crabp2 ... 21
4.2.3.2 Postimplantation Epiblast genes: Fgf5 and Dnmt3b ... 24
4.2.3.3 NMp gene’s: T and Sox2 ... 26
5 DISCUSSION AND CONCLUSION ... 27
6 REFERENCES ... 30 7 SUPPLEMENTARY INFORMATION ... A
1
1 Introduction
1.1
Early Mouse Embryonic Development
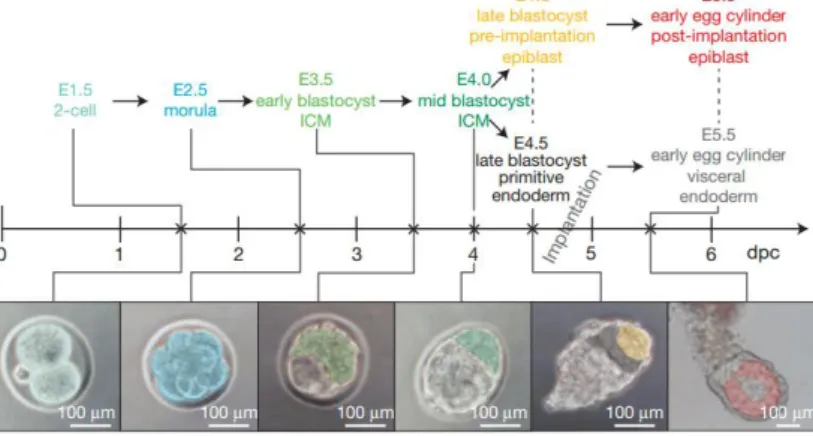
Like in other mammals, mouse embryogenesis starts with one single totipotent cell, the zygote, from which both embryonic and extraembryonic tissues are originated. Later, a sixteen cell structure is formed, the morula (Figure 1). During this stage, asymmetric cell divisions occur, and “outside” and “inside” cells are generated. These cells differ not only in their position within the embryo, but also in their molecular properties and fate potential. While “outside” cells will give rise to the extraembryonic trophoectoderm (TE), the precursor of placenta; “inside” cells will give rise to the inner cell mass (ICM) (reviewed in 1). These two cellular structures compose
the early preimplantation blastocyst, formed around embryonic day 3.5 (E3.5) (Figure 1). The next cell fate decision occurs in the ICM, with segregation of the cell population that will originate the embryo proper, the pluripotent epiblast, and the cell population that will mainly constitute the yolk sac, the hypoblast or primitive endoderm (PE) (Figure 1). The foundation for this segregation is still in debate but it has been suggested that stochastic fluctuations in gene expression, followed by a signal reinforcement are sufficient to drive this second lineage choice2. Another hypothesis states that the timing of cell internalization upon the derivation of
the ICM (first cell fate decision) affects the subsequent allocation of epiblast and PE cells3.
By the time of implantation (~E4.75), the blastocyst is organized into three distinct cell lineages: TE, PE and the epiblast. After implantation, the mouse blastocyst undergoes dramatic morphological alterations, losing its spherical shape and acquiring an elongated form, termed “egg cylinder” (Figure 1). The epiblast cells divide rapidly and reorganize in a pseudostratified epithelium located inside the egg cylinder (reviewed in 4). Around E6.5, the epithelialized
epiblast undergoes gastrulation, with generation of the three embryonic lineages (mesoderm, endoderm and ectoderm).
1.2
Mouse Embryonic Stem Cells
Figure 1-Scheme representative of the time line and morphology of the early mouse embryonic development. The cells
marked with pseudocolors represent the developmental stage indicated with the same pseudocolors in the descriptions. dpc, days post coitum. Adapted from Boroviak et al.,2014 7.
2 ES cells, either derived from human or mouse embryos, have two unique features: ability to self-renew and pluripotency, the capability to give rise to all cell types of the three embryonic lineages.
Isolation of mouse embryonic stem (mES) cells was firstly reported in 19815,6, and until
recently the association between mES cells and the embryo was controversial. Recently, however, Boroviak et al7 reported a close relationship between in vitro mES cells and in vivo
E4.5 epiblast cells7, based on global transcriptional and functional data.
Besides the derivation of ES cell lines, it is also possible to originate other pluripotent cell lines from different embryonic developmental stages: postimplantation epiblast stem (EpiS) and embryonic germ (EG) cell lines. ES and EG cells share some features including colony morphology and gene expression pattern. On the other hand, EpiS cells exhibit different colony morphology and a different gene expression profile, when compared to ES cells (reviewed in
8,9). In order to discriminate these differences, mES and mEpiS cells are termed “naïve” and
“primed” pluripotent cells, respectively, representing two distinct states of pluripotency. These cells exhibit common and divergent characteristics: both express pluripotent transcription factors OCT4 (octamer-binding transcription factor 4) and SOX2, and are able to originate cells of all embryonic lineages in vitro and in vivo. However, mEpiS cells are derived from a more developmental advanced epiblast (postimplantation, E5.5) than mES cells (preimplantation, E4.5). Therefore, it is believed that mEpiS cells are one step closer to lineage commitment than mES cells10,11. Following this notion, mES cells are characterized by expression of
preimplantation blastocyst markers like Nanog, Rex1, Stella, Tbx3, Dax1 and CD3. In contrast, these markers are downregulated in mEpiS cells, which show expression of postimplantation epiblast markers (Fgf5, Otx2, Dnmt3b and Nodal), as well as upregulation of lineage-affiliated genes (T, also known as Brachury, Sox17, Eomes and Foxa2) (reviewed in 8). mEpiS cell lines
are also different in chromatin configuration, displaying X chromosome inactivation, an epigenetic mark of differentiation, and global increase DNA methylation due to enhanced
Dnmt3b gene expression, two features that are absent from mES cells (reviewed in 12).
1.2.1 In Vitro Culture Systems of mES cells
As an in vitro counterpart of the preimplantation epiblast, mES represent a unique tool to investigate embryonic development. Therefore, the study of signalling pathways that enable to capture and sustain the naïve state of mES is crucial in this field.
mES cells can be maintained in vitro using different culture media. When the first pluripotent cell lines were derived5,6, cells were cocultured with mitotically inactive mouse
fibroblasts, so called “feeder” cells because they provide signalling molecules, supplemented with fetal calf serum, which inhibits mES cells differentiation. Later, it was found that Leukemia Inhibitory Factor (LIF) was the cytokine secreted by “feeder” cells that enable mES cells
self-3 renewal13,14. LIF binds to the GP130 receptor and through activation of the transcription factor
STAT3 drives long-term self-renewal of mES cells15. Nowadays, the standard culture medium
for mES cells includes serum supplemented with LIF (Serum LIF conditions), but mES cells cultured in this system present some spontaneous differentiation, strongly influenced by serum batch and cell density (reviewed in16). In 2003, Ying et al17 reported the maintenance of mES
cells in serum-free conditions by adding Bone Morphogenetic Protein 4 (BMP4) and LIF to a chemically defined culture medium (BMP4 LIF conditions). BMP4 acts by activating Inhibitor of differentiation (Id) proteins, through the Smad pathway, leading to repression of neural lineage commitment, while LIF/STAT3 pathway inhibits mesoendodermal differentiation. More recently, in 2008, another stem cell culture system was reported, the “2i” media18. This is composed of 2
inhibitors, CHIRON99021 (CHIRON) and PD0325901 (PD03), in a chemically defined media. PD03 is a MEK inhibitor and blocks phosphorylation of ERK1/2, promoting long-term self-renewal of mES cells. However, PD03 is insufficient to support mES cells’ viability in the absence of LIF. Therefore, addition of a GSK3 inhibitor, CHIRON, stabilizes mES cells’ proliferation. Using these two inhibitors (2i conditions) with optional addition of LIF, it is possible to keep mES cells in a pluripotent ground state shielded from differentiation stimuli11,18,19.
1.2.2 Pluripotent Gene Regulatory Network of mES cells
Pluripotency is initiated and maintained due to interactions between transcription factors, chromatin modifiers and other regulatory genes. According to some studies, when OCT420,
NANOG21 and SOX222 are depleted in mouse embryos, epiblast formation is severely
compromised and early differentiation is triggered, leading to the assumption that these transcription factors are critical regulators of pluripotency 19.
OCT4, also known as POU5F1, is a POU homeodomain transcription factor. It is expressed in the ovum and after fertilization is distributed to all blastomeres. After the first cell fate decision, Oct4 expression becomes restricted to the ICM. In homozygous Oct4-deficient mouse embryos, no mature ICM is formed and the blastocyst develops into a mass of giant trophoblast cells 20. Upon the second cell fate decision, Oct4 is expressed in the epiblast and
transiently in the PrE, but after implantation its expression is confined to epiblast cells 23. Oct4
expression is maintained after implantation but continuously decreases during gastrulation, becoming undetectable in the somatic cells of 12- to 15-somite embryos (E8.75), and therefore marking the loss of pluripotent capacity 24. In mES cells, proper levels of Oct4 expression are
critical for the maintenance of its pluripotentiality, with an increased expression leading to PrE and mesoderm differentiation and a decrease in Oct4 expression levels triggering loss of pluripotency and dedifferentiation to trophoectoderm 25.
NANOG (designation derived from the Irish mythological land “Tír na nÓg”, or “Land of the Young” 26) is a homeodomain transcription factor. Unlike OCT4, NANOG is not maternally
4 inherited, but appears in a random cellular distribution at the end of the morula stage 27. Later,
Nanog becomes exclusively expressed in the ICM, with a mosaic distribution. In the early ICM, Nanog and the early PrE marker Gata6, are co-expressed, although, upon segregation of
epiblast and PrE cells, the expression of Nanog and Gata6 becomes mutually exclusive, with NANOG expressing-ICM cells originating epiblast cells and GATA6 expressing-ICM cells forming PrE cells (reviewed in1,28). At the time of implantation, Nanog expression is
downregulated and re-emerges in the posterior egg cylinder (reviewed in 19). Upon gastrulation,
Nanog expression declines, becoming undetectable in somatic cells of 3- to 5-somite embryos,
earlier than Oct4 24. However, Nanog and Oct4 expression persist in primordial germ cells 29. In
vitro, Nanog expression was found to be important in mES cells self-renewal, with its
upregulation being sufficient to maintain clonal propagation of pluripotent cells in the absence of LIF cytokine signalling 21,26. Nanog expression is not fundamental to maintain mES cells in a
pluripotent state but when downregulated turns mES cells more susceptible to differentiate 30,31.
Sox2 encodes a transcription factor member of the Sox (SRY-related HMG box) family
and belongs to the SoxB1 subgroup, which also includes Sox1 and Sox3. Like OCT4, SOX2 is also maternally inherited with zygote-derived Sox2 mRNA starting to be detected in some cells at morula stages (E2.5) and in the blastocyst. Its expression persists throughout the ICM and later in epiblast cells. Around E7.5, most of its expression becomes restricted to the anterior part of the embryo that will develop into the anterior neuroectoderm 22,24. Its expression was
also found in a posterior region, when posterior bipotent neuromesodermal progenitors (NMp’s) are established (reviewed in 32). Like OCT4 and NANOG, upon somitogenesis, Sox2 expression
persists only in primordial germ cells 22,24. In mES cells, SOX2 was described as a stabilizer of
the pluripotent state through regulation of Oct4 expression levels 33. Downregulation of Sox2
expression promotes the differentiation of mES cells into trophectoderm-like cells34, whereas its
overexpression predisposes mES cells to neuroectodermal differentiation 35.
These three transcription factors, OCT4, SOX2 and NANOG, are known as “core” pluripotency factors in human and mouse embryonic stem cells, and several studies point for direct and indirect interactions between them and other transcription factors, establishing a pluripotent regulatory network34,36,37. Several studies indicate the existence of other factors also
involved in pluripotency regulation, such as ESRRB, STAT3, TBX3 and KLF4 (reviewed in 38).
1.2.3 Heterogeneous gene expression in mES cells
Initially, ES cultures were seen as homogenous population of cells, with equal differentiation potential. However, further evidence suggested that mES cell cultures comprise distinct cell types, in terms of differentiation potential, chromatin configuration and gene expression. In fact, Nanog was found to be heterogeneously expressed in individual mES cells
5 cells 41. However, some authors reply that mouse ES cells heterogeneity may be a culture
epiphenomena, as a consequence of a disordered signalling environment created by in vitro conditions42. In fact, when mES cells expressing an unstable fluorescent reporter for NANOG
are cultured in Serum LIF conditions, only 50% present NANOG expression; on other side, when mES cells are transferred to a 2i culture medium, a significantly more homogenous population of cells is generated, with 90% of mES cells expressing Nanog:VNP 31. However,
fluctuations in Nanog expression still occur in 2i media 31. Opposing this view, heterogeneity
was shown to have functional impact in mES cells differentiation potential. Abranches et al. 31
showed that Low-NANOG mES cells are more susceptible to differentiation and markedly express lineage-affiliated genes when compared to High-NANOG mES cells. This higher expression of lineage-affiliated genes in Low-NANOG cells has been associated with “lineage priming”, a process where pluripotent cells display sporadic and reversible expression of these genes, reflecting an increased predisposition to enter differentiation. “Lineage priming” is considered indispensable for the pluripotency capacity of mES cells, conferring the developmental competence and plasticity to subsequently differentiate. Several studies have reported that pluripotent cells in vitro oscillate between a ground state and another where cells are more prone to lineage commitment 44,45.
Not only Oct4 and Nanog have been proven to be heterogeneously expressed in mES cells, but also other pluripotency transcription factors like Stella, Rex1, Esrrb, Klf4 and Tbx3 (reviewed in 8,40). Interestingly, this mosaic expression is not only observed for pluripotency
transcription factors but also for lineage-affiliated genes such as T, mesoendodermal marker, and Hhex, hypoblast marker (reviewed in 8).
But what drives this heterogeneous gene expression in mES cells?
1.3
Stochastic and noisy gene expression in mouse ES cells
There are a number of possible mechanisms to explain heterogeneities in gene expression. One of the sources is the unequal provision of extrinsic signals to mES cells that could generate correspondingly heterogeneous pluripotency factor expression; or even autoregulatory feedback loops of pluripotent genes also regulate heterogeneity. Nevertheless, stochastic fluctuations in mRNA levels in single cells is often viewed as the major source of heterogeneity of gene expression in mES cells.
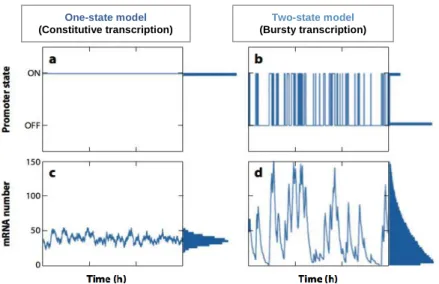
Generally two models of transcription could be distinguished (Figure 2): fully activated genes that display constant transcription and therefore the number of mRNA molecules produced over time is constant (Figure 2a, 2c); and those that are only activated in certain contexts with the number of mRNA molecules varying along time (Figure 2b, 2d). The later model of transcription is usually characterized by fluctuations in gene expression, triggering a pulsatile transcription. If transcription occurs with bursts, variations in the number of mRNA
6 molecules present in each cell is expected. These bursts start and end when a gene transits from an inactive to active state and vice-versa, respectively, and these transitions were proven to be due to intrinsic noise46. According to Elowitz et al47, there are two types of noise in gene
expression: extrinsic and intrinsic. Extrinsic fluctuations refer to variations in the number of RNA polymerases, ribosomes, transcriptional activators and repressors and affect the transcription of the entire genome; intrinsic fluctuations are due to the randomness inherent to transcription and translation. Both sources of noise are significant. However, intrinsic noise is the major cause of transitions between active/inactive state. Furthermore, the activation of a certain gene causes burst-like transcription in all genes closer to that genomic locus, whereas genes located in distant genomic regions burst independently 46. Like for other mammalian cells, transcriptional
noise is a hallmark of mES cells and is essential for generation of heterogeneity in cell populations. In mES cells, as presented in section 1.2.3, cell-to-cell variations resulting from transcriptional noise are important to keep a subpopulation of pluripotent mES cells continuously primed to differentiation, providing the opportunity for cells respond to several external signals within a short period of time.
1.4
From Pluripotency to Differentiation
When mES cells commit to differentiation, bursty transcription is still present 48 and
therefore heterogeneity of increasingly expressed lineage-affiliated genes is observed (reviewed in 8,40). The same is valid for genes that do not present any developmental role, but
are highly expressed in Low-Nanog comparing to High-Nanog mES cells (RNA-seq data; E. Abranches, unpublished data). In this work, these genes are designated as “stochastic” genes, to distinguish them from lineage-affiliated genes.
One-state model
(Constitutive transcription)
Two-state model (Bursty transcription)
Figure 2- Models for gene transcription. One-state model applies to genes expressed constitutively and therefore always
with an “ON” promoter state (a) and constant number of mRNA molecules produced overtime resembling a Gaussian distribution(c). Two-state model represents genes with a bursty transcription where the promoter state oscilates between “ON” and “OFF”(b) and therefore the number of transcripts produced overtime is not constant approaching a long tailed distribution(d). Adapted from Raj and van Oudenaarden, 2008 55.
7 In the mouse embryo after implantation, as described in section 1.1, the pluripotent epiblast undergoes morphological and transcriptional modifications. Around E6.5 (Figure 1), gastrulation begins with the formation of the node that acts as a body plan organizer, on the posterior side of the epiblast. From the node, a structure called primitive streak is formed. With the formation of the primitive streak, the anterior-posterior axis becomes morphologically obvious with the streak located on the posterior side of the embryo. The cells that move through the streak become mesendoderm, which are the precursors of mesoderm and endoderm cells. Anteriorly, the acquisition of neural fate is achieved by the induction of the anterior neural plate derived from the anterior epiblast, while the posterior neural plate arises from regionalization of the anterior neuroectoderm through “posteriorizing” signals. This model is derived from the “activation-transformation” hypothesis proposed by Nieuwkoop in 1952 49. More recently, the
existence of a population of bipotent neuromesodermal progenitors (NMp’s) was reported in the posterior epiblast in E8.5 mouse embryos 32. These cells contribute to both spinal cord and
paraxial mesoderm, and are characterized by the co-expression of early mesodermal marker T and neural progenitor marker SOX2 (reviewed in 32). Therefore, an alternative model32 proposes
that neural induction occurs through formation of the anterior neural plate, while some posterior neural tissue is derived independently from the anterior neural plate. Several studies have reported the derivation of in vitro NMp-like cells, providing a unique tool to study the formation, gene regulatory networks and developmental potentialities of these cells.
1.4.1 Neural differentiation of mES cells
In vitro differentiation of mES cells cultured in defined conditions provides a tractable
system to dissect and understand the process of exit from naive pluripotency and entry into lineage specification. ES cells can be driven into neural differentiation by the formation of multicellular aggregates, embryoid bodies (EBs), or by adherent monolayer cultures51,52. In the
later system, mES cells are cultured in feeder-free conditions in the presence of serum-free medium, to maintain cells in an undifferentiated state. When these cells are exposed to a defined medium, RHB-A, that drives mES cells to an anterior neural fate, neural progenitors (NPs) are generated, which become organized in rosette-like structures52 (Figure 3). These
structures resemble the formation of the neural tube with a clear apical-basal polarity marked by the apical expression of junction proteins like N-Cadherin and ZO-152,53.
During this in vitro neural differentiation protocol, a global characterization of the gene expression signatures present in each particular stage of neural development was performed, allowing the identification of the main stages and transitions that occur when mES cells are driven to neural fate. However, a deeper knowledge on how gene expression in individual cells was affected during neural commitment and differentiation was lacking.
8 Recently, in 2013, Trott and collaborators 54, reported the study expression of certain
genes when mES cells exit pluripotency, being cultured in N2B27, a neural basal medium, at the single cell level. In this study, it was reported a decrease in Rex1, Nanog and Oct4 expression, as well as transient expression of the epiblast markers Fgf5 and Otx2 and increase in the expression of neural genes was also observed 54.
Nevertheless, the number of analysed cells and the studied gene expression correlations in this report were scarce, not allowing the distinction of putative different subpopulations that could arise within the same stage of neural differentiation. Furthermore, the transcription mode (constitutive or bursty) of the genes analysed was not examined and so, the transcriptional dynamics of genes with different developmental roles, in single cells, during in
vitro neural differentiation, is still an unresolved question.
2 Aims
The main aim of this project was to analyse the single cell transcriptional dynamics of selected genes (pluripotent, lineage-affiliated and stochastic genes) when mES cells are committed to neural differentiation. The specific aims were:
Quantify, at the single cell level, the expression of mRNA molecules from a set of selected genes (pluripotent, lineage-affiliated and stochastic genes) along monolayer neural differentiation, and apply correlation analysis for the distributions obtained; Understand how is the core pluripotency network dismantled along neural differentiation; Understand how transcription dynamics of lineage-affiliated and stochastic genes
changes along neural differentiation;
Assess the presence of cells co-expressing T and Sox2 (NMp’s markers) along neural differentiation.
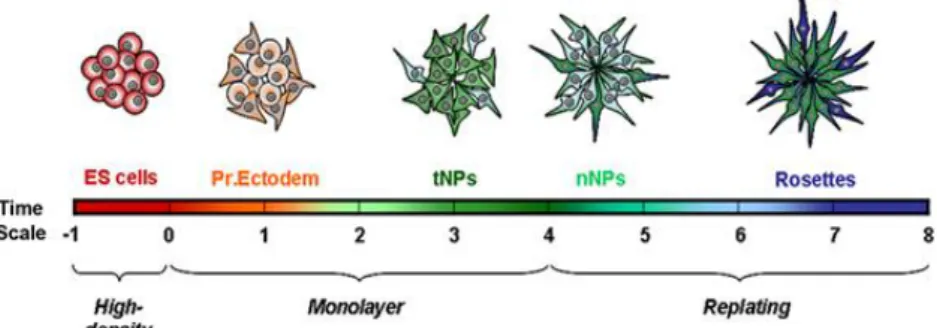
Figure 3- Diagram representative of the successive cellular states that occur along the monolayer neural differentiation based
on their transcriptional profiles. Initially mES cells are found in the pluripotent state (Days -1 and 0); when plated in RHB-A medium, in the first days cells acquire gene expression similarities with Primitve Ectoderm cells (Pr. Ectoderm). Then, a population of transient NPs (tNPs) emerges and latter give rise to permanent neural NPs (nNPs). From day 6 onwards, this population will originate the set of NPs organized in rosette-like structures (Rosettes). Adapted from Abranches et al. 52
9
3 Material and Methods
3.1
Materials
3.1.1 Reagents
The reagents, solutions/media, antibodies and single molecule RNA FISH probes used in this study are listed in Table S1, Table S2, Table S3 and Table S4, respectively.
3.1.2 Embryonic stem cell lines
The three mouse ES cell lines used in the experiments were: E14Tg2a, Nd43 (Nanog
dynamics, derived from E14Tg2a, with a short lived VNP reporter under the control of Nanog regulatory regions) and 46C (derived from E14Tg2a, with a GFP reporter under the control of
Sox1 promoter region). E14 (for E14Tg2a) and 46C were a gift from Meng Li-MRC Clinical
Sciences Centre, Faculty of Medicine, Imperial College, London, UK- and Austin Smith-Wellcome Trust Centre for Stem Cell Research, University of Cambridge, Cambridge, UK).
3.2
Methods
All of the experiments described in sections 3.2.1 and 3.2.2 were performed in a sterile laminar flow hood class II, type A/B3.
3.2.1 Expansion of Embryonic stem cells
For mES cell expansion, cells were cultured on gelatin coated dishes (10 minutes coating), in GMEM (Table S2) supplemented with 10% FBS and LIF (2ng/mL) (Serum LIF conditions), in a 5% CO2 incubator. The frozen cell stock (liquid nitrogen) was thawed in
pheated supplemented GMEM and centrifuged at 1200rpm for 4 minutes. After pellet re-suspension in supplemented GMEM, cells were plated on 0.1% (v/v) gelatin-coated dishes. Medium was changed 6 hours later to eliminate DMSO residues. The cells’ morphology was assessed daily by direct visualization on a bright field microscope, and cells were passaged every other day, at a constant plating density of 3x10⁴cells/cm2. For each passage, cells were
washed twice with PBS and dissociated with 0,1% trypsin for 2min at 37ºC. Cells were immediately re-suspended in supplemented GMEM in order to neutralize trypsin, centrifuged at 1200 rpm for 4min and re-suspended again in supplemented GMEM. In each passage, cells were counted using trypan blue dye exclusion method and the required amount of cells was re-plated as described before. At each passage Nanog:VNP and Sox1-GFP expression was assessed by Fluorescence Activated Cell Sorting (FACS) (section 3.2.1.2).
To prepare stocks of mES cells to be frozen, 3x10⁶cells were frozen in supplemented
GMEM with 10% Dimethyl sulphoxide (DMSO) and stored in liquid nitrogen. Every time cells were frozen, a sample was collected to test for Mycoplasma contamination (section 3.2.1.1).
10
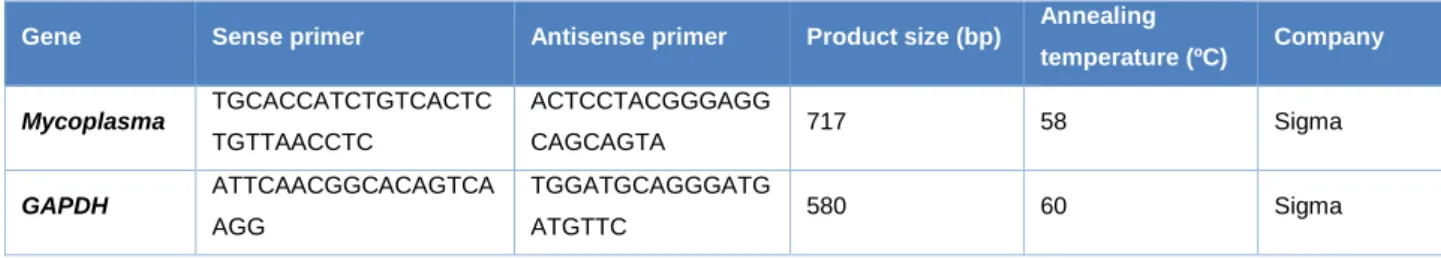
3.2.1.1 Polymerase Chain Reaction (PCR) and Electrophoresis for Mycoplasma detection
Each time a new mES cell stock was prepared, the presence of mycoplasma contamination was determined by PCR. For that 1.0x10⁶ cells were collected, centrifuged at
2000 rpm for 5min, re-suspended in wash buffer (Table S2) and centrifuged again in the same conditions. Then a 1:1 mix of solution A and solution B (Table S2) was added to the cells and the mixture was incubated for 1h at 60ºC followed by 1 hour at 90ºC.
PCR was performed using rTaqPolymerase, amplifying a conserved region in the 16S RNA Mycoplasma ribosomal gene. The amplification was performed with an initial step of denaturation at 95ºC for 5 min, followed by 30 cycles of denaturation at 95ºC for 30s, annealing at 58ºC for 1.5 min and extension at 72ºC for 1.5 min, and a final step of extension at 72ºC for 10 min. The reactions were prepared for a final volume of 25 µL: 3µL of sample, 1x buffer, 0.2mM dCTP, 0.2mM dGTP, 0.2mM dATP, 0.2mM dTTP, 25pmol of each primer (Table 1) and 2.5U of rTaq Polymerase.
After PCR reaction, the PCR products were analysed in a 1.5% agarose gel. Gels were prepared by heating agarose in 1x TAE buffer until complete dissolution, followed by addition of gelRed (1:20 dilution) to allow visualization of DNA fragments. PCR products were mixed with loading buffer in a 5:1 proportion and loaded on an Agarose gel. An electric voltage of 70 volts was applied to the gel for 90min and DNA fragments were visualized under ultraviolet light at 260nm or 365nm, using Bio-Rad Image Lab Software.
At the same time, the quality of the DNA preparation was confirmed by performing a PCR to detect GADPH gene, a housekeeping gene, used as an internal control. Moreover, a plasmid carrying the Mycoplasma 16S ribosomal RNA gene was used as a positive control and an ultrapure water sample as a negative control. The size of the fragments was estimated by comparison with linear DNA strands of known molecular weight (1kb Plus DNA Ladder-Invitrogen).
Table 1: Oligonucleotides used for mycoplasma detection.
3.2.1.2 Fluorescence Activated Cell Sorting (FACS)
In order to quantify the percentage of cells that express VNP and GFP reporter in the various cell culture conditions here used, fluorescence activated cell sorting (FACS) was
Gene Sense primer Antisense primer Product size (bp) Annealing
temperature (ºC) Company Mycoplasma TGCACCATCTGTCACTC TGTTAACCTC ACTCCTACGGGAGG CAGCAGTA 717 58 Sigma GAPDH ATTCAACGGCACAGTCA AGG TGGATGCAGGGATG ATGTTC 580 60 Sigma
11 performed. Cells were dissociated and 5x10⁵ cells were re-suspended in PBS. Live cells were
gated based on forward and side scatter and by propidium iodide dye exclusion. Data was acquired in a FACS Calibur and in each data acquisition, 10000 gated events were recorded and the data obtained was subsequently analysed using FlowJo software.
3.2.2 Neural differentiation in adherent monolayers cultures
Neural differentiation of mES cells was done according to a protocol described by Abranches et al52. Briefly, cells were plated in 0.1% (v/v) gelatin-coated dishes at high density
(1x10⁵cells/cm2) (Day -1) in serum-free medium (ESGRO clonal grade) supplemented with LIF
(2ng/mL) (BMP4 LIF conditions). After 24hours (Day 0), morphology and cell confluence were evaluated in a bright field microscope. Cells were dissociated, counted and plated in gelatin-coated dishes in a neural differentiation medium (RHB-A) at density of 1.5x10⁴cells/cm2. For
each day of the differentiation protocol, cell morphology was observed and documented. Medium was renewed at day 2. At day 4, cells were dissociated, counted and re-plated in PDL-Laminin coated dishes (section 3.2.2.1), at a density of 2x10⁴ cells/cm2 in RHB-A supplemented
with 5ng/mL murine bFGF, and medium was changed again at day 6. At each timepoint of the neural differentiation protocol, Nanog:VNP and Sox1-GFP reporters expression was assessed by FACS (section 3.2.1.2).
3.2.2.1 PDL-Laminin coating
The tissue culture dishes were covered with PDL solution (10µg/mL in PBS) and left for 1h at room temperature. The dishes were then washed twice with PBS and covered with Laminin solution (2.5µg/mL in PBS) and left overnight in the 5% CO2 incubator at 37ºC.
According to the analysis to be performed, coating was either done directly on culture dishes (for cell fixation for smFISH purposes - see section 3.2.2.3 - or for protein analysis using FACS - see section 3.2.1.2) or on glass coverslips (for immunofluorescence analysis purposes - see section 3.2.2.2).
3.2.2.2 Immunofluorescence
Immunofluorescence was performed to visualize the presence and structural organization of rosettes-like structures, confirming the presence of neural progenitors at day 6 of monolayer neural differentiation protocol.
Cells grown on coverslips were washed twice with PBS, for 5min, and fixed with 4%(w/v) paraformaldehyde (PFA) in PBS, for 15min at 4ºC. Cells were washed twice for 5min and residual PFA was washed with fresh 0.1M Glycine in PBS for 10min at room temperature (RT). Cells were then permeabilized by incubation with 0.1% Triton in PBS for 10min at RT and blocked with blocking solution (Table S2) for 30min at RT. Primary antibodies (Table S3) were
12 diluted in blocking solution and incubated overnight (O/N) at 4ºC. In the next day, cells were washed three times with TBST for 5min each. Appropriate secondary antibodies (Table S3) were diluted in blocking solution and incubated for 30min at RT. Cells were washed three times for 5min with TBST and counterstained with 4’,6-diamidino-2-phenylindole (DAPI) for 5min. After washing three times in PBS for 5min, cells in coverslips were mounted with Mowiol mounting medium.
Images were acquired using a Leica DM5000B widefield fluorescence microscope with a monochrome CCD camera and image analysis was performed using Image J and Adobe Photoshop software.
3.2.2.3 Single Molecule RNA Fluorescent In Situ Hybridization (smFISH)
For smFISH, cells were dissociated, washed with PBS and fixed in 4% formaldehyde for 10min at RT. After that, cells were washed twice in PBS in re-suspended in 2 to 4mL of Ethanol 70%. These fixed cells can be kept at 4ºC for long periods of time.
For each smFISH experiment, 100-200µL of fixed cells were re-suspend in 1mL of wash buffer (see Table S2). After that, cells were incubated O/N at 37ºC in a mix composed of 100µL hybrization buffer (Table S2) and 1 µL of each Stellaris TM FISH probe (Table S4)55. Up to three
different probes, targeting 3 different mRNA transcripts were used in a single smFISH experiment. Probes were previously dissolved in TE (Table S2) to create a probe stock at a global concentration of 1 to 12µM. Each probe set is composed of 25 to 45 unique oligonucleotides (20 nucleotides each) complementary to a different region of the target RNA. Each probe is labelled with a fluorophore: Alexa594, Cy5 or Tmr, with excitation peak/ emission wavelength of 590/ 617nm, 649/ 670nm and 564/ 570nm, respectively. Each probe set produces enough signal to detect one single mRNA molecule as one spot during image acquisition.
In the next day, cells were washed twice: firstly with wash buffer for 30min at 37ºC and then with wash buffer and DAPI (1µL of 1mg/mL solution) for 30min at 37ºC. Next, cells were washed in glox buffer solution and then finally re-suspended in an antifade solution (Table S2). After suspension cells were mounted between slide and coverslip and carefully smashed to decrease the volume of the cells and allow increase of signal quality and finally properly sealed. Cells were imaged within 24hours on an inverted fluorescence Zeiss Axiovert 200M microscope, using a 100x1.4 oil-immersion objective, a cooled CCD camera (Roper Scientific Coolsnap HQ CCD) and filtersets suitable to the excitation and emission wavelengths of the applied fluorophores. For each image 30 Z stacks, with 0.3µm step size were recorded. Data
were processed using MATLAB
(https://bitbucket.org/arjunrajlaboratory/rajlabimagetools/wiki/Home). Statistical data analysis was performed using R programming language and RStudio software (Figure S1).
13
4 Results
In order to perform single cell expression analysis at different steps of neural differentiation, E14, Nd and 46C mES cell lines were directed to neural differentiation in an adherent monolayer culture system, as described by Abranches et al.52. mES cells were
harvested for different types of analysis at different time points, as schematized in Figure 4.
4.1 Characterization of neural differentiation in mES cells
Characterization of mES cell neural differentiation in monolayer cultures was performed by analysis of both cell morphology (Figure S2) and expression of the Sox1-GFP reporter (Figure S3). Analysis of specific neural markers in rosette-like structures was also performed (Figure S4).
4.1.1 Cell morphology
Cell morphology was monitored daily on an inverted bright field microscope. In pluripotency conditions, mES cells grew in characteristic mES organization with cells being arranged in clusters with few differentiated cells at the periphery (Figure S2-A; Day 0). Once cells are plated in the neural differentiation medium RHB-A, an increase in cell death (Figure S2-B) as well as a decrease in Fold Increase (FI) of the culture (Figure S2-C) was observed during the first days of neural differentiation, suggestive of a high medium selectivity. Also, the number of undifferentiated cell clusters decrease. When cells are replated at day 4 in RHB-A supplemented with basic FGF (bFGF), which is important for maintenance of neural progenitors, no undifferentiated cell clusters are formed and the differentiated cells are reorganized in rosettes-like structures. These display morphological and functional characteristics of the neural tube in vivo 52 (Figure S2-A; Day 6).
4.1.2 Dynamics of Nanog:VNP and Sox1-GFP reporters during monolayer
differentiation
Figure 4- Scheme of the monolayer neural differentiation protocol followed to direct neural differentiation of mES cells. The
experimental procedures done at each time point are depicted (FACS, smFISH and immunostaining) as well as the cell line used for each procedure: All cell lines (E14, Nd and 46C) or 46C only.
14 In order to monitor efficiency of neural differentiation and exit from pluripotency, expression of Sox1-GFP and Nanog:VNP reporters was evaluated by FACS analysis, using
46C and Nd cells, respectively. E14 cells were used as a negative control for fluorescence
(Figure S3). It was previously reported that Sox1 expression is activated in proliferating neural progenitor cells, making Sox1 an adequate gene to evaluate the neural differentiation effectiveness 58. When measuring the levels of Sox1-GFP we observe an increase along the
protocol reaching 80% GFP positive cells by day 4 (Figure S3), which is consistent with previous data 51,52 and confirms the efficiency of the protocol. Concerning the expression of Nanog:VNP,
in pluripotency conditions (BMP4 LIF), 60% of the cells are Nanog:VNP positive, which is consistent with previous reports 31,43. Once cells advance into neural fate, the percentage of
Nanog:VNP decreases, as expected 24, reaching null levels at day 6 (Figure S3). It is also
noteworthy that there is a small increase in Nanog:VNP levels at day 3 of neural differentiation, consistent with in vivo data 24. Furthermore, this transient increase in NANOG levels was also
confirmed at the mRNA level (section 4.2.1) corroborating previous studies 54,57,58.
4.1.3 Formation of rosette-like structures
Efficiency of neural differentiation was further confirmed by assessing the expression of specific markers in rosette-like structures. Immunofluorescence was performed in cells at day 6 of neural differentiation to monitor expression of Sox1-GFP and N-Cadherin, which is present at apical adherent junctions, in order to confirm the organization of the neuroepithelial progenitors in rosette-like structures (Figure S4). These structures were proposed to mimic neural development in vivo, in which markers like N-Cadherin and ZO-1 are expressed in the apical domain of the embryonic neural tube53. Sox1-GFP expression was detected and proper
cell organization in rosettes was identified, confirming efficient neural differentiation.
4.2 Single cell analysis of gene expression during early steps of neural
differentiation
Population analyses provide insights on the mean behavior of a group of cells, however are less informative when trying to determine how individual cells coordinate specific gene expression when exiting pluripotency and entering neural commitment. Therefore, after confirming the efficiency of the neural monolayer differentiation protocol, 46C cells were fixed to perform smFISH, a modified mRNA FISH method that allows a quantitative measurement of the number of mRNA molecules in single cells 59. This method was used to quantify several
mRNAs in 46C cells, collected from different time points: Day 0, Day 1, Day 2, Day 3, Day 4 and Day 6 (Figure 4). In this single cell approach, it is possible to probe transcripts of three genes in each experiment. For all smFISH experiments performed, Nanog mRNA levels were
15 evaluated in order to study its putative transcriptional correlation with other genes, and also to prove the reproducibility of this approach.
For all analysed gene combinations, the distribution of the frequency of cells expressing different transcript levels, i.e. number of mRNA molecules, for each gene and experimental time point, was considered. The distribution shape could be useful to infer some relevant information about transcription state: a unimodal/Gaussian-like distribution, with the majority of cells expressing an average level of mRNA molecules, and few cells expressing less or more than the average, is suggestive of continuously active transcription with cells showing homogenous transcripts levels and therefore low cell-to-cell variability concerning the expression of that gene; long-tailed distributions, in which most cells express few transcripts, while a small number of cells displayed high number of transcripts, leading to a wide variety in the number of mRNA molecules present in the cells expressing that gene, and therefore to cell-to-cell heterogeneity. According to Raj and van Oudenaarden 59, this distribution is suggestive of a bursty-like
transcription that occurs in infrequent but potent bursts that correlate with active and inactive states of transcription.
Furthermore, for each gene combination studied in this work, it was possible to establish correlations between the mRNA levels of each analysed gene in single cells. This enables us to group cells expressing similar transcript levels in subpopulations and infer their biological identity. In order to measure the statistical dependence of the two gene’s transcription levels, Spearman correlation coefficient, r, was calculated. This value varies between -1 (negative correlation) and 1 (positive correlation). When r is high, cells with high expression of gene X are more likely to present high transcript levels of gene Y. The lowest the r value, the more likely is that cells with high expression of gene X have low transcript levels of gene Y.
For each analysed gene, a specific value of mRNA molecules per cell was defined as a threshold to distinguish cells expressing high transcript levels (number of mRNA molecules above threshold value) and low transcript levels (number of mRNA molecules below threshold value) (Table S6). This is important to distinguish cell populations in an active and inactive state of transcription, respectively. These values were assigned by observation of transcript number distributions in the experimental day of maximum expression for each genes, as described by Nair et al. 61.
4.2.1 Dismantling of the Pluripotency Gene Regulatory Network
The first question I addressed concerned how the pluripotent gene regulatory network (measured by the expression of Nanog, Oct4 and Sox2) is dismantled once cells are directed to neural lineage commitment. Cells in the pluripotent state (Day 0) and in the early steps of neural commitment (Day 1, Day 2 and Day 3) were collected, and smFISH was performed to detect Oct4, Sox2 and Nanog transcripts. The distributions depicting the frequencies of cells
16 with a given expression value are shown in Figure 5. The correlations between the expression levels for each gene in single cells is analysed in Figure 6.
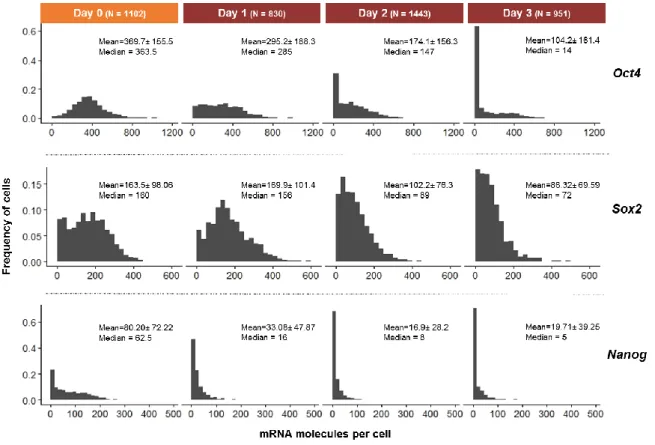
Concerning the distributions of mRNA molecules per cell for Oct4, Sox2 and Nanog, at day 0, they are similar to published data31,62, with Oct4 presenting a unimodal, Sox2 a bimodal
and Nanog a long-tailed distribution. These distribution patterns suggest that, in pluripotency conditions, both Nanog and Sox2 present a bursty-like transcription, as discussed in section 1.3. In addition, Sox2 distribution reveals the existence of two cellular states within the analysed mES cell population (Figure 5): one expressing low numbers of Sox2 mRNA molecules per cell, and another expressing higher levels of Sox2 transcripts. The distribution of Oct4 transcripts per cell, at day 0, suggests that its transcription occurs without bursts and with relatively small amount of noise, as indicated by its unimodal/Gaussian-like distribution61; however, this
distribution could also be influenced by the relatively long half-live of Oct4 mRNAs (Table S5) leading to the accumulation of mRNA molecules even when transcription had ceased, thereby masking an undergoing burst-like transcription 46.
Upon neural commitment (Day 1 onwards), a decrease in the number of Oct4 and
Nanog transcripts per cell is observed, suggesting deactivation of the pluripotent gene
regulatory network and gradual exiting from pluripotency. As for Sox2, it displays a small decrease in the number of transcripts per cell during neural commitment, in agreement with the
Figure 5- Histograms of the distribution of Oct4, Sox2 and Nanog mRNA molecules per cell, for 46C cells fixed at different
time points. The number of analysed cells in each condition is shown in brackets. Mean±standard deviation and median values are shown to each cell population.
17 evidence that Sox2 is not only involved in the maintenance of the pluripotent state but also in neural commitment 22,24.
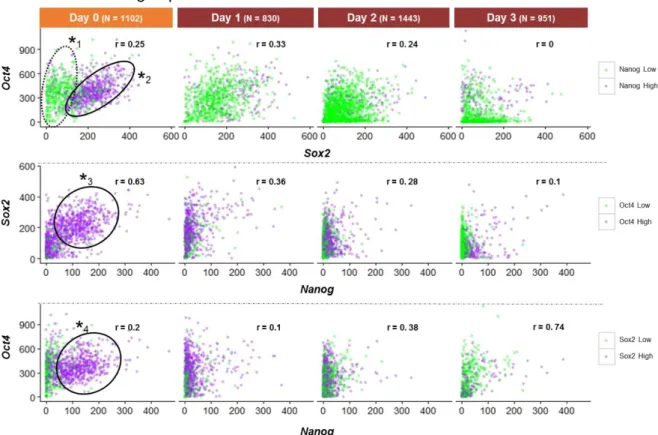
To analyse the co-expression of these genes in single mES cells, two-colour correlation dotplots were obtained (Figure 6). Concerning Oct4-Sox2 correlation (Figure 6; top), it is possible to observe, at day 0, two cellular states: one in which cells with High-Sox2 transcript levels express intermediate levels of Oct4 transcripts (Figure 6;
*
2), and another in which low expression levels of Sox2 are accompanied also by intermediate levels of Oct4 expression (Figure 6;*
1) . The first state is also characterized by the high levels of Nanog expression and represents the pluripotent state. The other state shows low levels of Nanog expression highlighting a population of pluripotent cells that is undergoing a negative phase of the fluctuations in Nanog expression 31.Upon neural commitment, the number of mES cells at the pluripotent state decreases and, by day 3, only few cells remain pluripotent (high levels of Oct4, Sox2 and Nanog mRNA molecules per cell). Along neural commitment, the correlation between the transcripts of Oct4 and Sox2 changes and, at day 3, the majority of cells expressing high levels of Sox2 transcripts show low numbers of Oct4 transcripts, meaning that when cells are exiting pluripotency (decrease of Oct4 expression) into neural commitment, Sox2 expression is maintained, highlighting the importance of its expression during commitment to neural fate. Concerning the correlation between Nanog and Sox2 mRNA molecules per cell (Figure 6; middle), there is a
Figure 6- Two-colour dot plot graphs showing the correlations between the number of mRNA molecules of Sox2, Oct4 and Nanog
18 positive correlation at day 0 (r = 0.63), and cells with high levels of Nanog and Sox2 expression have also high levels of Oct4 transcripts (Figure 6;
*
3). This population disappears as cells commit to neural lineage, and this is more evident by the decrease in the number of Nanog mRNA molecules per cell. As for Oct4 and Nanog correlation (Figure 6; bottom) the pluripotent population of mES cells is evident at day 0, expressing high levels of Oct4, Nanog and Sox2 mRNA molecules per cell (Figure 6;*
4). As expected, the number of mES cells expressing high levels of mRNAs from pluripotent genes decreases along neural commitment (Day 1 onwards). Interestingly, at day 3, a positive correlation between Oct4 and Nanog mRNA levels(r= 0.74) is observed, although this value is mostly due to the high prevalence of cells with low expression levels of both genes that correspond to 73% of the analysed cells. Still, there is approximately 10% of cells expressing high levels of the two genes, and this might reflect a population of pluripotent epiblast-like cells that is known to be maintained in the embryo up to E8 24.These results confirm the higher expression of pluripotency genes (Nanog, Oct4 and
Sox2) at day 0, when mES cells are cultured in pluripotent conditions (BMP4 LIF). During neural
lineage commitment, a decrease in the number of pluripotent cells is observed. This is more evident by following the decrease in Oct4 and Nanog expression, the best correlate for the dismantling of the pluripotency network when mES cells commit to neural lineage.
For further analysis, a set of genes was selected: Car2 and Cldn6, as stochastic genes, differentially expressed in pluripotent Low vs High NANOG cells; Cdh2, Sox3 and Crabp2 as genes known to be involved in neural commitment, Fgf5 and Dnmt3b as genes upregulated in the postimplantation epiblast, and T as being an early marker of mesodermal commitment and when co-expressed with Sox2 marking cells with NMp identity. Furthermore, transcripts from these genes have relatively short half-lifes60 (Table S5), which facilitates the analysis of
transcriptional dynamics along neural differentiation.
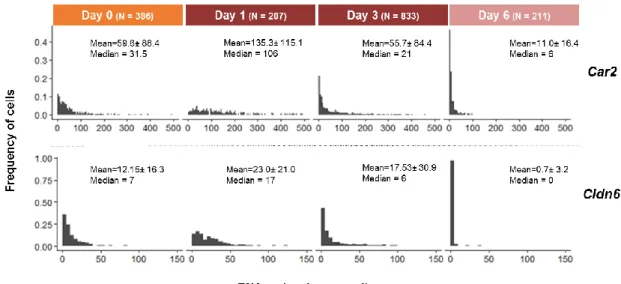
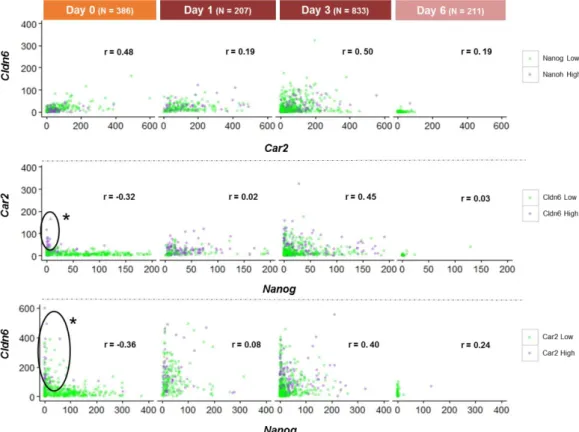
4.2.2 Expression of stochastic genes along neural differentiation
Car2 and Cldn6 were selected based on their differential expression between
Low-Nanog and High-Low-Nanog cells (RNA-seq data; E. Abranches, unpublished data), with Low-Low-Nanog cells displaying significantly higher expression levels of these genes compared to High-Nanog cells, suggesting that transcription of these genes occur when mES cells undergo “lineage priming”, becoming more susceptible to enter differentiation. Car2 encodes for cytosolic carbonic anhydrase 2, and Cldn6 encodes for the tight junction protein CLAUDIN6, involved in cell-cell adhesion. No known functions have been yet ascribed to these genes during pluripotency or entry into differentiation. In order to understand the transcriptional dynamics of these genes along neural commitment, 46C cells fixed for smFISH at days 0, 1, 3 and 6 of the monolayer protocol were examined for Car2, Cldn6 and Nanog transcripts. The distributions