Universidade de Lisboa
Faculdade de Ciências
Departamento de Biologia Animal
Distribution and Shape Analysis of
Phorcus lineatus and Phorcus sauciatus
along the Portuguese Coast
Mestrado em Ecologia Marinha
Margarida Antunes da Costa
Dissertação orientada por:
Professor Doutor José Paula
Doutora Diana Boaventura
AGRADECIMENTOS
Gostaria de agradecer a todos os que, directa ou indirectamente, me ajudaram e contribuíram para a realização desta tese, nomeadamente:
Ao Professor José Paula, pela enorme acessibilidade e disponibilidade em esclarecer as imensas dúvidas e problemas que surgiram ao longo do trabalho e pela ajuda constante no melhoramento de todos os conteúdos desta tese.
À Doutora Diana Boaventura, pela prontidão com que sempre se disponibilizou para ajudar e corrigir esta tese. Os seus conselhos e sugestões enriqueceram esta tese.
À Carolina Madeira, pelo precioso Manual de Morfometria, e pelas imensas questões respondidas e ajuda prestada.
Ao Professor Rui Rebelo e à Doutora Catarina Vinagre pela ajuda na estatística.
À minha irmã pelo apoio e pela motivação que sempre deu, por me ter aturado por tanto tempo, por ter estado sempre presente.
À Luísa Ramalho, pela companhia e pela disponibilidade constante para ajudar
À minha família. Ao Roberto e à Julieta, que ronronaram e se deixaram esmagar quando mais precisei.
Por fim aos meus amigos, às Migas, aos biólogos e a todos os outros, aos da Pranima, aos que estiveram perto, e aos que estando longe estiveram sempre comigo, aos de infância e aos da universidade, da licenciatura e do mestrado. Porque cada um me deu algo que me fez chegar aqui.
iii
RESUMO
As costas rochosas estão entre os locais mais extremos, heterogéneos e dinâmicos da Natureza, sujeitos a condições extremas que influenciam a distribuição espacial e a colonização de inúmeras espécies. Nestas zonas ocorrem dois principais gradientes ambientais: um horizontal - presente ao longo da linha da costa - e um vertical - causado pela interface entre o ar e a água. Ao longo do gradiente horizontal existe um gradiente de exposição à acção das ondas, que é fortemente influenciado pela topografia da costa, nomeadamente pela presença de cabos, nos quais um dos lados está mais protegido do hidrodinamismo. Assim, cabos são locais apropriados para estudar a adaptação dos organismos às diferentes condições hidrodinâmicas, exactamente por proporcionarem habitats contrastantes no que toca ao hidrodinamismo.
A exposição à vaga tem um efeito profundo nas características ecológicas e biológicas de uma costa, afectando a distribuição dos organismos. Uma crescente exposição conduz a um crescente risco de desprendimento e danos físicos, limitando assim a distribuição de espécies mais frágeis e susceptíveis. Nos locais mais expostos, apenas os organimos capazes de se manterem agarrados nas rochas são encontrados.
As conchas constituem um registo ontogenético dos indivíduos. O estudo da forma das conchas em relação a factores ambientais permite assim perceber como determinado factor influencia a forma da concha. Em espécies próximas, uma variação na forma das conchas pode indicar uma variação dos seus hábitos de vida. Neste caso, estas diferenças na forma poderão indicar diferentes respostas para a mesma pressão selectiva, bem como diferenças em processos de crescimento e morfogénese, uma vez que é espectável que pressões ecológicas semelhantes resultem no desenvolvimento de características morfológicas semelhantes.
Dos grupos de organismos existentes na zona intertidal, os gastrópodes são dos mais abundantes e bem representados. Para além de facilmente identificáveis, apresentam diferenças nas conchas que são mensuráveis, por exemplo, forma ou tamanho, que podem ser relacionadas com um determinado factor ambiental.
Phorcus Risso 1826 é um género de troquídeo herbívoro (Gastropoda Prosobranchia) que habita as costas rochosas, desde o Mar Mediterrâneo até ao Atlântico Norte. Na costa portuguesa destacam-se Phorcus lineatus (da Costa, 1778) e Phorcus sauciatus (Koch, 1845).
iv P. lineatus é maioritariamente encontrado em zonas com poças e fendas, protegidas da acção directa da vaga, geralmente na zona supratidal. Esta espécie tem o limite norte de distribuição entre o País de Gales e Irlanda. A sua distribuição é contínua ao longo da costa de França, Espanha e Portugal, atingindo o seu limite sul em Marrocos. P. sauciatus é uma espécie subtropical que atinge a limite norte da sua distribuição na Peninsula Ibérica. Geralmente são encontrados em plataformas rochosas de inclinação suave, geralmente mais expostas ao hidrodinamismo.
Neste contexto, com a presente dissertação pretende-se realizar um estudo morfométrico da concha destas duas espécies na costa continental portuguesa, e desta forma aumentar o conhecimento neste tema, que é até à data algo restrito, especialmente em P. sauciatus. Foram abordadas as seguintes questões: (1) Como varia a abundância das duas espécies ao longo da costa?; (2) Qual a influência da latitude na variação do tamanho e forma da concha?; (3) Qual a influencia da exposição da costa no tamanho e forma da concha?; e (4) A forma da concha varia durante a ontogenia?
Para isso, foram recolhidos indivíduos de Phorcus lineatus e Phorcus sauciatus em 29 locais da costa Portuguesa, no lado norte e no lado sul de vários cabos, desde a praia da Papoa (39°22'12.51"N / 9°22'38.72"O) à praia da Luz (37° 5'5.96"N / 8°43'1.94"O), num gradiente geográfico norte-sul de aproximadamente 400km.
Cada um dos 2193 espécimes recolhidos nos 29 locais foi identificado, medida a altura máxima e a largura máxima da concha (medidas de abordagem tradicional), e feito o registo fotográfico em condições constantes (para posterior análise de abordagem geométrica).
Para o estudo geométrico geográfico foram escolhidos 50 espécimes de cada local, com uma largura entre 13 mm e 17 mm. Para o estudo geométrico ontogenético, foi escolhida uma população de cada uma das duas espécies, e os espécimes foram divididos em quatro classes de largura, cada uma com 50 espécimes: I- [1 mm - 5 mm], II- [6 mm - 10 mm], III- [11 mm - 15 mm], IV- [16 mm - 20 mm], referidas daqui em diante como classes de tamanho.
A morfometria geométrica é a caracterização quantitativa, análise e comparação das formas biológicas. Foi utilizado o método de Procrustes, que assenta na translação, escalamento e rotação da informação morfométrica, removendo toda a informação não relacionada com a forma do indivíduo. Este método demonstra as diferenças entre uma forma de referência e a forma alvo, evidenciando a dispersão de pontos (landmarks) marcados homologamente na forma alvo, ou seja, nos exemplares que se pretende analisar. Deste modo, foram marcados 14 pontos homólogos, na fotografia de cada exemplar, para posterior análise no software de análise morfométrica geométrica.
v Utilizou-se uma análise de covariância (ANCOVA) nas medidas tradicionais, e uma análise de variância aninhada multivariada (MANOVA), nos valores RW (RW scores), outputs da análise geométrica.
A variação da forma das conchas foi então estudada em dois níveis: Geométrico e Ontogenético. No primeiro realizou-se uma abordagem em relação à latitude, abrangendo todas as praias ao longo da costa, e em relação à exposição à vaga. Neste último caso, de modo a perceber o efeito do hidrodinamismo a diferentes escalas espaciais, foi considerando o efeito da orientação da costa a norte ou a sul dos cabos, independentemente do cabo; o efeito da orientação da costa em cada cabo, e ainda um estudo numa escala mais restrita, comparando duas populações de um mesmo local.
Como esperado, houve uma predominância clara de P. lineatus no norte e de P. sauciatus no sul. Ingrina foi uma excepção - localizada a sul, nesta praia P. lineatus foi mais abundante. Neste caso, a latitude poderá não ser o principal factor a influenciar a distribuição destas espécies, mas sim a exposição e tipo de substrato.
Em relação ao estudo latitudinal, a morfologia da concha não apresentou um padrão claro quando consideradas todas as populações da costa. No entanto, considerando o Método Tradicional, em P. lineatus foi, ligeiramente, perceptível um gradiente geográfico - houve uma tendência para conchas mais largas e mais altas nas populações do norte, e indivíduos de menores dimensões no sul. Diferentemente, P. sauciatus apresentou uma largura mais uniforme, não revelando assim qualquer padrão evidente. A abordagem Geométrica não demonstrou qualquer padrão claro ao longo da costa, mas, no entanto, alguns locais apresentaram-se claramente distintos de outros. Tendo em conta que a extensão latitudinal da costa Portuguesa é reduzida, e que ao longo da costa existem inúmeros acidentes geomorfológicos que influenciam a exposição costeira e que tornam a costa Portuguesa muito heterogénea, é de facto difícil observar um um padrão de forma claro.
Considerando o efeito da exposição à vaga na morfologia da concha, através da abordagem Tradicional, e tendo em conta os efeitos integrados de orientação da costa, os indivíduos de ambas as espécies são ligeiramente mais largos e achatados no lado norte dos cabos, onde, devido à ondulação oceânica dominante noroeste (swell), a exposição à vaga é mais forte. No que diz respeito à variação em cada cabo e em duas populações de dois lados diferentes da mesma praia, a forma das duas espécies foi muito variável, e um padrão foi visível apenas em poucos casos. Relativamente à abordagem geométrica não foi de todo visível uma diferenciação clara de forma da concha.
A variabilidade observada na morfologia da concha de ambas as espécies poderá indicar que a exposição à vaga e a latitude não são suficientes para moldar estas espécies diferentemente.
vi Em relação ao estudo morfométrico da ontogenia, em ambas as espécies, à medida que os indivíduos crescem, a relação entre largura e altura torna-se mais dispersa. No que diz respeito à sua forma foram encontradas diferenças ao longo a ontogenia, com classes de tamanho a variar a sua forma à medida que os seus hábitos mudam.
São inúmeros os factores que influenciam a morfologia da concha, e sua interacção pode ter conduzido a uma falta de um padrão evidente, uma vez que não foram considerados no presente estudo.
vii
ABSTRACT
Exposure has a deep effect on the biological and ecological characteristics of a shore, affecting the distribution of organisms. The level of wave exposure is deeply influenced by shore topography, for example, the presence of capes shelters part of the coast from the wave action. Capes are suitable places for studying organisms’ adaptation to the wave action since they provide contrasting situations of wave exposure.
Phorcus Risso 1826 are herbivorous trochids (Gastropoda Prosobranchia) present from the Mediterranean Sea through the North Atlantic. In the Portuguese coast the dominant species are Phorcus lineatus (da Costa, 1778) and Phorcus sauciatus (Koch, 1845). Phorcus lineatus is mainly found in areas with rock pools, cracks, crevices or under boulders of the upper half of the intertidal zone. This species reaches its northern limits in Wales and Ireland and its distribution is continuous from the French coastlines until Morocco. Phorcus sauciatus is a common subtropical grazer that reaches its northern boundary in the Iberian Peninsula and usually inhabits extensive and gently sloping rocky platforms.
In this study it was intended to uncover differences in the morphology of these two species from different locations along the Portuguese coast. Four questions were addressed: How does the abundance of these species vary along the Portuguese coast? ; What is the influence of latitude on the variation of shell size and shape? ; What is the influence of shore exposure on shell size and shape variation? ; Does shell shape vary during ontogeny?
To answer these questions, P. lineatus and P. sauciatus were collected from 29 sites, in the northern and the southern side of several capes, ranging a geographical north-south gradient of 400 km along the Portuguese west coast. The collected specimens were identified, measured (maximum height and maximum width, traditional morphometric approach) and photographed (geometric morphometric approach).
Firstly, shell morphology was analysed in a geographic perspective, evaluating the influence of latitude and exposure to wave action on the shell shape. Concerning wave exposure, three scales were considered: the integrated effects of shore orientation, the effects of orientation in each cape, and a short scale comparison of two sides of the same beach.
Secondly, considering one population of each species, shell morphology was analysed in an ontogenetic perspective, in which specimens were compared regarding four size classes.
viii As expected, there was a clear dominance of P. lineatus in the northern coast and of P. sauciatus in the southern coast. Ingrina was one exception - in this southern beach P. lineatus was more abundant. In this case, latitude may not be the major factor influencing these species distribution, but rather exposure and type of substrate.
Regarding the latitudinal study, shell morphology did not show a clear pattern when considering all populations from the Portuguese coast. Considering the traditional method, however, in P. lineatus a geographic gradient was apparent in some extent - there was a tendency for broader and higher shells in the northern populations, and smaller individuals in the south. Differently, P. sauciatus presented a more uniform width, revealing no evident pattern. The geometric approach did not show any clear pattern throughout the coast but there were some locations clearly distinct from the others. Since the latitudinal range of the Portuguese coast is not very wide, and throughout the coast there are several geomorphological accidents that influence the coastal exposure, making the Portuguese coast very heterogeneous, a clear shape pattern is difficult to observe.
Concerning the effect of wave exposure on shell morphology, through the traditional approach, and considering the integrated effects of shore orientation, specimens of both species are slightly broader and flatter in the north side of the capes where, due to the dominant northwest oceanic swell, the exposure is stronger. In the smaller scales studied, i.e. variation in each cape and in two populations from two different sides of the same beach, the shape of the two species was very variable, and a pattern was only visible in few cases. Regarding the geometric approach a clear differentiation of populations’ shell shape was not found.
The variability found in the shell morphology of both species indicates that neither the exposure nor the latitude is enough to shape these species differently.
Regarding the ontogenetic morphometric study, in both species, as individuals grow, the relation between width and height becomes more disperse. As for their shape, differences throughout the ontogeny were found, with size classes varying their shape as their life habits change.
Several factors definitely influence shell morphology, and their interaction may lead to a lack of an evident pattern, since they were not all considered in the present study.
ix
LIST OF FIGURES
Fig. 1. A: two typical Phorcus lineatus individuals; B: typical Phorcus sauciatus specimen. Note the coloured layer of the shell is visible inside the aperture. ... 10 Fig. 2. Sampling locations for P. lineatus and P. sauciatus along the Portuguese coast: 1 - Papoa; 2- Portinho da Areia Norte East; 3 - Portinho da Areia Norte West; 4 - Cruz dos Remédios; 5 - Portinho da Areia Sul; 6 - Mexilhoeira; 7 - Maçãs; 8 - Cabo Raso; 9 - Avencas; 10 - Bicas; 11 - Foz; 12 - Lagosteiros North; 13 - Lagosteiros South; 14 - Porto da Baleeira; 15 - Ribeira do Cavalo; 16 - Pedras Amarelas; 17 - Burrinho; 18 - Queimado; 19 - Porto do Canal; 20 - Alteirinhos; 21 - Vale dos Homens North; 22 - Vale dos Homens South; 23 - Monte Clérigo; 24 - Amado; 25 - Cordoama; 26 - Ponta Ruiva; 27 - Telheiro; 28 - Ingrina; 29 - Luz. Samples used in the geographic morphometric study; samples also used in ontogenetic morphometric study: P. lineatus and P. sauciatus. ... 14 Fig. 3. Measures. W = Maximum Shell Width and H = Maximum Shell Height ... 16 Fig. 4. Position of the 14 landmarks on the shell: LM1 - maximum curvature of the last whorl; LM2, LM4 and LM5 - sutures of the last and second whorls; LM3 - apex; LM6 - beginning of the shell’s lip; LM7 - visual intersection of the lip with the basis of the first whorl; LM8 - most external point in the outer lip; LM9 - lowest point of the outer lip; LM10 - vertical projection of the apex; LM11 - edge of the nacreous surface; LM12, LM13 and LM14 - maximum indentation points above and below the columela’s tooth. 18 Fig. 5. Species relative abundance (%) along the Portuguese coast sampled: 1 - Papoa; 2- Portinho da Areia Norte East; 3 - Portinho da Areia Norte West; 4 - Cruz dos Remédios; 5 - Portinho da Areia Sul; 6 - Mexilhoeira; 7 - Maçãs; 8 - Cabo Raso; 9 - Avencas; 10 - Bicas; 11 - Foz; 12 - Lagosteiros North; 13 - Lagosteiros South; 14 - Porto da Baleeira; 15 - Ribeira do Cavalo; 16 - Pedras Amarelas; 17 - Burrinho; 18 - Queimado; 19 - Porto do Canal; 20 - Alteirinhos; 21 - Vale dos Homens North; 22 - Vale dos Homens South; 23 - Monte Clérigo; 24 - Amado; 25 - Cordoama; 26 - Ponta Ruiva; 27 - Telheiro; 28 - Ingrina; 29 - Luz. P. lineatus is represented in dark grey, and P. sauciatus in light grey. ... 24 Fig. 6. Variation of shell width and shell height of P. lineatus (A) and P. sauciatus (B) along the coast, in all populations except the ones with less than ten individuals. ... 27 Fig. 7. Relation of shell height (mm) with shell width (mm) of P. lineatus (A) and P. sauciatus (B) specimens, considering all specimens for the north of capes, and all specimens of the south of capes. . 28 Fig. 8. Mean and Standard Deviation of shell height (mm) and shell width (mm) of specimens considering the integrated effects of shore orientation. All populations located in the north of capes were grouped together, as well as populations located in the south of capes. ... 29 Fig. 9. Results from the ANCOVA on the variation of width and height of shells, comparing Northern (blue) and Southern (orange) populations of P. lineatus; ... 30 Fig. 10. Results from the ANCOVA on the variation of width and height of shells, comparing Northern (blue) and Southern (orange) populations of P. sauciatus; A - Cape Raso; B - Cape Espichel; C - Cape of Sines; D - Cape of São Vicente. ... 31 Fig. 11. Locations with two sampling sites were analysed for width/height variation with exposure. P. lineatus: A - Portinho da Areia Norte East and West; B - Lagosteiros North and South; C - Vale dos Homens North and South; P. sauciatus: D - Vale dos Homens North and South. Sampling sites located on
x the North or East side of the beaches are represented in black and the ones from the South or West in grey. ... 32 Fig. 12. Width and height variation of P. lineatus’ population from Avencas. Each symbol represents a different size class, corresponding to different age classes: (I- [1 mm - 5 mm], II- [6 mm - 10 mm], III- [11 mm - 15 mm], and IV - [16 mm - 20 mm]. ... 33 Fig. 13. Width and height variation of P. sauciatus’ population from Ponta Ruiva. Each symbol represents a different size class, corresponding to different age classes: (II- [6 mm - 10 mm], III- [11 mm - 15 mm], and IV - [16 mm - 20 mm]. ... 34 Fig. 14. Spline grids showing shape deformation along Relative Warps 1 and 2 of the shell of P. lineatus (above) and P. sauciatus (down). The graph illustrates the specimens’ distances to the mean configuration of the shell (graph origin 0.0). Each point in the scatterplot represents a unique shape and the axes represent vectors of shape change. ... 36 Fig. 15. The graph illustrates the specimens’ distances to the mean configuration of the shell (graph origin 0.0). Each point in the scatterplot represents a unique shape and the axes represent vectors of shape change. The ellipses correspond to a probability of 90% of the points being distributed within their limits ... 38 Fig. 16. Variation of shell shape of P. lineatus (A) and P. sauciatus (B). The populations from the Northern side of the capes are represented in blue, and the ones from the Southern side are represented in orange. The graph illustrates the specimens’ distances to the mean configuration of the shell (graph origin 0.0). Each point in the scatterplot represents a unique shape and the axes represent vectors of shape change. The ellipses correspond to a probability of 90% of the points being distributed within their limits ... 39 Fig. 17. Variation of shell shape of P. lineatus comparing locations from the North with locations from the South of each cape. 1 - Cape Raso; 2 - Cape Espichel; 3 - Cape of Sines; 4 - Cape of São Vicente. The graph illustrates the specimens’ distances to the mean configuration of the shell (graph origin 0.0). Each point in the scatterplot represents a unique shape and the axes represent vectors of shape change. The ellipses correspond to a probability of 90% of the points being distributed within their limits. ... 41 Fig. 18. Variation of shell shape of P. sauciatus comparing locations from the North with locations from the South of each cape. 1 - Cape Raso; 2 - Cape Espichel; 3 - Cape of Sines; 4 - Cape of São Vicente. The graph illustrates the specimens’ distances to the mean configuration of the shell (graph origin 0.0). Each point in the scatterplot represents a unique shape and the axes represent vectors of shape change. The ellipses correspond to a probability of 90% of the points being distributed within their limits. ... 43 Fig. 19. Locations with two sampling sites - one exposed and the other sheltered - were analysed for shape variation with exposure. P. lineatus: A - Portinho da Areia Norte East and West; B - Lagosteiros North and South; C - Vale dos Homens North and South; P. sauciatus: D - Vale dos Homens North and South. Sampling sites located on the North or East side of the beaches are represented in black and the ones from the South or West in grey. The graph illustrates the specimens’ distances to the mean configuration of the shell (graph origin 0.0). Each point in the scatterplot represents a unique shape and the axes represent vectors of shape change. The ellipses correspond to a probability of 90% of the points being distributed within their limits. ... 44 Fig. 20. Spline grids showing shape deformation along Relative Warps 1 and 2 of the shell of P. lineatus (up) and P. sauciatus (down). The graph illustrates the specimens’ distances to the mean configuration of the shell (graph origin 0.0). Each point in the scatterplot represents a unique shape and the axes
xi represent vectors of shape change. The ellipses correspond to a probability of 90% of the points being distributed within their limits. ... 46 Fig. 21. The graph illustrates the specimens’ distances to the mean configuration of the shell (graph origin 0.0). Each point in the scatterplot represents a unique shape and the axes represent vectors of shape change. The ellipses correspond to a probability of 90% of the points being distributed within their limits. (A - P. lineatus and B - P. sauciatus) ... Error! Bookmark not defined.
xii
LIST OF TABLES
Table I. Number of specimens used in the geographic morphometric study from each sampling site. .... 15
Table II. Number of specimens of each species in each size class used in the ontogenetic morphometric study... 15
Table III. Selected P. lineatus populations ... 20
Table IV. Selected P. sauciatus populations... 20
Table V. P. lineatus and P. sauciatus mean shell height and width (±SD). ... 25
Table VI. Results from the ANCOVA on width and height for P. lineatus (left) and P. sauciatus (right), comparing locations from the North with locations from the South of each cape. ... 32
Table VII. Results from the ANCOVA performed on the on width/height for P. lineatus, comparing two sampling sites from the same beach location. ... 33
Table VIII. Results from the nested MANOVA ... 40
Table IX. Results from the nested MANOVA ... 42
TABLE OF CONTENTS
INTRODUCTION ... 3
Intertidal Rocky Shores ... 3
Coastal setup of the Portuguese Coastline ... 4
Wave Exposure ... 5
Morphological Variation ... 6
Morphometric Analysis ... 7
Studied Species ... 8
OBJECTIVES ... 11
MATERIALS AND METHODS ... 13
1. Sampling design and Processing ... 13
2. Morphometric Analysis ... 16
3. Statistical Analysis ... 19
3.1. Geographic Morphometric Study ... 19
3.2. Ontogenetic Morphometric Study ... 21
RESULTS ... 23
1. Abundance ... 23
2. Morphometry - Traditional Approach... 23
2.1. Geographic Morphometric Study ... 26
2.2. Ontogenetic Morphometric Study ... 33
3. Morphometry - Geometric Approach ... 34
3.1. Geographic Morphometric Study ... 35
3.2. Ontogenetic Morphometric Study ... 45
DISCUSSION ... 49
(1) How does the abundance of these two species vary along the Portuguese coast? ... 49
(2) What is the influence of latitude on the variation of shell size and shape? ... 51
(3) What is the influence of shore exposure on shell size and shape variation?... 53
(4) Does shell shape vary during ontogeny? ... 57
FINAL REMARKS ... 59
3
INTRODUCTION
Intertidal Rocky Shores
Rocky shores are among the most extreme, heterogeneous and dynamic environments in nature (Johannesson 2003; Raffaeli & Hawkins 1996) subject to extreme conditions that influence spatial distribution and colonization of many species (Ramirez et al. 2005). Dependent on their geology, rocky shores can be crossed with cracks, crevices, gullies and pools (Raffaelli & Hawkins 1996).
The rocky shores have two main environmental gradients: a horizontal one, along the coastline; and a vertical one. Although intimately associated with tides, the vertical gradient is not generated by them, but by the interface between air and water. Tides simply amplify this existing gradient by moving the water’s limit up and down, thereby increasing the amount of living space for organisms (Raffaelli & Hawkins 1996). Therefore, along the vertical gradient there is a unidirectional stress, where the environmental conditions (such as emersion periods, wave action, temperature, salinity, and irradiation) vary from a completely aquatic environment to a completely terrestrial one, creating an extremely heterogeneous habitat, and consequently subjecting organisms to different levels of thermal and hydric stress (Ramirez et al. 2005).
Along the horizontal axis there is a gradient of exposure to the wave action, from sheltered bays to exposed headlands. This gradient exists both among microhabitats within shores and between different shores, affecting organisms mainly by physical disturbance in the water (Lindegarth & Gamfeldt 2005). The extent of wave action on the shore is determined by the aspect to the dominant winds coupled with the ‘fetch’, that is the distance over which the wind blows (Raffaeli & Hawkins 1986). Shores with a longer fetch have stronger wave action because the wind has a greater distance to create the height of the waves (Raffaeli & Hawkins 1986).
The interaction between these two gradients deeply influences organisms’ distribution in rocky shores. Species are distributed depending on their physical and physiological tolerance for all these environmental factors, developing various adaptations to withstand the different hydrodynamic conditions (Raffaeli & Hawkins 1996; Lindegarth & Gamfeldt 2005). This distribution is called ‘zonation’, and it can be recognized along rocky shores (Stephenson & Stephenson 1949; Raffaeli & Hawkins 1996). Zonation is therefore influenced by many factors,
4 including wave exposure, temperature, salinity, substrate orientation and composition, and tidal dynamics (Stephenson & Stephenson, 1949; 1972). Due to this complexity, variation in one factor often masks the effects of another (Harley & Helmuth 2003).
Coastal setup of the Portuguese Coastline
Geographic location can be considered an important and all-embracing environmental gradient (Raffaelli & Hawkins 1996). Located between three important biogeographic areas - the cold temperate Atlantic, the warm temperate Atlantic and the Mediterranean - the Portuguese coast has a very interesting biogeographical context, constituting an important transition zone, an interface between distinct biogeographic provinces, where marine species with boreal, temperate and subtropical affinities occur in sympatry (Marques et al. 2006). The Nazaré Canyon, in Peniche, is one of the largest submarine canyons of Europe, intersects the Portuguese continental margin between 39°20′N and 40°N (Stigter et al. 2007; Tyler et al. 2009), and it is considered a biogeographic limit to several marine species thus, including the transition zone of the biogeographic province, by the Nazaré canyon, to the south coast.
The west Portuguese coast extends along the 9°W meridian between 37°N and 42°N, and the south coast (Algarve) is oriented along 37°N, between 7°20'W and 9°W (Fiúza et al. 1982). On the western Portuguese coast, sea surface temperature (SST) reveals marked seasonality, varying between 13 and 15oC during winter, and reaching 20oC or more during summer. On the south coast, temperatures are in general slightly higher (approximately 1 - 1.5oC) (Boaventura et al. 2002; Fiúza et al. 1982), a difference even more marked during summer.
Oceanographic current systems are known to represent a major influence on coastal ecosystems as they are largely responsible by the temperature and nutrient status of the adjacent waters (Raffaeli & Hawkins 1996), which influences the distribution of organisms throughout the shore. Therefore, besides the northerly wind-induced upwelling occurring from July to September (Boaventura et al. 2002; Fiúza et al. 1982; Lemos & Pires 2004), which has a marked influence on shore communities (Raffaeli & Hawkins 1996), this temperature variation may be explained by the fact that the west Portuguese coast is under the direct influence of the eastern limb of the North Atlantic Subtropical Gyre - the Portugal Current- which brings colder water from higher latitudes. On the contrary, the coast of Algarve is sheltered from this circulation and upwelling is intermittent and short-lived (Barton 2001), so its effects are felt with much less intensity (Fiúza et al. 1982).
5 Another important factor in oceanographic feature of the Portuguese coast that may contribute to these different temperatures between the west and south coast of Portugal is the swell. Due the predominant northwest oceanic swell, the mean wave conditions are similar throughout the west coast, reaching values of over 5 m during winter. The south coast it’s not exposed to that swell, and consequently the wave conditions are less severe, reaching only 3 m on the same season (Boaventura et al. 2002).
Wave Exposure
Exposure means how much wave action a shore experiences (Raffaelli & Hawkins 1996). In marine intertidal habitats, the importance of this variable as a structuring agent is widely agreed upon (Lindegarth & Gamfeldt 2005). It has a deep effect on the biological and ecological characteristics of a shore (Lindegarth & Gamfeldt 2005; Raffaelli & Hawkins 1996), influencing species’ biology and ecology (McQuaid & Lindsay 2007; D’Amours & Scheibling 2007). Wave action affects organisms directly through mechanisms such as physical disturbance (Vadas et al. 1990), fluxes of propagules and nutrients, and sedimentation (Lindegarth & Gamfeldt 2005). Indirectly, it can cause mortality of juvenile and adult assemblages through dislodgement of algae, rocks and debris (Vadas et al. 1990). Indirect effects are often more subtle and can be easily mistaken with the impacts of other variables such as tidal height, biotic interactions, temperature, etc. (McQuaid & Lindsay 2007; Harley & Helmuth 2003).
Exposure to wave action affects the distribution of organisms (Lindegarth & Gamfeldt 2005). Exposed conditions are favourable for suspension feeders and sessile predators, since the water movement allows the flow of food and preys to these organisms (Raffaelli & Hawkins 1996). However, increasing exposure involves an increased risk of dislodgement and physical damage, limiting the range of susceptible and physically fragile species. In the most exposed situations, only those able to maintain a firm hold on rocky surfaces are found (Trussell 1997). For some species the attachment to the shore, or even foraging, is difficult in wave exposed areas, and sheltered conditions are more favourable (Raffaelli & Hawkins 1996).
The level of wave exposure is deeply affected by shore topography, for example, capes and headlands shelter part of the coast from the wave action by protecting one of its sides. In each side of a cape the hydrodynamic conditions are distinct, for example throughout the Portuguese west coast, the capes’ northern side is under the direct influence of the northwest oceanic swell, and the southern side is more sheltered from this exposure. Phenotypic
6 plasticity, which is the capacity of an organism to produce different phenotypes in response to environmental cues, can be an important adaptive strategy in variable environments (Trussell & Smith 2000). Thus capes are suitable places for studying organisms’ adaptation to the wave action, because different conditions can lead to different adaptations, and consequently to different phenotypes.
Morphological Variation
Shells represent ontogenetic records of their owners. In closely related species, shell shape differences may indicate a variation of their life habits (Stone, 1998). In other words, differences in shape may indicate different responses to the same selective pressures, as well as differences in processes of growth and morphogenesis (Zelditch et al. 2004),since similar ecological pressures are expected to result in similar development of morphological characters (Madeira et al. 2012).
The shell morphology of different species of high-intertidal gastropods from several different shores has been shown to vary according to the degree of exposure to wave action (Rolán et al. 2004), revealing the existence of morphological gradients (Vermeij 1973). These morphological variations are also believed to be responses to selective pressures of other factors such as desiccation and predation (Crothers 2001; Fletcher 1995). At species level, shell shape variation may also occur in a microgeographical scale (between different shore levels at the same local) and in a macrogeographical scale (between distant regions) (Avaca et al. 2013).
Other source of variability in shell morphology may be related to the presence of allometric patterns (Avaca et al. 2013). Allometry is the variation of features associated with variation of the overall size of organisms (Huxley & Teissier1936). The study of allometry is interesting not only because of its implications for form-function relationship but also because of the insight into growth and development (Zelditch et al. 2004).
Understanding the origin of morphological variation, and searching for an explanation for it, is a major research focus, including fields as diverse as functional morphology, macroevolution, sexual selection, and evolutionary developmental biology (Rosenberg 2002). Explanations for biological form are multiple and complex (Roth & Mercer 2000). Shape analysis is one approach to understand those diverse causes of variation and morphological transformation (Zelditch et al. 2004), playing an important role in biological studies (Silva et al. 2009; Zelditch et al. 2004). Roth & Mercer (2000) claim that morphometrics has provided a first step on a
7 path of inference that leads from morphology to explanations (such as natural selection and pleiotropy) drawn from other disciplines.
Morphometric Analysis
Geometric morphometrics is the quantitative characterization, analysis, and comparison of biological shape (Roth & Mercer 2000). These techniques have many advantages including the possibility to discriminate shape and size components of morphology, the graphic display of results and their easy interpretation, the preservation of geometric relationships throughout the analysis and a notable statistical power (Bookstein et al. 1985; Rohlf & Slice 1990; Avaca et al. 2013). Furthermore, geometric morphometrics allows us to easily focus on shape variation, avoiding the problems of more traditional schemes that measure size rather than shape (Silva et al. 2009).
Geometric methods can be subdivided into two principal categories: deformation methods and superimposition methods (Roth & Mercer 2000). In the latter group is included the Procrustes method, which is one of the most widespread and best understood in its mathematical and statistical properties (Mitteroecker & Gunz 2009), and the one that more directly preserves geometry and the spatial relationships among landmarks and contours of a form (Roth & Mercer 2000).
The Procrustes method relies on translation, scaling, and rotation, removing all information unrelated to shape (Zelditch et al. 2004) and it is based in the recognizable discrete anatomical loci, named landmarks, which can be found repeatedly and reliably in all specimens (Zelditch et al. 2004; Avaca et al. 2013). Landmarks not only have their own locations but also have the ‘‘same’’ locations in every other form of the sample and in the average of all the forms (Vermeij 1973). Procrustes method preserves the geometry of the landmark configurations throughout the analysis and thus allows to represent statistical results as actual shapes (Mitteroecker & Gunz 2009).
The relative warps can be used as classical morphometric variables in statistical univariate and multivariable analysis and tests (Zelditch et al. 2004). Furthermore, there is a possibility to represent the geometric meaning of the relative warps, using the thin-plate spline representation method (Carvajal-Rodríguez & Guerra-Varela 2006).
8
Studied Species
Intertidal gastropods have proved to be especially adequate in population differentiation studies mostly because they inhabit heterogeneous environments and exhibit conspicuous variation in morphology, life-history and behaviour (Fletcher 1984; Johannesson et al. 1993; Rolán et al. 2004; Trussell & Smith 2000).
Phorcus Risso 1826 is a genus of herbivorous trochids (Gastropoda Prosobranchia) that inhabits rocky shores. It is easy to find and to identify; it shows differences in measurable features (such as abundance, size and shape) that can be related to a measurable environmental variable (such as wave action and latitude) (Crothers 2001). Because of all these factors, this genus is particularly suitable for morphological variation studies, within and between populations.
There are 9 living species in the Phorcus genus (Donald et al. 2012). In this work we studied the two most abundant on the Portuguese coast, Phorcus lineatus (da Costa 1778) and Phorcus sauciatus (Koch 1841).
P. lineatus is mainly found in areas with rock pools, cracks, and crevices, and sometimes under boulders (Crothers 2001; Pedro 2004), being found grazing in the upper half of the intertidal zone (Desai 1966). This species extends much further north than any other species of Phorcus (Crothers 2001), reaching its northern distribution limits in Wales and Ireland (Kendall 1987; Pedro 2004; Donald et al. 2012). Its distribution is continuous along the Portuguese, Spanish and French coastlines, and its southern limits are reached in Morocco (Mieszkowska 2005). Phorcus sauciatus is a common subtropical grazer that reaches its northern boundary in the Iberian Peninsula (Rubal et al. 2014). Usually this species inhabits extensive, and gently sloping, rocky platforms (Ramírez et al. 2009).
Similarly to several gastropod species (Serbina 2010), in P. lineatus and P. sauciatus size and age are positively related, thus allowing to investigate population structure, growth rates, mortality rates and longevity (Crothers 1998).
P. lineatus breeding stages occur from June-July to September, and in some individuals it happens until November (Bode et al. 1986). Spawning occurs between May and August (Graham 1988). The larva hatches and settles after 4-5 days, low on the beach, migrating later to a higher level. The new settlers reach around 5-6 mm shell length by their first autumn (Crothers 1994; 2001), while their predecessors (i.e., snails one year older) can grow from 6 mm to 14 mm (Crothers 1994). After a winter interruption caused by the low temperatures
9 (Crothers 2001; Mannino et al. 2008), which slow metabolism down, growth continues rapidly through the year, before slowing again for the second winter (Crothers 2001). During their first year (apart from winter interruptions) growth is fast (Williams 1965), decreasing in their second and, thereafter, individuals grow about a millimetre a year (Crothers 1998; 2001). This abrupt stop in growth means that the animal has reached sexual maturity (Graham 1988; Crothers 1994; 2001). Molluscs in general can only grow if they conduct the majority of their energy to shell production. Reaching adult phase, most of their energy is used in reproduction (Crothers 1994), leaving little left to growth. P. lineatus individuals have been known to reach 34 mm in shell height and 15 years of age (Crothers 1998).
P. lineatus is a well-studied species with various studies about it. Contrary, very few studies addressed P. sauciatus about population structure, size or growth. The only information is that its size ranges from 5 to 26 mm (Ramírez et al. 2009). Yet, since they are closely related species, the data from P. lineatus can be extrapolated to P. sauciatus.
Intertidal gastropods from exposed areas have thin and smooth shells with wide apertures (Rolán et al. 2004), due to the large foot required to cope with the higher risk of wave displacement (Trussell 1997). In sheltered conditions they have thick shells with a narrow aperture, to resist desiccation (Raffaelli & Hawkins 1996, Tuya et al. 2005). This pattern can be seen on these two species.
P. lineatus is used as an indicator of sheltered shores. In Ballantine’s Exposure Scale (Ballantine 1961), where 1 corresponds to extremely exposed and 8 to extremely sheltered, this species is considered to be common on shores of exposure 6 and 7. On the contrary, exposure is not a major constraint for P. sauciatus. Apparently being more tolerant to wave action, it can be found lower on the shore than P. lineatus (Crothers, 2001; Rubal et al., 2014), but it is also found in sheltered shores (Rubal et al. 2014). P. sauciatus’ larger foot, and consequently larger aperture, implies that this species is less tolerant to desiccation, since it has a larger surface in contact with air. Temperature also seems to play a major role shaping the range distribution of P. sauciatus. Low SST due to upwelling events seems to be responsible for the absence of this species in North Portugal and South Galicia (Rubal et al. 2014).
P. lineatus and P. sauciatus have approximately the same size. The shape of their shell is very similar, and the colour pattern on the outside can sometimes be misleading. A typical specimen of P. lineatus has a well-marked tooth on the columela and usually there is an umbilical scar. In P. sauciatus the tooth and umbilical scar are indistinct, and often there is a conspicuous dark purple mark in the umbilical area, and usually its shell is slightly flattened.
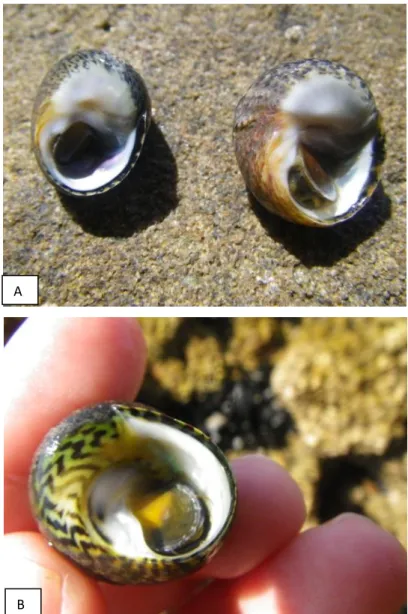
10 However there is always variation and atypical individuals, so the safest way to distinguish both species is looking to the inner colour of the aperture: in P. lineatus is always white, and in P. sauciatus there is always a coloured layer, that enters the whorl (Fig. 1).
Fig. 1. A: two typical Phorcus lineatus individuals; B: typical Phorcus sauciatus specimen. Note the coloured layer of the shell is visible inside the aperture.
A
11
OBJECTIVES
This study examined the pattern of variation in size and shell shape among populations of P. lineatus and P. sauciatus throughout the Portuguese coast. The four following questions were addressed:
(1) How does the abundance of these two species vary along the Portuguese coast?
(2) What is the influence of latitude on the variation of shell size and shape?
(3) What is the influence of shore exposure on shell size and shape variation?
(4) Does shell shape vary during ontogeny?
It is intended to uncover differences in the morphology of these two species from different locations along the Portuguese coast. Within this context, the aim of the present dissertation is to perform a morphological study of these species, and therefore expand the current knowledge on the subject, which is quite spatially limited.
13
MATERIALS AND METHODS
1. Sampling design and Processing
Samples of P. lineatus and P. sauciatus were collected from 29 sites, from Papoa (39°22'12.51"N / 9°22'38.72"W), to Luz (37° 5'5.96"N / 8°43'1.94"W), ranging a geographical north-south gradient of approximately 400 km (Fig. 2) along the Portuguese west coast.
To analyse the influence of exposure on shell shape variation, sampling was performed in the northern and the southern side of several capes along the coast. Sampling was conducted between July 2013 and February 2014.
Individuals were captured in the mid-to-upper intertidal zone of the rocky shores, in the open substrate, small crevices and pools. To speed up the sampling process, as the available time window to work depended on the available low tide, specimens were randomly collected considering only their genus. Therefore, whenever possible, between 150 and 200 individuals of Phorcus spp. were captured, as a mean to ensure the collection of at least 50 individuals of each species (see Table I). It is important to refer that due to the different distribution along the coast, at some sites, only one of the species, or very few specimens of the less abundant, were collected.
14
Fig. 2. Sampling locations for P. lineatus and P. sauciatus along the Portuguese coast: 1 - Papoa; 2- Portinho da Areia Norte East; 3 - Portinho da Areia Norte West; 4 - Cruz dos Remédios; 5 - Portinho da Areia Sul; 6 - Mexilhoeira; 7 - Maçãs; 8 - Cabo Raso; 9 - Avencas; 10 - Bicas; 11 - Foz; 12 - Lagosteiros North; 13 - Lagosteiros South; 14 - Porto da Baleeira; 15 - Ribeira do Cavalo; 16 - Pedras Amarelas; 17 - Burrinho; 18 - Queimado; 19 - Porto do Canal; 20 - Alteirinhos; 21 - Vale dos Homens North; 22 - Vale dos Homens South; 23 - Monte Clérigo; 24 - Amado; 25 - Cordoama; 26 - Ponta Ruiva; 27 - Telheiro; 28 - Ingrina; 29 - Luz. Samples used in the geographic morphometric study; samples also used in ontogenetic morphometric study: P. lineatus and P. sauciatus.
15
Table I. Number of specimens used in the geographic morphometric study from each sampling site.
Local Species
P. lineatus P. sauciatus
Papoa 50 0
Portinho da Areia Norte East 50 1
Portinho da Areia Norte West 41 0
Cruz dos Remédios 9 0
Portinho da Areia Sul 1 0
Mexilhoeira 50 0 Maçãs 50 1 Cabo Raso 50 41 Avencas 50 13 Bicas 3 50 Foz 3 50 Lagosteiros North 24 0 Lagosteiros South 13 50 Porto da Baleeira 30 50 Ribeira do Cavalo 50 0 Pedras Amarelas 50 50 Burrinho 50 50 Queimado 0 50 Porto do Canal 50 0 Alteirinhos 50 50
Vale dos Homens North 12 50
Vale dos Homens South 50 50
Monte Clérigo 50 50 Amado 50 50 Cordoama 19 50 Ponta Ruiva 27 50 Telheiro 1 50 Ingrina 50 24 Luz 50 50 Total 983 880
Table II. Number of specimens of each species in each size class used in the ontogenetic morphometric study. Class Species P. lineatus P. sauciatus I 50 0 II 50 30 III 50 50 IV 50 50 Total 200 130
To prevent degradation, the captured specimens were frozen as soon as possible. Thereafter they were separated by species, counted, and then preserved in absolute ethanol. Given that the sampling was done randomly, only in the laboratory became known the exact number of individuals of each species.
16 Only at this point the population for the morphometric ontogenetic study of each species was chosen. The selected populations were the ones with greater size range, and with a large number of individuals, that would allow a division of the sample into four width classes (I- [1 mm - 5 mm], II- [6 mm - 10 mm], III- [11 mm - 15 mm], IV- [16 mm - 20 mm], hereafter referred as size classes), each one of these with 50 specimens (whenever possible) (see Table II). For P. lineatus the chosen population was from Avencas, and for P. sauciatus from Ponta Ruiva.
For the geographic morphometric study, the 50 specimens selected were, whenever possible, approximately of the same size (between 13 mm and 17 mm width).
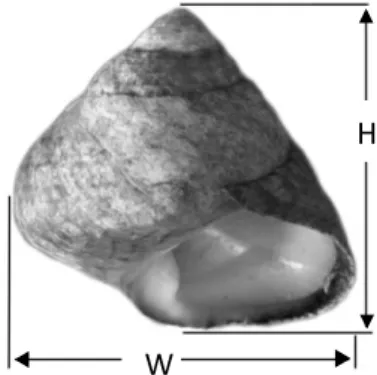
Each of the 2193 specimens’ shell from the 29 sites was measured (maximum height and maximum width, Fig. 3) and identified. Then they were photographed in adequate resolution digital images using a Nikon D70 digital camera with a 55 mm micro lens, maintaining consistent capture conditions. The specimens were photographed in apertural view, and were always placed in a consistent orientation, that is, with the shell axis parallel to the horizontal plane.
Fig. 3. Measures. W = Maximum Shell Width and H = Maximum Shell Height
2. Morphometric Analysis
The morphology of the shell was characterized in two dimensions, using geometric morphometric methods. These methods provide detailed information about the variation of the shape while preserving a visual representation of them throughout the analysis (Mitteroecker & Gunz 2009).
Firstly, the photographs of the specimens taken with the Nikon camera (jpg files) were converted into tps files using the tpsUtil 1.46 software (Rohlf 2010a). Then, 14 homologous points were chosen (Fig. 4) and digitalized in each image using the software tpsDig 2.16 (Rohlf 2010b). This procedure was performed in each species.
H
17 These points, "landmarks", are coordinates of points upon which geometric morphometric methods are based (Bookstein 1991), and were selected not only because they can be recognized in both species, but also for their relative ease in identification across samples and their capacity to describe the general shell shape.
Gastropods are known to have allometric growth (Fletcher, 1995; Vinarski, 2014; de Wolf et al., 1997), so it was necessary to evaluate the effect of size in shape variation. This was achieved using the tpsRegr 1.37 software (Rohlf 2009), by regressing each shape variable (named Relative Warps; RW) against a measure of body size and estimating the residual shape variation, which was then used for further morphometric analyses (Claverie et al. 2011).
Landmarks of each specimen were optimally aligned using Generalized Procrustes Analysis (Rohlf & Slice 1990), in which the configurations of the specimens are superimposed by translation, scaling and rotation, using the minimal bending energy method (Bookstein 1997; Mitteroecker & Gunz 2009; Rohlf & Slice 1990, Urra et al. 2007).
Centroid size, which is used as scaling factor during the superimposition process, was subsequently used as a measure of size for each individual. The term ‘shape’ used in this study is therefore defined as the geometric information that remains when location, scale and rotational effects are removed from an object (Avaca et al. 2013; Claverie et al. 2011; Madeira et al. 2012).
From the aligned specimens, shape variables were generated by performing a Relative Warp (RW) analysis (Bookstein 1991), which is the analogue of a principal components analysis (Zelditch et al. 2004).
RW analysis (Bookstein, 1991) describes shape variation as the deformation of landmarks from a reference configuration into those of each member in a group of specimens of interest (Stone 1998). This analysis reduces the dimensionality of multivariate data by transforming a set of many correlated variables into a small number of significant uncorrelated variables (Claverie et al. 2011), the relative warps. These new groups of shape variables were then used for statistical comparisons of shape variation within and between size groups and between populations. The present study also used the thin-plate spline approach, using the tpsRelw 1.49 software (Rohlf 2010c), which allowed the visualization of shape change as deformation grids.
This morphometric analysis was performed for the ontogenetic study and geographic study separately for each Phorcus species.
18
Fig. 4. Position of the 14 landmarks on the shell: LM1 - maximum curvature of the last whorl; LM2, LM4 and LM5 - sutures of the last and second whorls; LM3 - apex; LM6 - beginning of the shell’s lip; LM7 - visual intersection of the lip with the basis of the first whorl; LM8 - most external point in the outer lip; LM9 - lowest point of the outer lip; LM10 - vertical projection of the apex; LM11 - edge of the nacreous surface; LM12, LM13 and LM14 - maximum indentation points above and below the columela’s tooth. (A - Phorcus lineatus; B - Phorcus sauciatus).
A
19
3. Statistical Analysis
To investigate shell shape width/height variation significance, STATISTICA, version 10.0 (StatSoft Inc.) was used.
A covariance analysis (ANCOVA) was performed on the traditional measures, with shell width as the dependent variable, shell height as the continuous predictor and exposure/local as the categorical predictor.
A nested multivariate analysis of variance (MANOVA) was performed on the RW scores. In this way, it was determined the degree and significance of variation between capes, populations, and size classes. To test which population or size class differed within comparison, post-hoc Tukey’s honestly significant difference tests were performed.
3.1. Geographic Morphometric Study
Shape Variation along the CoastRW variation was analysed between all populations of each species, except populations with less than 10 individuals. For P. lineatus were disregarded the populations from Cruz dos Remédios (N=9), Portinho da Areia Sul (N=1), Bicas (N=3), Foz (N=3) and Telheiro (N=1). In P. sauciatus only two populations were disregarded: Portinho da Areia Norte East and Maçãs, both of them with only 1 individual. A MANOVA was performed on the RW scores, followed by the post-hoc Tukey’s honestly significant difference test.
Using the same populations, an analysis of covariance was also performed on the height and width measurements.
Wave Exposure
Integrated effects of shore orientation
In this analysis it was intended to know if the wave exposure, accessed by the position on the North or South side of a cape influences the shell morphology of P. lineatus and P. sauciatus. In this way, throughout the coast, all locations in the north side versus all locations in the south side of the capes were analysed comparatively, regardless of the cape, using an ANCOVA on the width/height measures, and a MANOVA, on the RWs.
20 This analysis was performed using populations with more than ten individuals. Note that ideally the chosen populations would have 50 specimens. Whenever this wasn’t possible, it was selected the population from the closest location, and with the specimen number close to 50.
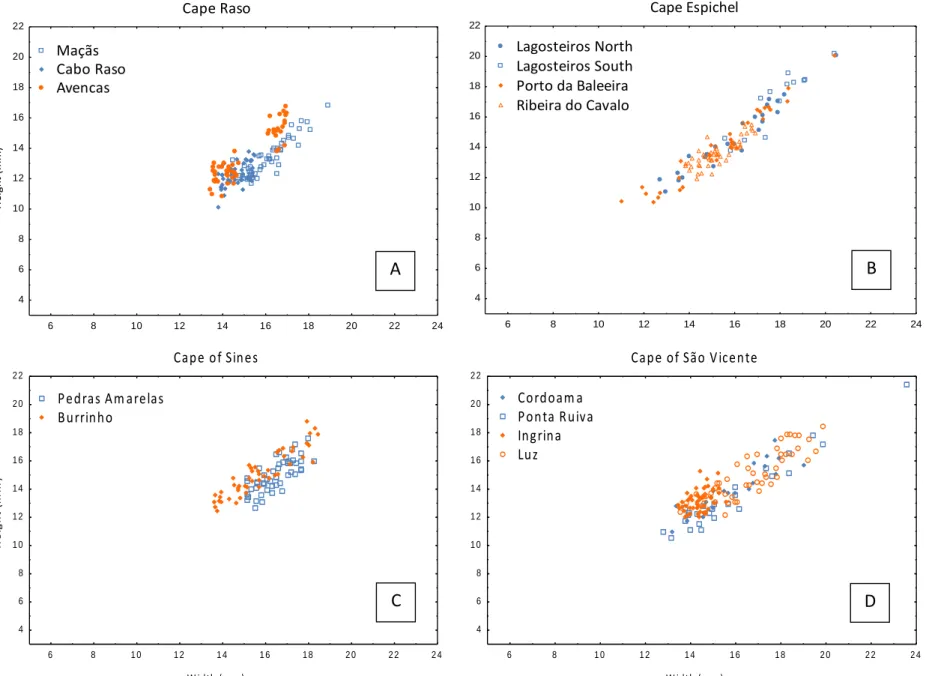
Effects of orientation in each Cape
The position in a cape and, consequently, the degree of exposure to the wave action may have an influence in the shell shape and width/height of P. lineatus and P. sauciatus. To infer this, RW scores were analysed, comparing locations on the north and south side of each cape (see Table III for P. lineatus and Table IV for P. sauciatus).
Table III. Selected P. lineatus populations Table IV. Selected P. sauciatus populations
Phorcus lineatus Cape Local N Position North (N) / South (S) Raso/Roca Maçãs 50 N Cabo Raso 50 N Avencas 50 S Espichel Lagosteiros North 24 N Lagosteiros South 13 N Porto da Baleeira 30 S Ribeira do Cavalo 50 S
Sines Pedras Amarelas 50 N
Burrinho 50 S São Vicente Cordoama 19 N Ponta Ruiva 27 N Ingrina 50 S Luz 50 S Phorcus sauciatus space Cape Local N Position North (N)/ South (S)
Roca/Raso Cabo Raso 41 N
Avencas 13 S Espichel Bicas 50 N Foz 50 N Lagosteiros South 50 N Porto da Baleeira 50 S Sines Pedras Amarelas 50 N Burrinho 50 S Queimado 50 S São Vicente Cordoama 50 N Ponta Ruiva 50 N Telheiro 50 N Ingrina 24 S Luz 50 S
21 Beside the North-South location, it was also taken in account the number of specimens and the presence of both species on the capes (whenever the latter was not possible, it was selected the population from the closest location). The Cape Carvoeiro was disregarded in this analysis not only because P. sauciatus was absent, but also because all three P. lineatus populations were from the north side of the cape.
Short scale - two sides in the same beach location
In this analysis it was intended to know if the position in two different sides of the same location influences the shell shape and width/height of P. lineatus and P. sauciatus. The locations were selected taking into account that they, if possible, should include specimens collected in two sides which exhibit different exposure degree, and that the specimens’ number should be 50 each. For P. lineatus the selected populations were Portinho da Areia Norte East and Portinho da Areia Norte West, Lagosteiros North and Lagosteiros South, and Vale dos Homens North and Vale dos Homens South. Regarding P. sauciatus only one location was selected, Vale dos Homens North and Vale dos Homens South.
3.2. Ontogenetic Morphometric Study
To analyse shape variation and width/height variation through the ontogeny of P. lineatus and P. sauciatus, an ANCOVA and a MANOVA were performed on the four width classes of both species.
23
RESULTS
1. Abundance
Regarding the entire Portuguese coast, P. sauciatus has a relative abundance of 67.29%, and P. lineatus only 32.71%. As expected, due to the species’ distribution (Crothers, 2001; Kendall, 1987; Pedro, 2004; Donald et al., 2012; Mieszkowska, 2005; Rubal et al., 2014), there is a clear dominance of P. lineatus in the northern coast and a dominance of P. sauciatus in the southern coast (Fig. 5). However, in Ingrina, and contrary to what was expected, P. lineatus was much more abundant than the southern species (P. lineatus with an relative abundance of 93.53% and P. sauciatus with 6.47%).
2. Morphometry - Traditional Approach
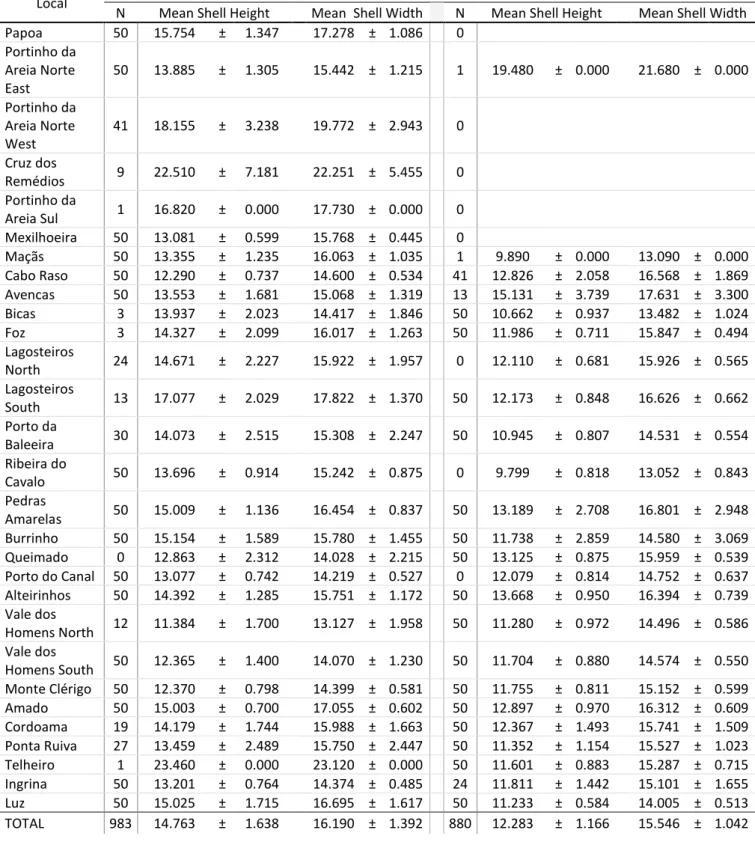
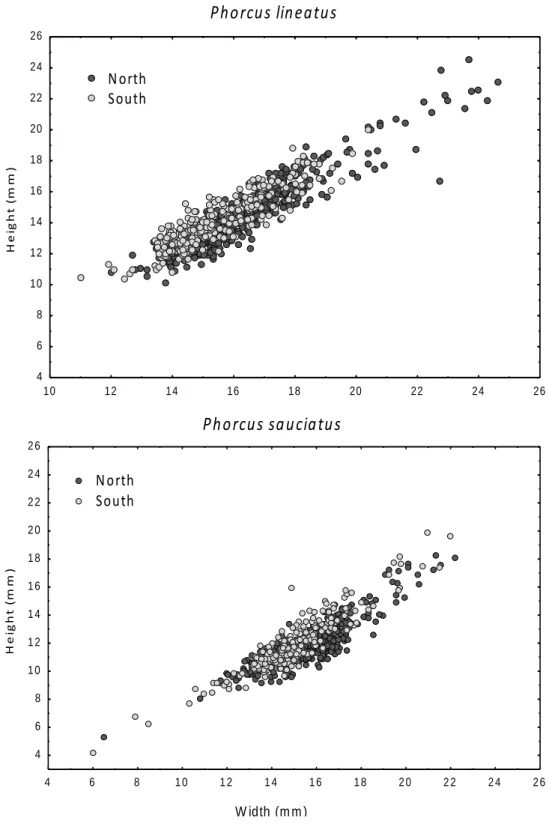
Accounting all sampling sites, and excluding the specimens used in the morphometric ontogenetic study, P. lineatus’ mean shell height was 14.763 mm (± 1.638 mm, Standard Deviation - SD), and mean shell width was 16.189 mm (± 1.392 mm). As for P. sauciatus, the mean shell height was 12.283 mm (± 1.166 mm), and the mean shell width was 15.546 mm (± 1.041 mm) (see Table V).
Both species present broad shells, with mean width larger than mean height (Table V). However in P. sauciatus this difference was much more clear than in P. lineatus: the mean difference between shell width and shell height was 1.437 mm ± 0.246 mm in the latter, and 3.263 mm ± 0.125 mm in P. sauciatus, which translates to a ratio of 1 mm height : 1.097 mm width and 1 mm height : 1.266 mm width, respectively. In P. lineatus, the maximum shell height and width was found in one specimen from Cruz dos Remédios, with 34.49 mm high and 30.59 mm broad. The smallest one was sampled in Avencas, with 1.93 mm high and 2.27 mm broad. Regarding P. sauciatus, the smallest specimen was found in Ponta Ruiva, with 5.05 mm high and 7.75 mm broad. The largest shell width (22.26 mm broad and 18.29 mm high) was found in Pedras Amarelas, and the largest height (19.92 mm high and 21.98 mm broad) was from Avencas.
24
Fig. 5. Species relative abundance (%) along the Portuguese coast sampled: 1 - Papoa; 2- Portinho da Areia Norte East; 3 - Portinho da Areia Norte West; 4 - Cruz dos Remédios; 5 - Portinho da Areia Sul; 6 - Mexilhoeira; 7 - Maçãs; 8 - Cabo Raso; 9 - Avencas; 10 - Bicas; 11 - Foz; 12 - Lagosteiros North; 13 - Lagosteiros South; 14 - Porto da Baleeira; 15 - Ribeira do Cavalo; 16 - Pedras Amarelas; 17 - Burrinho; 18 - Queimado; 19 - Porto do Canal; 20 - Alteirinhos; 21 - Vale dos Homens North; 22 - Vale dos Homens South; 23 - Monte Clérigo; 24 - Amado; 25 - Cordoama; 26 - Ponta Ruiva; 27 - Telheiro; 28 - Ingrina; 29 - Luz. P. lineatus is represented in dark grey, and P. sauciatus in light grey.
25
Table V. P. lineatus and P. sauciatus mean shell height and width (±SD).
Local Phorcus lineatus Phorcus sauciatus
N Mean Shell Height Mean Shell Width N Mean Shell Height Mean Shell Width
Papoa 50 15.754 ± 1.347 17.278 ± 1.086 0 Portinho da Areia Norte East 50 13.885 ± 1.305 15.442 ± 1.215 1 19.480 ± 0.000 21.680 ± 0.000 Portinho da Areia Norte West 41 18.155 ± 3.238 19.772 ± 2.943 0 Cruz dos Remédios 9 22.510 ± 7.181 22.251 ± 5.455 0 Portinho da Areia Sul 1 16.820 ± 0.000 17.730 ± 0.000 0 Mexilhoeira 50 13.081 ± 0.599 15.768 ± 0.445 0 Maçãs 50 13.355 ± 1.235 16.063 ± 1.035 1 9.890 ± 0.000 13.090 ± 0.000 Cabo Raso 50 12.290 ± 0.737 14.600 ± 0.534 41 12.826 ± 2.058 16.568 ± 1.869 Avencas 50 13.553 ± 1.681 15.068 ± 1.319 13 15.131 ± 3.739 17.631 ± 3.300 Bicas 3 13.937 ± 2.023 14.417 ± 1.846 50 10.662 ± 0.937 13.482 ± 1.024 Foz 3 14.327 ± 2.099 16.017 ± 1.263 50 11.986 ± 0.711 15.847 ± 0.494 Lagosteiros North 24 14.671 ± 2.227 15.922 ± 1.957 0 12.110 ± 0.681 15.926 ± 0.565 Lagosteiros South 13 17.077 ± 2.029 17.822 ± 1.370 50 12.173 ± 0.848 16.626 ± 0.662 Porto da Baleeira 30 14.073 ± 2.515 15.308 ± 2.247 50 10.945 ± 0.807 14.531 ± 0.554 Ribeira do Cavalo 50 13.696 ± 0.914 15.242 ± 0.875 0 9.799 ± 0.818 13.052 ± 0.843 Pedras Amarelas 50 15.009 ± 1.136 16.454 ± 0.837 50 13.189 ± 2.708 16.801 ± 2.948 Burrinho 50 15.154 ± 1.589 15.780 ± 1.455 50 11.738 ± 2.859 14.580 ± 3.069 Queimado 0 12.863 ± 2.312 14.028 ± 2.215 50 13.125 ± 0.875 15.959 ± 0.539 Porto do Canal 50 13.077 ± 0.742 14.219 ± 0.527 0 12.079 ± 0.814 14.752 ± 0.637 Alteirinhos 50 14.392 ± 1.285 15.751 ± 1.172 50 13.668 ± 0.950 16.394 ± 0.739 Vale dos Homens North 12 11.384 ± 1.700 13.127 ± 1.958 50 11.280 ± 0.972 14.496 ± 0.586 Vale dos Homens South 50 12.365 ± 1.400 14.070 ± 1.230 50 11.704 ± 0.880 14.574 ± 0.550 Monte Clérigo 50 12.370 ± 0.798 14.399 ± 0.581 50 11.755 ± 0.811 15.152 ± 0.599 Amado 50 15.003 ± 0.700 17.055 ± 0.602 50 12.897 ± 0.970 16.312 ± 0.609 Cordoama 19 14.179 ± 1.744 15.988 ± 1.663 50 12.367 ± 1.493 15.741 ± 1.509 Ponta Ruiva 27 13.459 ± 2.489 15.750 ± 2.447 50 11.352 ± 1.154 15.527 ± 1.023 Telheiro 1 23.460 ± 0.000 23.120 ± 0.000 50 11.601 ± 0.883 15.287 ± 0.715 Ingrina 50 13.201 ± 0.764 14.374 ± 0.485 24 11.811 ± 1.442 15.101 ± 1.655 Luz 50 15.025 ± 1.715 16.695 ± 1.617 50 11.233 ± 0.584 14.005 ± 0.513 TOTAL 983 14.763 ± 1.638 16.190 ± 1.392 880 12.283 ± 1.166 15.546 ± 1.042
It is important to refer that, when there were enough individuals in the sample for the geographic morphometric study, only the specimens with approximately the same size were chosen, i.e. between 13 mm and 17 mm (width) in order to facilitate comparisons. This means that regardless the presence of larger or smaller individuals in the sample, they were not
26
considered in this study. On the other hand, when there were less than 50 individuals, they were all considered, independently of their size, thus creating a greater SD in the measurements performed. This was necessary to maintain an adequate number of specimens from each location to allow robust statistics.
2.1. Geographic Morphometric Study
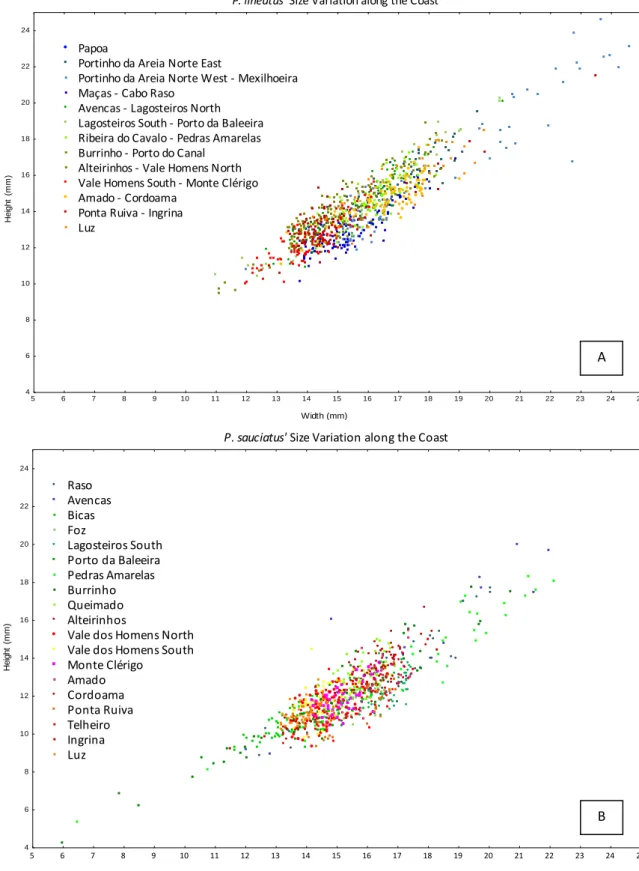
Size Variation along the CoastP. lineatus results from the ANCOVA (
Fig. 6A) indicated that there were significant differences of width/height variation between populations along the coast (F = 176.851; p < 0.0001). The northern populations (from Papoa to Cabo Raso, represented in blue) have bigger width and height, and the central ones (represented in tones of green) have a smaller size. Southern populations (from Vale dos Homens North to Luz, represented in warm colours, i.e. orange and red tones) are grouped in a lower range of width/height, contrary to populations from the central and northern region, where there is a higher variability. In P. sauciatus, the ANCOVA (
Fig. 6B) also indicated that there were significant differences of width/height variation between populations along the coast (F = 193.001; p < 0.0001). However, there is not a clear pattern.
27 Width (mm) H e ig h t (m m ) 5 6 7 8 9 10 11 12 13 14 15 16 17 18 19 20 21 22 23 24 25
P. lineatus' Size Variation along the Coast
4 6 8 10 12 14 16 18 20 22 24 Papoa
Portinho da Areia Norte East
Portinho da Areia Norte West - Mexilhoeira Maças - Cabo Raso
Avencas - Lagosteiros North Lagosteiros South - Porto da Baleeira Ribeira do Cavalo - Pedras Amarelas Burrinho - Porto do Canal
Alteirinhos - Vale Homens North Vale Homens South - Monte Clérigo Amado - Cordoama
Ponta Ruiva - Ingrina Luz Width (mm) H e ig h t (m m ) 5 6 7 8 9 10 11 12 13 14 15 16 17 18 19 20 21 22 23 24 25
P. sauciatus' Size Variation along the Coast
4 6 8 10 12 14 16 18 20 22 24 Raso Avencas Bicas Foz Lagosteiros South Porto da Baleeira Pedras Amarelas Burrinho Queimado Alteirinhos
Vale dos Homens North Vale dos Homens South Monte Clérigo Amado Cordoama Ponta Ruiva Telheiro Ingrina Luz
Fig. 6. Variation of shell width and shell height of P. lineatus (A) and P. sauciatus (B) along the coast, in all populations except the ones with less than ten individuals.
A
28 Wave Exposure
Integrated effects of shore orientation
Phorcus lineatus
H e ig h t (m m ) 10 12 14 16 18 20 22 24 26 4 6 8 10 12 14 16 18 20 22 24 26 N orth SouthPhorcus sauciatus
W idth (m m ) H e ig h t (m m ) 4 6 8 1 0 1 2 1 4 1 6 1 8 2 0 2 2 2 4 2 6 4 6 8 1 0 1 2 1 4 1 6 1 8 2 0 2 2 2 4 2 6 N orth SouthFig. 7. Relation of shell height (mm) with shell width (mm) of P. lineatus (A) and P. sauciatus (B) specimens, considering all specimens for the north of capes, and all specimens of the south of capes.