Effects of Vineyard Deficit Irrigation on Berry Composition and
Yield during 2014 California Drought
Dylan LUNDSTROM
Dissertation to obtain the degree of
European Master of Science in Viticulture and Enology
Advisor :
Carlos Lopes, Universidade de Lisboa
Assistant : Thibaut Scholasch, Fruition Sciences
Jury:
President - Jorge Manuel Rodrigues Ricardo da Silva (Phd), Full Professor, at Instituto Superior de Agronomia, Universidade de Lisboa.
Members - Pilar Baeza (Phd), Professor at Universidade Politécnica de Madrid;
Carlos Manuel Antunes Lopes (Phd), Associate Professor with habilitation, at Instituto Superior de Agronomia, Universidade de Lisboa;
José Manuel Couto Silvestre (Phd), Assistant Researcher at Instituto Nacional de Investigação Agrária, I. P. – Dois Portos
cts
o
f
V
ine
y
a
rd De
fici
t
Irr
iga
tio
n
o
n
B
e
rr
y Co
m
p
o
sition
a
n
d
Y
ield
d
u
ri
n
g
2
0
1
4
Ca
lifo
rni
a
Dr
o
u
g
h
t
Dyl
a
n LUN
DSTROM
Declaration
I, the undersigned, Dylan LUNDSTROM, hereby declare that the work contained in this thesis is my own original work and that I have not previously submitted it at any other University for a
degree.
_____________________________ Dylan Lundstrom
Abstract
The effect of deficit irrigation on berry composition, berry weight and yield was studied across 5 vineyards located in two regions exhibiting Mediterranean climate in California. The study used sap flow and pre-dawn leaf water potential (PDWP) to monitor the water status of the vines and trigger irrigation opportunities. Vineyard blocks were “split” and two irrigation regimens were imposed: traditional and experimental. Traditional treatment for each vineyard continued conventional methodologies used by growers at each site. Experimental sites used sap flow as the primary indication of irrigation timing while PDWP was used to confirm sap flow data. Fruit composition was monitored starting at veraison through to harvest, monitoring primary
metabolites at all sites and secondary metabolites at participating sites. Variables monitored included: water applied, berry weight, tannin, total anthocyanins, yield, water deficit index, sugar concentration, pH and titratable acidity. Data from all sites was combined and correlations between all variables were determined. A regression analysis was also used to analyze the effects of the amount of water applied and water deficit index on yield components and berry composition. Simple data analysis shows the differences between water input in the traditional and experimental sites (30 – 100% water savings). Study outcomes were largely inconclusive and despite the strong correlations obtained between variables, they were often inconsistent with literature. Berry weight was found to have a moderately negative correlation with the amount of water applied and water deficit index. Tannin content was also found to have a negative relationship with the amount of water applied. Brix was found to be positively
correlated with water applied and water deficit index. These inconsistent results may be due to factors such as different varieties, sites and management techniques being used across different producers. The absence of statistically robust results prevent us from drawing conclusions. Additional research is suggested to confirm this results in order to evaluate the viability of using the sap flow technique to manage deficit irrigation.
Resumo
Estudou-se o efeito da rega deficitária na composição da uva, no peso do bago e no rendimento em 5 vinhedos localizados em duas regiões de clima mediterrâneo, na Califórnia. O estudo utilizou o fluxo de seiva e o potencial hídrico foliar de base (PDWP) para estimar o o estado hídrico da videira e gerir a rega deficitária. Os talhões de vinha foram divididos em duas partes onde se impôs dois regimes de rega: tradicional e experimental. O tratamento tradicional seguiu as metodologias convencionais utilizadas pelos produtores em cada local. Nos tratamentos experimentais foi utilizado o fluxo da seiva para indicação da dotação de rega, enquanto o PDWP foi usado para confirmar os dados do fluxo da seiva. A composição da uva foi avaliada ao longo do período de maturação, tendo-se monitorizado os metabolitos primários em todos os locais e os metabolitos secundários em alguns dos locais. As variáveis medidas foram: dotação de rega, índice de déficit hídrico, peso do bago, rendimento, concentração de açúcar, pH, acidez total, taninos e antocianinas totais. Os dados de todos os talhões foram combinados e as correlações entre todas as variáveis foram determinadas. Uma análise de regressão também foi utilizada para analisar os efeitos da quantidade de água aplicada e do índice de déficit hídrico nos componentes de produção e na composição do bago. Análise de dados mostra diferenças entre tratamentos na quantidade de água aplicada (30 - 100% de economia de água nas talhões experimentais). Os resultados do estudo foram em grande parte inconclusivos e, apesar das fortes correlações obtidas entre variáveis, muitas vezes eram inconsistentes com a literatura. Verificou-se que o peso do bago apresentou uma correlação negativa com a quantidade de água aplicada e com o índice de déficit hídrico. O teor em taninos apresentou uma relação negativa a quantidade de água aplicada. O grau Brix apresentou uma correlação positiva com a quantidade de água aplicada e com índice de déficit hídrico. Os resultados não esperados deste estudo podem ser devidos a vários fatores tais como as diferentes castas, locais e técnicas de gestão da rega utilizadas pelos diferentes produtores. A inconsistência dos resultados impede-nos de tirar conclusões sugerindo-se a realização de estudos adicionais para confirmar os resultados obtidos relativamente à viabilidade da técnica de fluxo da seiva para gestão da rega deficitária na vinha.
Palavras - chave: Deficit de irrigação, deficit hídrico, peso da baga, fluxo da seiva, potencial da água
Extended Abstract
Irrigation is widely used throughout California’s winegrowing regions and has become increasingly important to meet vine water needs during California’s on-going drought. Low rainfall conditions, coupled with high agricultural water demands, have led to the depletion underground aquifers and insufficient reserves in reservoirs. Deficit irrigation has emerged as a water-saving, irrigation management tool that allow a beneficial water deficit to be applied in a vineyard. This irrigation strategy has shown the ability to improve fruit quality and maintain yield through improvement of vine water use efficiency. Application of water deficit requires adherence to thresholds in order to benefit vine behavior and improve fruit quality. Alternatively, unmonitored irrigation practices often lead to over- irrigation and occasional under-irrigation, which have negative effects on fruit quality and vine health. In order to apply an effective water deficit, it is necessary to monitor the water status experienced by grapevines and tools to monitor vine water status are becoming more common. This study uses sap flow methodology, which has become of interest in commercial viticulture operations which was corroborated by the use of pre-dawn leaf water potential (PDWP). Installment of sap flow sensors in a given vineyard allows a vineyard management team to receive continuous data delivery that reports live vine water status data. This information is instantaneously delivered to the client through a client web interface and allows determination of irrigation opportunity.
The study was carried out by Fruition Sciences (Oakland, California, USA), and used sap flow technology provided by Dynamax (Dynamax Inc. Houston, Texas, USA). The study focused on five vineyards, three located in Napa Valley and two in Paso Robles. Vineyard blocks were “split” and two irrigation regimens were imposed: traditional and experimental. Traditional treatment for each vineyard continued conventional methodologies used by growers at each site. Experimental sites used sap flow as the primary indication of irrigation timing while PDWP was used to confirm sap flow data. Fruit composition was monitored starting at veraison through to harvest, monitoring primary metabolites at all sites and secondary metabolites at participating sites. Variables monitored included: water applied, berry weight, tannin, total anthocyanins, yield, water deficit index, sugar concentration, pH and titratable acidity. Yield comparisons between the experimental and traditional study site were made at harvest. Data from all sites was combined and correlations between all variables were determined. A regression analysis was used to analyze the effects of water applied and water deficit index on yield components and berry composition.
Simple data analysis shows the differences between water input in the traditional and experimental sites with between 30 – 100% water savings. Single site analysis presented in Chapter 4, shows that on a individual site approach, yield and berry weight were mostly unaffected, while polyphenols were often increased. Despite this approach offering a clearer explanation for each site, the single data set does not allow a robust statistical evaluation of the data. Therefore, study outcomes are largely inconclusive and despite strong correlations
an effect on berry composition and yield components. Due to the extenuating limitations of our 2014 study, further study is required to explore annual and site specific variabilities. In order to improve statistical strength, further study should include repetitions and control for extraneous variables.
Resumo Alargado
A rega é amplamente utilizada em todas as regiões vitivinícolas da Califórnia e tornou-se cada vez mais importante para suprir as necessidades de água da videira durante a seca em curso na Califórnia. A reduzida precipitação, aliada às elevadas necessidades de água para a agricultura, levaram à deplecção do nível de água dos aquíferos subterrâneos e a baixas reservas nas charcas e outros reservatórios. A rega deficitária surgiu como uma ferramenta para gestão eficiente da rega, permitindo economizar água através da aplicação de um déficite hídrico moderado que é benéfico para a videira. Esta estratégia de rega permite melhorar a qualidade da uva e manter o rendimento através da melhoria da eficiência do uso da água pela videira.
A aplicação de um déficite hídrico moderado requer o conhecimento dos valores limiares, a fim de beneficiar o comportamento da videira e melhorar a qualidade da uva. A prática de rega sem monitorização geralmente leva a uma rega excessiva e/ou deficiente, que tem efeitos negativos sobre a qualidade da uva e saúde da videira. Para aplicar um déficite de água efetivo é necessário monitorizar o estado hídrico das videiras, sendo cada vez mais comum utilizar ferramentas para esse efeito. Este estudo utiliza o método do fluxo de seiva, método que tem despertado grande interesse em viticultura. Este método foi validado através do uso do potencial hídrico foliar de base (PDWP). A instalação de sensores de fluxo de seiva numa determinada vinha permite que a equipa de gestão da vinha receba em tempo real e de forma continua, dados do estado hídrico das plantas. Esta informação é enviada instantaneamente ao cliente através de uma interface web, permitindo a determinação da oportunidade de rega. O estudo foi realizado pela empresa “Fruition Sciences (Oakland, Califórnia, EUA)” e utilizou tecnologia de fluxo de seiva fornecida pela Dynamax (Dynamax Inc. Houston, Texas, EUA). O estudo centrou-se em cinco vinhedos, três localizados em Napa Valley e dois em Paso Robles. As parcelas de vinha foram divididas em dois talhões onde se aplicaram dois regimes de rega: tradicional e experimental. Em cada uma das vinhas o tratamento tradicional baseou-se nas metodologias convencionais utilizadas pelos produtores em cada local. Nos talhões do tratamento experimental foi utilizado o método do fluxo da seiva para indicação da dotação de rega. Por sua vez o PDWP foi usado para validar os dados do fluxo da seiva. A composição da uva foi avaliada periodicamente do pintor à vindima, tendo-se analisado os metabolitos primários em todos os locais e os metabolitos secundários em alguns dos locais. As variáveis monitorizadas foram: quantidade de água aplicada, peso do bago, teor em taninos e antocianinas totais, rendimento, índice de déficit hídrico, concentração de açúcar, pH e acidez total. A comparação do rendimento entre os talhões experimentais e tradicionais foi feita à vindima. Os dados de todos os talhões foram combinados e as correlações entre todas as variáveis foram determinadas. Fez-se uma análise de regressão para estudar o efeito da quantidade de água aplicada e do índice de déficit hídrico (variáveis independentes) nas variáveis peso do bago, rendimento e características da uva.
A análise de dados por parcela mostrou diferenças entre os dois tratamentos na quantidade de água aplicada, tendo-se obtido uma poupança de água entre 30 e 100%. A análise individual de cada local, apresentada no Capítulo 4, mostra que, por cada local, o rendimento e o peso do bago não foram afetados, enquanto os polifenóis apresentaram alguns valores superiores. No entanto, dada a inexistência de repetições, os dados não permitem uma avaliação estatística robusta. Portanto, os resultados do estudo são
de vinhas com diferentes castas, solos e porta-enxertos, variáveis que são referidas na literatura como indutoras de variabilidade em termos de rendimento e composição da uva, poderá ter provocado grande variação nos resultados.
Atendendo às limitações referidas, este estudo deverá continuar por forma a obter conclusões mais robustas. A continuação destes estudos, mas com um melhor que controlo das variáveis externas, beneficiará a compreensão das potencialidades da utilização do fluxo de seiva na gestão da rega deficitária da vinha.
Table of Contents
1. Introduction ...12
2. Literature Review ...15
2.1 The concept of deficit irrigation ... 15
2.2 Application of deficit irrigation ... 16
2.3 Vine Response ... 18
2.4 Climate ... 19
2.5 Deficit irrigation, berry weight and yield ... 19
2.5.1 Deficit irrigation and berry composition ... 21
2.6 Concluding remarks ... 21
3. MATERIALS AND METHODS ...23
3.1 Site Location ... 23
3.2 Experimental Design ... 24
3.3 Characterization of water status ... 26
3.3.1 Sap flow ... 26
3.3.2 Pre-dawn leaf water potential ... 26
3.4 Sampling area ... 30
3.5 Environmental monitoring ... 30
3.5.1 Weather station location ... 30
3.6 Irrigation ... 30
3.7 Berry Sampling ... 32
3.7.1 Berry Weight and Yield ... 32
3.7.2 Sugar, pH and Acid ... 32
3.7.3 Phenolics ... 33
3.8 Data analysis ... 33
4. Results and Discussion ...34
4.1 Climatic Comparison ... 34
4.2 Introduction to data presentation ... 35
4.3 Site #1. PR - A ... 35
List of Tables
Table 1: Predawn leaf water potential thresholds according to Carbonneau (1998). ... 29
Table 2: 2014 climatic comparison between 5 study sites located in Paso Robles and Napa
Valley ... 35
Table 3: PR – A 2014 Syrah vineyard site rainfall and irrigation: Applications, duration and
volumes comparing the site’s traditional study block and experimental study block. ... 36
Table 4: PR-A 2014 Syrah yield and berry characteristics at harvest ... 38
Table 5: PR-HR 2014 Block 21 Cabernet Sauvignon vineyard site rainfall and irrigation:
Applications, duration and volumes comparing the site’s traditional study block and
experimental study block. ... 39
Table 6: PR-HR 2014 yield and berry characteristics at harvest in Cabernet Sauvignon block 21.
... 41
Table 7: NV - K 2014 Cabernet Sauvignon E2 vineyard block rainfall and irrigation: Applications,
duration and volumes comparing the site’s traditional study block and experimental study
block. ... 42
Table 8: 2014 NV - K Cabernet Sauvignon E2 block yield and berry characteristics at harvest ... 44
Table 9: NV-M 2014 Cabernet Sauvignon vineyard block “E” rainfall and irrigation: Applications,
duration and volumes comparing the site’s traditional study block and experimental study
block. ... 45
Table 10: NV-M 2014 Cabernet Sauvignon vineyard block “E” yield and berry characteristics at
harvest ... 47
Table 11: NV-JP 2014 Merlot vineyard site rainfall and irrigation: Applications, duration and
volumes comparing the site’s traditional study block and experimental study block. ... 48
Table 12: NV-JP 2014 Merlot yield and berry characteristics at harvest ... 50
Table 13: All Sites - Water Applied Correlations ... 51
Table 14: All sites - WDI Correlations... Erro! Marcador não definido.
Table 15: Experimental Sites – Water Applied Correlations ... 52
Table 16: Experimental Sites - WDI Correlations ... Erro! Marcador não definido.
Table 17: Traditional Site - Water Applied Correlations ... 53
Table 18: Traditional Sites - WDI Correlations ... Erro! Marcador não definido.
List of Figures
Figure 1: Average Annual Napa Valley Rainfall and Temperature Distribution (CIMIS) ... 13
Figure 2: Berry growth chart demonstrates sigmoidal curve (image: Keller, 2010) ... 20
Figure 3: Location of study sites in California. ... 23
Figure 4: Experimental Design as shown by Fruition Sciences web-interface. All sites were split,
with half of the vineyard referred to as “traditional” and the other “experimental” (exp). 25
Figure 5: The sap flow diagram as depicted by Fruition Sciences. Two sampled vines, circled in
red, are chosen as representatives for the vineyard area and were chosen according to
vineyard uniformity. Data was fed to the data logger and broadcast for real-time data
retrieval by Fruition Sciences and the customer. ... 27
Figure 6: Equipped Sap Flow Vine: Vine trunk and cordon are covered to remove any external
heat source. ... 28
Figure 7: Sensor and stem section: Heat application is applied through the heating strip
(yellow), wraps the vine cordon and measures the rate of sap flow. ... 28
Figure 8: Depiction of Fruition Sciences "Smartpoint" encompasses 50 – 80 vines and serves as a
stratified sampling area throughout the duration of the growing season. ... 29
Figure 9: Decagon irrigation loggers were installed at each site. ... 31
Figure 10: Irrigation calibration was completed to determine uniformity of dripper emission and
accuracy of Decagon Devices irrigation loggers. ... 31
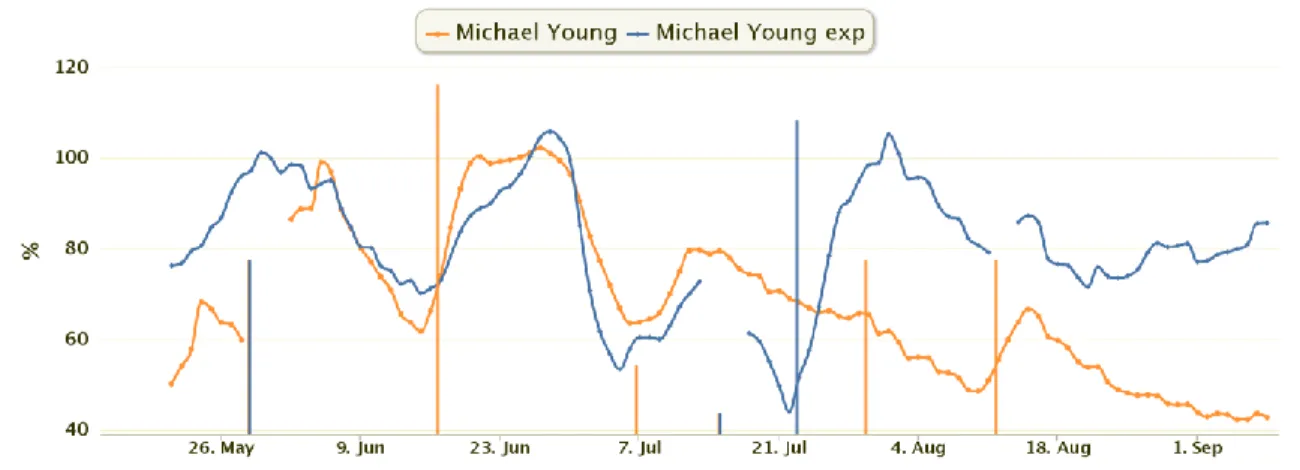
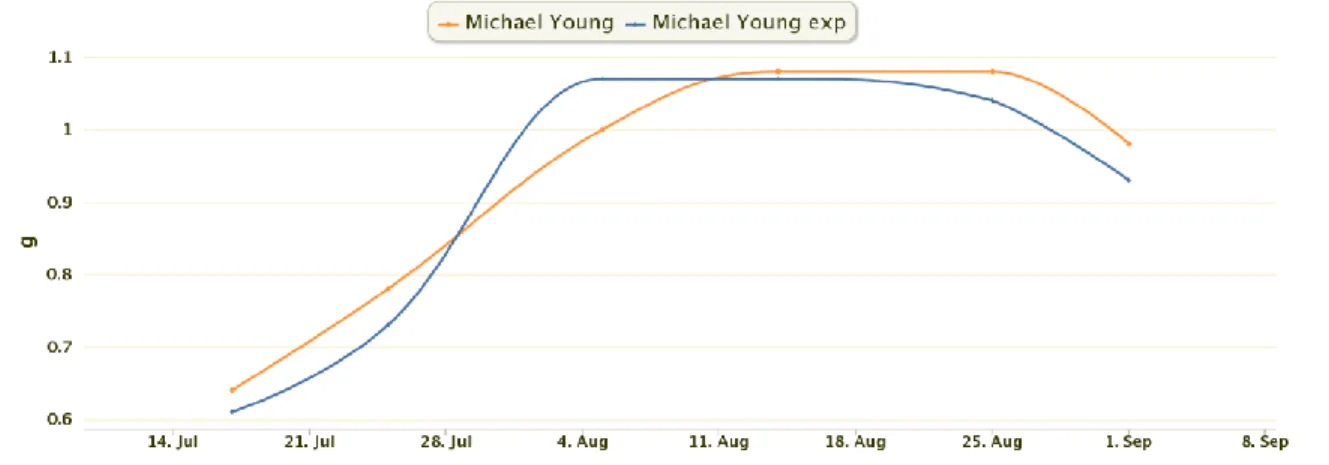
Figure 11: Seasonal trend of predawn leaf water potential (PDWP) measured at site PR-A in the
Syrah Michael Young block. Michael Young (traditional) in yellow and Michael Young exp
(experimental) in blue. Y-axis coincides with mega Pascale pressure unit, commonly used
with PDWP. ... 37
Figure 12: Seasonal trend of water deficit index (WDI) measured at site PR-A Syrah Michael
Young block. The WDI 2014 seasonal data is displayed for Michael Young (traditional) in
yellow and Michael Young exp (experimental) in blue. Bars that coincide with the irrigation
volume and timing display irrigation events related to either Traditional (yellow) or
Experimental (blue). Y-axis coincides with the WDI ranging between 40-100%. ... 37
Figure 13: Effect of 2014 irrigation strategy on Syrah berry weight for PR-A site. Michael Young
(traditional) in yellow and Michael Young exp (experimental) in blue. Berry samples were
taken 6 times. Y-axis displays grams (g) as the unit for average berry weight. ... 38
Figure 14: Seasonal trend of predawn leaf water potential (PDWP) measured at site PR-HR in
Cabernet Sauvignon block 21. The PDWP 2014 seasonal data is displayed for 21
(traditional) in red and 21 exp (experimental) in green. Bars that coincide with the
irrigation volume (mm) and timing display irrigation events related to either traditional
(red) or experimental (green). Y-axis coincides with mega Pascale pressure unit for PDWP.
... 40
Figure 15: Seasonal trend of water deficit index (WDI) measured at site PR-HR in Cabernet
Sauvignon block 21. The WDI 2014 seasonal data is displayed for Block 21; 21 (traditional)
in red and 21exp (experimental) in green. Bars that coincide with the irrigation volume (in
mm) and timing display irrigation events related to either traditional (red) or experimental
(green). Y-axis coincides with the WDI ranging between 40-140%. ... 40
Figure 16: Effect of 2014 irrigation strategy on Cabernet Sauvignon berry weight for PR-HR site
21 (traditional) in red and 21 exp (experimental) in green. Berry samples were taken 12
times. Y-axis displays grams (g) as the unit for average berry weight. ... 41
Figure 17: Seasonal trend of predawn leaf water potential (PDWP) measured at site NV-K
Cabernet Sauvignon E2 block. The PDWP 2014 seasonal data is displayed for E2
(traditional) in yellow and E2exp (experimental) in blue. Bars that coincide with the
irrigation volume and timing display irrigation events related to either traditional (yellow)
or experimental (blue). Y-axis coincides with predawn leaf water potential (mega Pascale
pressure unit). ... 43
Figure 18: Seasonal trend of water deficit index (WDI) measured at site NV-K Cabernet
Sauvignon E2 block. The WDI 2014 seasonal data is displayed for E2; E2 (traditional) in
yellow and E2exp (experimental) in blue. Bars that coincide with the irrigation volume and
timing display irrigation events related to either Traditional (yellow) or Experimental
(blue). Y-axis coincides with the WDI ranging between 40-100%. ... 43
Figure 19: Effect of 2014 irrigation strategy on Cabernet Sauvignon berry weight for NV-K site
E2 (traditional) in yellow and E2 exp (experimental) in blue. Berry samples were taken 8
times. Y-axis displays grams (g) as the unit for average berry weight. ... 44
Figure 20: Seasonal trend of predawn leaf water potential (PDWP) measured at site NV-M
Cabernet Sauvignon vineyard block “E”. The PDWP 2014 seasonal data is displayed for E
West (traditional) in yellow and E East exp (experimental) in green. Bars that coincide with
the irrigation volume and timing display irrigation events related to either traditional
(yellow) or experimental (green). Y-axis coincides with mega Pascale pressure unit. ... 46
Figure 21: Seasonal trend of water deficit index (WDI) measured at site NV-M Cabernet
Sauvignon vineyard block “E”. The WDI 2014 seasonal data is displayed for Block 21; 21
(traditional) in red and 21exp (experimental) in green. Bars that coincide with the irrigation
volume and timing display irrigation events related to either Traditional (red) or
Experimental (green). Y-axis coincides with the WDI ranging between 40-140%. ... 46
Figure 22: Effect of 2014 irrigation strategy on berry weight for NV-M Cabernet Sauvignon
vineyard block “E”; site E West (traditional) in yellow and E East exp (experimental) in
green. Berry samples were taken 7 times. Y-axis displays grams (g) as the unit for average
berry weight. ... 47
Figure 23: Seasonal trend of predawn water deficit index (WDI) measured at the Merlot
vineyard site at NV-JP. The WDI 2014 seasonal data is displayed for block 49020
(traditional) in yellow and 49021 exp (experimental) in blue. Bars that coincide with the
irrigation volume and timing display irrigation events reported and relate to either
List of abbreviations
ABA abscisic acid DI deficit irrigation ET evapotranspiration ETc crop evapotranspiration ET0 reference evapotranspiration Kc crop coefficient kPa kilopascal MPa megapascal NV Napa Valley
PDWP pre-dawn leaf water potential
PR Paso Robles
UV ultra-violet
VPD vapor pressure deficit WDI water deficit index
1. Introduction
California is currently experiencing a severe drought and has been declared in a State of Emergency throughout the entire year of 2014 and to date in 2015. Demand for water continues to rise, accompanied by below average rainfall that has resulted in the depletion of reserves – specifically groundwater. Groundwater legislation in California is of recent importance as the State of California passed legislation to monitor and tax groundwater usage (Office, 2014). Vineyards rely on groundwater basins for irrigation water. The USDA National Agricultural Statistics Service estimates a total of 878,000 acres of grapes in California; 525,000 of these acres are attributed to wine grapes (USDA NASS, 2014) of which roughly 70% of vineyards are irrigated.
Increased concern regarding water resources and conservation efforts has significantly pressured California to act quickly. Economical implications with environmental foresight may begin to encourage California agriculture to use water more wisely.
Data published by the National Drought Mitigation center reports 100% of California is currently affected by the drought. In perspective, Washington State, which has substantially higher rainfall than California, first experienced drought conditions in 2014 – showing a spreading effect of climatic conditions. This trend is shown internationally as well and the importance of maximizing irrigation water use is of increasing importance (Chaves et al. 2007; Schultz, 2000).
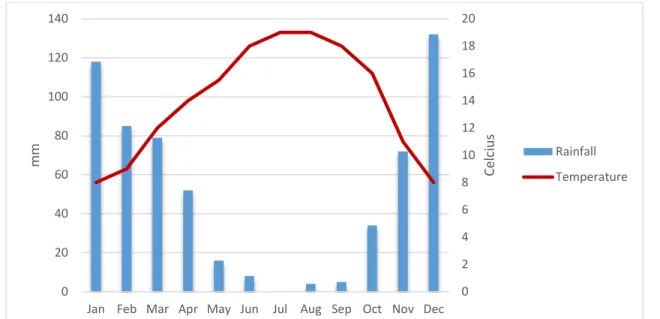
California wine growing regions exhibit a Mediterranean climate; Napa Valley’s climate is used as an example shown in Figure 1, similar to many of the premium wine production regions of the world (Chaves et al. 2007; Edwards & Clingeleffer, 2013; Ferreira et al. 2012). These vineyards often require irrigation to maintain adequate soil moisture through dry summer months. Soil water status has a direct influence on vine physiological and molecular stress, effecting vegetative and reproductive growth (Chaves et al. 2010; Edwards & Clingeleffer, 2013; Keller, 2010).
Figure 1: Average Annual Napa Valley Rainfall and Temperature Distribution (CIMIS)
Viticulture exists within the soil-plant-atmosphere continuum (SPAC), which allows water to move through water potential gradients from the soil through the plant to the atmosphere. Soil is an influential variable on: soil water holding capacity, depth, course elements, organic matter etc. Soil water status fluctuates seasonally and annually in all growing regions and is a major influence on vineyard growing conditions (within California is often aided by the use of irrigation). Atmospheric conditions make up the climate and exert varying daily demands on living organisms and have major influence on vine behavior (Schultz, 2003; Keller, 2010). The accumulation of these variables and human intervention, make up terroir as explained by van Leeuwen (2013) and can have major implications on wine bottle pricing (van Leeuwen, 2009), the economical drive behind the international wine industry.
With the growing concern regarding water resources in California and many other viticulture regions of the world, and with consideration to the influence of water availability on wine price, it seems that the adoption of deficit irrigation in viticulture is inevitable. Awareness and adoption of such measures will continue to grow economic incentives and push growers to be more thorough in irrigation management.
This study sought to investigate water savings realized through irrigation management tools. The Southern California Municipal Water District contracted Fruition Sciences (California office: Oakland, CA, USA) to study sap flow application in agriculture, specifically viticulture. Fruition Sciences employs the use of sap flow technology to monitor water status in the growing number of California vineyards. The method is non-destructive and continuous which reduces labor required to monitor the critical, dynamic vineyard water status and gives growers an exact time
0 2 4 6 8 10 12 14 16 18 20 0 20 40 60 80 100 120 140
Jan Feb Mar Apr May Jun Jul Aug Sep Oct Nov Dec
Ce lci u s mm Rainfall Temperature
and response for irrigation events. The goal of the study was to conserve water by improving irrigation timing and applied volumes in order to reduce vineyard water demands due to the on-going drought conditions in California. Stipulations of water application included meeting vine water requirements, maintaining or improving fruit qualitative parameters and yield production expected by producers. The study sought to prove the water savings capable at various vineyards, while maintaining vine health, fruit quality and yield.
2. Literature Review
2.1 The concept of deficit irrigation
Deficit irrigation has been found to control vigor, improve water use efficiency, encourage sugar accumulation and improve polyphenol composition (Chaves et al. 2013; Edwards & Clingeleffer, 2013). Oliveira et al. (2013) acknowledges the lack of understanding of imposed water deficits on berry composition and vine physiology; however literature continues to support the hypothesis that deficit irrigation benefits vine management of microclimate, vigor, berry composition and yield maintenance (Ojeda et al. 2002; Edwards & Clingeleffer, 2013).
With the idea in mind that many, if not all tools and improvements in vineyard water efficiency are targeting existing vineyards – vineyard soils and water holding capacity are relatively fixed and constant. In addition, plant material has been chosen and any additional improvements will have to be made through management techniques. Vineyard management techniques influence the quality of a vineyards harvest and serve as a reason for the wine industry to continue improving management techniques.
One such interest is improving vine water use efficiency. Water use efficiency (WUE) is the amount of grapes produced per unit of water input (Prichard et al., 2005; Davies, Wilkinson & Loveys, 2002). WUE can be improved by the timing and duration of irrigation applications, known as deficit irrigation (Prichard et al., 2005; Edwards & Clingeleffer, 2013; Chaves et al. 2007). Delaying or cancelling an entire irrigation can save thousands of gallons per season per vineyard.
Decreased vine vigor imposed by water deficit increases light penetration into the canopy, light exposure on grape berry clusters is considered important for quality berry production (Teixeira et al. 2013). Deficit irrigation was also found to beneficially control lateral growth as demonstrated by Oliveira (2013) – concluding that improving sunlight penetration into the canopy contributed to improved vine microclimate, subsequently decreasing disease pressure. Light interception by clusters and water deficit benefits are difficult to separate and it is accepted that both sun exposure and water deficit improve berry quality. The benefit of berry exposure to sunlight is due to the berries synthesis of phenolics, photo-protectants, that are beneficial to wine quality (Teixeira et al. 2013).
In order to realize benefits, vine water deficit must be maintained within strict thresholds in order to maximize the vines’ water use efficiency (i.e. water savings). Over-withholding water will negatively stress the vine, compromising quality and yield, while over-irrigation fails to realize water savings and promotes vigorous, vegetative growth (Prichard et al., 2005). Stress
thresholds have been determined by Carbonneau (1998) for leaf water potential readings and are displayed in Table 1. In addition, sap flow thresholds have been determined by Lascano et al. (1992), which identifies critical vine water status and functions as a trigger to irrigation. Thresholds are discussed within the literature and the study.
The vines ability to manage stress is explained by Keller (2010), as “plasticity”. This natural characteristic of the vine allows adaptation to diverse growing conditions and vineyard management techniques to be applied to alter vine growth and response (Chaves et al. 2007). This source to sink relationship allocates energy to the plant organ needed to relieve the stress condition (Keller, 2010). Therefore, when the vine lacks water, such as conditions under deficit irrigation, root growth will be favored over shoot growth in order to search out water, which is the limiting factor. This allocation of resources allows grapevines to survive and potentially thrive in stressed conditions.
Through the improvement of water use efficiency, deficit irrigation management is effectively lowering water use in an agricultural sector that is currently realizing major water shortages (Chaves et al. 2007; Ojeda, Deloire & Carbonneau, 2001). Deficit irrigation is accepted as an effective management technique shown to manage canopy growth and improve grape composition – often resulting in wines that are often of higher value (Koundouras et al. 2002; van Leeuwen, 2009).
2.2 Application of deficit irrigation
“Deficit irrigation is a current tool capable of relieving the pressure of water shortage”
(Chaves et al. 2010). The need for irrigation is dependent on climate, growing conditions and vineyard management techniques, and may also be restricted or illegal in certain growing regions. Regional climates vary, but many of the world’s vineyards are located in Mediterranean climates with low growing season rainfall accumulation. Figure 1 displays Napa Valley’s average rainfall and temperature accumulation annually. This seasonal lack of rainfall often necessitates irrigation, the tool making deficit irrigation applicable (Chaves et al. 2007).
Deficit irrigation can be applied anytime during the season but literature shows that the largest benefit of water stress is applied between berry set and veraison (Jackson, 2003; Chalmers, 2007; Edwards & Clingeleffer, 2013). Ojeda et al. (2001) find severity and timing of water deficits to be most beneficial between anthesis and veraison; in the study, imposed water deficits post-veraison did not have a significant effect on berry weight. Ojeda et al. (2001) also finds that water deficit does not decrease cell division but does impede cell expansion – therefore effectively decreasing cell size and thus berry weight. Lower berry weights led to decreased juice to skin ratio and changing berry composition (Ojeda et al. 2001). Final berry weight is found to be dependent on the intensity of applied water deficits (Ojeda et al. 2001). Water deficit can be monitored with different methods, including soil-based measurements, plant based measurements, and water balance models (Pelligrino et al. 2004). Difficulties of applying deficit irrigation are noted in literature and realized by the difficulty of monitoring vine water status (Chaves et al. 2007; Jones, 2004). All applications have advantages and disadvantages – in this study pre-dawn leaf water potential and sap flow were used to monitor vine water status and trigger irrigation events.
Water potential readings taken with a pressure chamber (Scholander, 1965), have shown to improve irrigation timing and benefit oenological potential of field grown wine grapes (Chone, Van Leeuwen, Dobourbieu & Gaudillere, 2001; Williams & Araujo, 2002). Williams and Araujo (2002) find a correlation between midday leaf, midday stem and predawn leaf water potentials. The study concludes midday leaf water potential to be the “most convenient” due to the time of day, as all measurements were correlated with leaf gas exchange. However, Williams and Araujo (2002) state the influence of vapor pressure deficit, ambient temperature, wind and radiation directly affect vine transpiration throughout the day. These extenuating climatic parameters convolute the accuracy and use of the reading. Rogiers et al. (2009) confirms the relation between vapor pressure deficit and leaf water potentials taken during midday and predawn values, stating increasing vapor pressure deficit exponentially increases vine transpiration.
Pressure bomb readings before sunrise aim to capture vine water status when the vine is hypothetically rehydrated and balanced with soil water status; pre-dawn also coincides with the time of day with the lowest demand. A drawback of pre-dawn leaf water potential, it is argued, is that the vine rehydrates the plant system from the wettest part of the soil profile (Williams & Araujo, 2002). Further, Donovan et al. (2001) found that significant nighttime transpiration caused inconsistent pre-dawn measurements. These findings add to the difficulty of the
readings and amplify the human error that is often associated with the early hours of the day when the readings are taken.
Sap flow is a technological solution to the time and labor requirements of non-continuous methods often employed to address vineyard water status. Lascano et al. (1992) find a correlation between sap flow readings and stem water potential readings – verifying the ability to use sap flow sensors as an irrigation indicator.
Jones (2004) outlines sap flow advantage as sensitive – stating that the technology is able to monitor minute changes in a vines sap flow. These sensitive readings are likely more accurate than other water status indicators and functionality is ideal when vine water status starts to become limited – the critical region when irrigation becomes necessary. Jones (2004) finds the drawbacks of sap flow to be the complexity of the technology and requirement for specialized personnel to install and interpret the data. This in turn makes implementing a successful irrigation strategy utilizing sap flow technologies difficult.
In response to difficulty of applying beneficial water deficits and expense of some technologies (Chaves et al. 2007; Jones, 2004), companies such as Fruition Sciences Inc. have emerged to distribute the benefit sap flow technology commercially. The founder of Fruition Sciences Inc. Thibaut Scholasch has partnered with Dynamax Corp. to demonstrate the benefit of sap flow in commercial vineyards and has constructed a team to minimize the difficulty of using the equipment in a commercial setting. In a 1992 study, Lascano et al. (1992) demonstrate the increased sensitivity of sap flow in comparison to soil moisture readings when assessing vine stress, and find a high correlation among the trials. This further verifies the use of sap flow as a continuous, non-invasive technology for streaming data on vine water status. The sensitivity and automation of this technology may continue to improve precision viticulture quality output, while effectively minimizing input.
2.3 Vine Response
The benefit of maintaining a vine at lower water availability than that of a full watered vine is through transpiration and carbon acquisition (Jackson, 2003). Stomatal regulation in the leaf
Photosynthesis’ resistance to water stress allows the plant to maintain similar levels of photosynthetic activity – allowing starch accumulation and improving water use efficiency. Vine physiological components were found to affect vine response to drought conditions but results have been mixed (Schultz, 2003; Collins, Fuentes & Barlow 2010). Schultz (2003) reported that Grenache exhibited much higher stomata control (isohydric) during drought conditions than Syrah (anisohydric). Collins et al. (2010) investigated Syrah’s anisohydric behavior and found that Shiraz’s stomata sensitivity under drying soil conditions indeed improved water use efficiency due to stomata closure; contradicting Schultz (2003) findings. In addition, the vines response to high vapor pressure deficit was improved – thus managing water loss and maintaining beneficial photosynthetic capacity. It seems that there are multiple factors playing into a vineyards water use efficiency and it can be concluded that other factors such as rootstock, deficit severity, timing and climatic demand also influence the degree of control exhibited by the vine (Chaves et al. 2010; Rogiers et al. 2009).
2.4 Climate
Climatic demand is determined by calculating evapotranspiration (ET). Using the Penman-Monteith equation that is a common method used for ET calculation and uses a theoretical grass reference crop. A value is calculated for reference evapotranspiration (ET0) taking into
consideration temperature, wind, solar radiation and vapor pressure deficit. ET0 figures are
calculated based on local weather station data and gives daily values for water lost through evaporation and transpiration. This calculation of ET0 is used in water models (Pelligrino et al.
2004) and regulates sap flow; it is the driving factor of vine water use. 2.5 Deficit irrigation, berry weight and yield
There are many environmental factors that can affect vine berry growth and yield including sunlight interception, pest and disease and water deficits (Keller, 2010). Here we look to water deficit effect on berry weight, influence on metabolites and consequence on yield. As stated by Keller (2010) irrigation management is a tool that controls cell expansion within the grape berry and is typically applied after cell division has taken place. Cell division differentiation is a topic that should be addressed within varietal gene selection (Keller, 2010; Schultz, 2003).
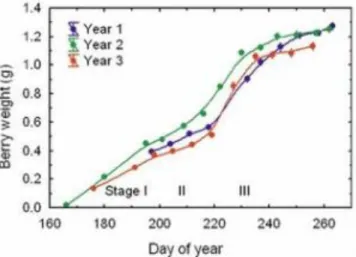
Figure 2 depicts berry growth split into three distinct stages. Stage I is characterized by the end of cell division and cell expansion; at which point cell expansion is dependent on water availability, among many other environmental stress’ (Keller, 2010). Stage II is characterized as a lag phase where berry weight growth slows before entering stage III. The beginning of veraison marks stage III. Deficit irrigation strategies vary but regulating the deficit to specific
periods (i.e. anthesis (stage I) – veraison (stage III)) has been shown to achieve superior results when compared to prolonged deficit strategies applied over the entire growing season (Matthews, 1990).
Several studies confirm the relation of vine water status with berry weight and yield (Clingeleffer, 2009; Etchebarne, Ojeda & Hunter, 2010). In a study comparing irrigated vs. non-irrigated vines, Etchebarne et al. (2010) found a clear difference in yield due to consequences on berry weight; this finding was only when predawn was more negative than -0.3 MPa. These findings suggest mild to moderate water stress detailed by Carbonneau (1998) may effectively decrease vine water use without impacting yield.
Figure 2: Berry growth chart demonstrates sigmoidal curve (image: Keller, 2010)
Vine physiological components are well cited in literature as having an effect on vine response to water deficits in terms of yield and quality. Source – sink relationships have been shown to effect the uptake of water and nutrient localization with the vine, therefore raising the importance of the timing and degree of vine management and manipulation (Etchebarne et al. 2010; Clingeleffer, 2009; Keller, 2010). Therefore, phenological development of the vine will dictate vine water needs and subsequent effect on the berry composition depending on when water deficits are applied.
2.5.1 Deficit irrigation and berry composition
Berry composition quantification is an important indicator of potential wine quality (Van Leeuwen, 2008). Primary and secondary metabolites provide the structure of the berry and make up the qualitative components necessary for winemaking. Primary metabolites include sugars and acids, while secondary metabolites are composed of anthocyanins, flavonols and tannins (Chalmers, 2007). These parameters are affected by deficit irrigation strategies (Edwards & Clingeleffer, 2013) and ultimately contribute to wine quality and sensory characteristics. Light water deficits have also been shown to decrease shoot growth, therefore increasing photosynthetic capacity of the interior leaf canopy area and available assimilates to berries, hastening ripening (Chalmers, 2007).
Anthocyanins make up the color of the grape berry and are comprised of 5 different forms: cyandin, peonidin, delphinidin, petunidin and malvidin (Ojeda et al. 2002). Flavonols in grape berries are said to be UV protectants – sheltering berries from damage due to sun exposure (Chalmers, 2007). Flavonols are involved in co-pigmentation that are the result of a combination of an anthocyanin and flavonol – resulting in a coloration pigment that is often more intense and stable (Boulton, 2001). Tannins in wine contribute to mouth-feel and astringency and are derived from the skin and seeds (Jackson, 2003). Concentrations of tannins per berry depend on seeds per berry and berry size (Harbertson et al. 2002).
Roby (2004) finds differences in grape composition due to water status manipulation justifying it as an effect of metabolite synthesis pathways rather than a berry size concentration affect. Although it is clear from the findings that water deficit will affect berry weight and composition – the exact level of stress, benefitting grapevine phenology, grape quality and ultimately the resulting wine, remained in question. Prichard et al. (2005) found pre-veraison water deficit to increase skin phenolic and anthocyanin content more than post-veraison, but a continual deficit (pre + post-veraison) resulted in the highest phenolic and anthocyanin content.
2.6 Concluding remarks
In summary, speculation into vineyard management leads one to realize many decisions are made for economic gains. These gains are achieved through thoughtful vineyard management and input control, and add to the value of grapes that are produced from a given vineyard. Van Leeuwen et al. (2008) study demonstrates correlations between high quality vintages in France’s Bordeaux region in relation to water status during a particular years growing season. This study alone supports deficit irrigation strategies in regions where irrigation is necessary and utilized. With on-going drought conditions and economic implications imposed by government in
the form of water taxes – astute water management and increased water use efficiency in vineyards will likely become widespread.
3. MATERIALS AND METHODS
This study was funded by the Southern California Municipal Water District in order to identify and quantify agricultural water saving techniques. Candidates for the study were chosen by Fruition Sciences and incorporated into the study upon agreement to comply with the study’s outline. Therefore, exact location and names of participating vineyards and producers have been withheld.
3.1 Site Location
The study was conducted in the 2014-growing season. Five sites were selected to use in the experiment. Two sites were located in Paso Robles (35.640833, -120.653889), three in Napa Valley (38.427432, -122.39433). The sites location can be visualized in Figure 3; sites 1 and 2 are located on the central coast of California in the wine-growing region of Paso Robles, sites 3, 4 and 5 are located in the wine region of Napa Valley. Exact locations of the sites are withheld due to the request of participating vineyards and that of Fruition Sciences.
Site 1: PR - A
Located in Paso Robles, California. The study block was a .93-hectare area. Planting material is Syrah Estrella clone on 420A rootstock, planted in 1999. Vine spacing is .9m x 2m; plant density of 5,945 plants per hectare. Irrigation was applied at a rate of 4 liters per hour with one emitter per vine.
Site 2: PR - HR
Located in Paso Robles, California. The study block was a 5.26-hectare area. Planting material is Cabernet Sauvignon 337 clone on 110R rootstock, planted in 2001. Vine spacing is 1.83m x 2.44m; plant density of 2,243 plants per hectare. Irrigation was applied at a rate of 2 liters per hour with one emitter per vine.
Site 3: NV - K
Located in Oakville, California. The study block was a 3.15-hectare area. Planting material is Cabernet Sauvignon 4 clone on St. George rootstock, planted in 2000. Vine spacing is 1.83m x 3.05m; plant density of 1,791 plants per hectare. Irrigation was applied at a rate of 4 liters per hour with two, two-liter emitters per vine.
Site 4: NV - M
Located on Howell Mountain in the Napa Valley region. The study block was a 1.34-hectare area. Planting material is Cabernet Sauvignon 337 clone on 1103P rootstock, planted in 1997. Vine spacing is 1m x 1.83m; plant density of 5,364 vines per hectare. Irrigation was applied at a rate of 2 liters per hour with one emitter per vine.
Site 5: NV - JP
Located in Bennett Valley in the Sonoma valley region. The study block was a 2.47-hectare area. Planting material is Merlot 181 clone on 101-14 rootstock, planted in 19 99. Vine spacing is 1.22m x 2.13m; plant density of 3,856 plants per hectare. Irrigation was applied at a rate of 2
criteria including; homogeneity of slope, soil, vine material, vigor, absence of frost risk, requirement of irrigation and adequate tonnage.
The research design consists of applying 2 treatments in 5 vineyards blocks. Each block is split into 2 irrigation treatments, referred to as experimental and traditional treatment.
A) Traditional: control treatment irrigation is applied according to the vineyards conventional methodologies detailed by vineyard management practices and/or irrigation logs.
B) Experimental: sap flow treatment where irrigation is triggered according to plant-sensor data. The plant-based irrigation treatment will be triggered according to sap flow data because it is continuous, provides a crop coefficient and is commercially proven.
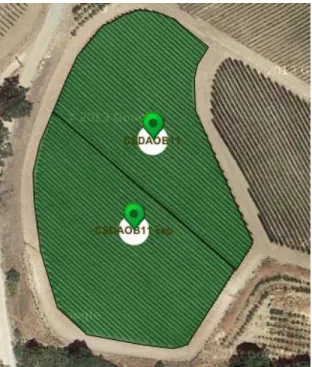
The split site design applied across all treatments is displayed in Figure 4. The image displays the split-block experimental design as displayed on Fruition Sciences web interface for one of the five study sites. The boundary line splits the two treatments. The green arrows indicate the sap flow locations. A treatment boundary line was established with a minimum of 6 vineyard rows buffering between the sap flow devices to minimize irrigation events from contaminating the opposing side of the experiment.
Figure 4: Experimental Design as shown by Fruition Sciences web-interface. All sites were split, with half of the vineyard referred to as “traditional” and the other “experimental” (exp).
Experimental sites were managed similarly until June 1, 2014 in order to allow viticulturists to achieve an adequate/desirable leaf area, mimicking a traditional canopy that would be achieved at the particular site. After June 1, the vineyard block irrigation regimes were split and applied according to traditional or experimental applications.
3.3 Characterization of water status
Vine water status was determined by sap flow and predawn leaf water potential. 3.3.1 Sap flow
The heat balance method (Sakuratani, 1981) was applied to sap flow equipment provided by Dynamax (Dynamax Inc. Houston, Texas, USA). Dynagage sensors were used on each vine that was monitored for sap flow and data was recorded every 15 minutes to an installed SAPIP wireless network. The wireless network was synced with a local weather station in close proximity to the study site. The data was used to calculate the Water Deficit Index (WDI) used for irrigation decisions in the experimental treatments.
WDI is calculated using evapotranspiration ETo (See 3.5) and sap flow rate. This ratio (ETo: sap
flow) is applied to a confidential algorithm in order to achieve % transpiration. A basic example of the model is: WDI = (ET0 / kc) * 100.
The index is driven by climate and plant factors and essentially, when the vine is meeting climatic demand a ratio of 1:1 is achieved which correlates to a 100% WDI (Loscano et al. 1992). Accordingly, a decrease in sap flow (under the same climatic conditions) effectively reduces the WDI reading. As stated, the effective range of the WDI% is between 40 – 100%. Several WDI graphs (See Fig. 11) show readings greater than 100%, this range is not necessarily accurate but does confidently show that vines are not under any water stress. The WDI profile is most accurate when sap flow readings are low and approaching moderate – severe water deficits (i.e. 40% WDI). The profile is calculated as a moving average in order to account for daily fluctuation in weather conditions and is calculated over 5 days. Therefore, WDI is not reported as a constant value until 5 days after the date. A sap flow site is constructed
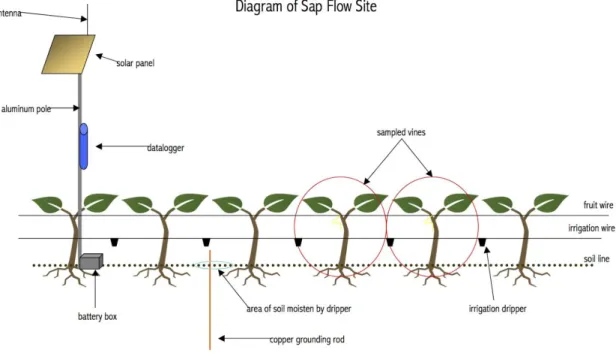
Figure 5: The sap flow diagram as depicted by Fruition Sciences. Two sampled vines, circled in red, are chosen as representatives for the vineyard area and were chosen according to vineyard uniformity. Data was fed to the data logger and broadcast for real-time data retrieval by Fruition Sciences and the customer.
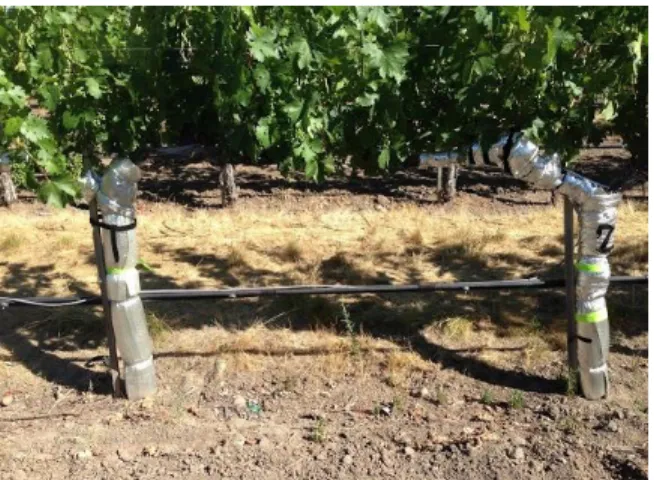
Vines are covered with an insulated, reflective material to remove external heat influence, shown in Figure 6 and 7. The selected vine is monitored on the horizontal cordon instead of the vertical trunk to remove any influence of ground heat radiation and gradient effects (Lascano et al. 1992). This is due to the sensors use of thermocouples, which use heat application to determine the speed at which sap is flowing through the plant – removing the influence of external heat sources is imperative to data quality.
Figure 6: Equipped Sap Flow Vine: Vine trunk and cordon are covered to remove any external heat source.
Figure 7: Sensor and stem section: Heat application is applied through the heating strip (yellow), wraps the vine cordon and measures the rate of sap flow.
3.3.2 Pre-dawn leaf water potential
Pre dawn leaf water potential (PDWP) was measured with a pressure chamber (model 615, PMS Instrument Co. OR. USA) according to techniques proposed by Scholander (1965). Measurements were taken just before dawn every 7 – 10 days, beginning in June. PDWP was measured at all sites except NV-JP due to economical restraints.
PDWP is a plant-based measurement of the vine’s water status. The method is discontinuous and destructive. Sampling is completed before dawn in order to sample a non-transpiring leaf.
Table 1: Predawn leaf water potential thresholds Carbonneau (1998)
Pre-dawn leaf water potential reading (MPa) Associated water constraint or stress
0 MPa ≥ Ψpd ≥ -0.2 MPa No water deficit.
-0.2 MPa ≥ Ψpd ≥ -0.4 MPa Mild to moderate water deficit. -0.4 MPa ≥ Ψpd ≥ -0.6 MPa Moderate to severe water deficit. -0.6 MPa ≥ Ψpd ≥ -0.8 MPa Severe to high water deficit (=stress)
< -0.8 MPa High water deficit (=stress)
3.4 Sampling area
A stratified sampling technique (Fig. 8) is employed by Fruition Sciences this is in accordance with literature and employed to encompass the spatial variability within the vineyard (Meyers, 2011). The encompassed sampling area is referred to as a “smartpoint” where all collected data from a given block is gathered. Figure 8 depicts vineyard rows and the smart point layout. Each circle corresponds to a vine. Within this area:
Red dots correspond to vines monitored by sap flow
Orange & red dots correspond to vines monitored for PDWP
Pale green dots correspond to vines monitored for berry sampling
Dark green dots denote the end of the sampling area.
The smart point area encompasses 50 - 80 vines - all of which are included in berry sampling.
Figure 8: Depiction of Fruition Sciences "Smartpoint" encompasses 50 – 80 vines and serves as a stratified sampling area throughout the duration of the growing season.
3.5 Environmental monitoring
Weather station data was taken in proximity to each study site and provided privately by Ranch Systems or through the California Irrigation Management Information System (CIMIS), a government program providing California weather stations. Climatic measurements include 4 parameters to compute ET0 in accordance with the Pennman-Monteith equation: temperature,
relative humidity, global radiation, and wind. The weather station data was automatically synced with Fruition Sciences web interface and allowed real-time data interpretation in conjunction with live sap flow data.
Crop evapotranspiration was determined for each site once the canopy was considered full (See 3.3.1). This was determined to be around 500 growing degree days (GDD) or when canopy hedging took place. Raw sap flow data was assessed and the highest rate of transpiration, once a full canopy was achieved, was determined as the vine’s peak transpiration. These values were adjusted after the first irrigation to establish full transpiration near 100%.
3.5.1 Weather station location
Site 1: (PR – A) – Paso Robles; provided by CIMIS - Paso Robles #6730
Site 2: (PR – HR) - on-site; provided by Ranch Systems
Site 3: (NV – K) – Oakville; provided by CIMIS - Oakville #77
Site 4: (NV – M) on-site; provided by Ranch Systems
Site 5: (NV – JP) - Bennett Valley; provided by CIMIS - Bennett valley # 158
3.6 Irrigation
3.6.1 Irrigation monitoring
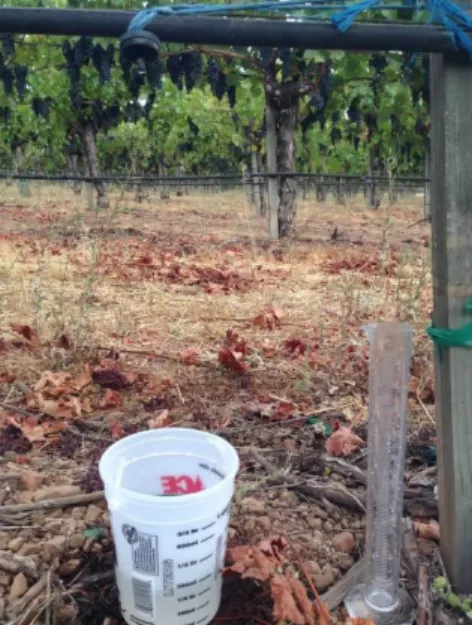
Decagon Devices, Inc. ECRN-50 low resolution Rain Gauge (Fig. 9) were used to monitor actual application applied by irrigation emitters; data was recorded and stored by the EM50 data logger. One rain gauge was installed per site in order to verify applied water volumes. Data was stored at 10-minute intervals and collected bi-weekly to confirm irrigation duration and volume. Irrigation emission rate was calibrated (Fig. 10) at several sites to ensure data quality. Water
Figure 9: Decagon irrigation loggers were installed at each site.
Figure 10: Irrigation calibration was completed to determine uniformity of dripper emission and accuracy of Decagon Devices irrigation loggers.
3.6.2 Irrigation Scheduling
The objective of the study was to compare traditional irrigation methods against the sap flow method. Traditional study blocks irrigation applications were determined by on-site vineyard teams detailing the sites conventional methodologies used by growers. In the case of poor or non-existent irrigation records, verbal accounts were recorded and applied throughout the 2014-growing season.
Experimental study blocks irrigation applications were determined from continuous sap flow data. Sap flow data was the primary indication of vine water status and was confirmed by
PDWP readings and visual inspection. Application volumes in experimental blocks were determined on a per site basis and were determined by a large first irrigation to saturate the entire root zone. The irrigation methodology used by Fruition Sciences is to apply water to reach 100% WDI. Following the first irrigation event reaching 100% in a given vineyard, a second irrigation in the block was decreased in volume to determine if the same effect was seen in sap flow readings reported in the WDI graphs.
3.7 Berry Sampling
Fruit samples were taken 6-8 times throughout the growing season, per site. Sample areas were set at the beginning of the season and this area was sampled throughout the season. A typical format of berry-sampling area can be found in Figure 8, is associated with the “smartpoint” sampling area (See 3.4) and encompasses 50 - 80 vines. From the sample area, 4 berries were sampled per vine from top, bottom, front, and back of a cluster to account of heterogeneity within the bunch. Once collected, all samples were taken to a local ETS laboratory (ETS laboratories, St. Helena, CA; Paso Robles, CA) to be analyzed. All results were synced directly to Fruition Sciences website.
3.7.1 Berry Weight and Yield
Grape berry weight was monitored manually by weighing a 200-berry sample and dividing to get an average weight per berry. A balance was used to give berry weight in grams.
Yield comparison was done on-site on the day of harvest. To compare yield, 50 vines were harvested from each side of the study (experimental and traditional) and weight was compared in tons. The sample harvest from each site was extrapolated to the entire vineyard to compare entire vineyard harvest tonnage. Due to time and operation constraints, yield numbers were only reported once and therefore create a limitation within the data.
3.7.2 Sugar, pH and Acid
Sugar was measured and reported in degree brix (°brix). One-degree brix is 1 gram of sucrose in 100 grams of aqueous solution. The measurement was taken using a digital refractometer.
Fourier Transform Infrared Spectroscopy (FTIR) was used in several instances to obtain sugars, in addition to determining pH and acids present in the juice samples. FTIR passes infrared light through the sample and captures reflected light. This reflected light is measured as interference and mathematically interpreted by the FTIR program and provides a digital display of sugar, pH and acids.
3.7.3 Phenolics
Phenolic content of grapes was measured according to Waterhouse et al. (1999). ETS laboratories employs a method elaborated from the polystyrene method outlined in Waterhouse et al. (1999). The method requires 250 grams of fruit, includes the addition of 15% ethanol solution followed by a light maceration. The macerated grapes are then heated lightly for less than an hour. The maceration is then tested using reversed-phase high-performance liquid chromatography method. The method derives total phenolic compounds, tannin and anthocyanin content in milligrams per liter.
3.8 Data analysis
Compilation of data yielded water use profiles from sap flow and PDWP measurements. Berry weight was used as a precursor for qualitative assessment as found by cited literature (Matthews et al. 1990; Edwards & Clingeleffer, 2013). Though all berry parameters were included in laboratory analysis this study relied most strongly on berry weight due to its influence on yield and quality (Edwards & Clingeleffer, 2013).
3.8.1 Statistical data analysis
Statistics analysis was done using Excel. Data from all sites was combined and correlations were determined assessing independent and dependent variables. A regression analysis was used to analyze the effects of the amount of water applied and water deficit index (independent variables) on yield components and berry composition (dependent variables).
4. Results and Discussion
This chapter presents the findings of the study with regard to climatic data, measured water deficits and the outcome on berry weight, composition and yield. A climatic comparison is considered to quantify differences between the vineyard sites and the effect this had on individual site water use behavior. Preliminary results are presented to give the reader an idea of initial findings. These findings are followed by individual site analyses that look deeper into site-specific responses and behavior.
4.1 Climatic Comparison
Paso Robles city reports average rainfall of 14.11 inches or 378.75 mm. This is subject to change micro climatically and is reflected in vineyard accumulations. Napa Valley, CA averages reported at 27.71 inches or 704 mm. The 2014 growing season reflects the current rain and water shortage in California as shown in Table 2.
Initial observation of the two growing regions signifies the superior climatic demand experienced in Paso Robles. Vapor pressure deficit, evapotranspiration and thermal time are all substantially higher for the Paso Robles region when compared to Napa Valley, in addition to, rainfall averages that are nearly 45% lower.
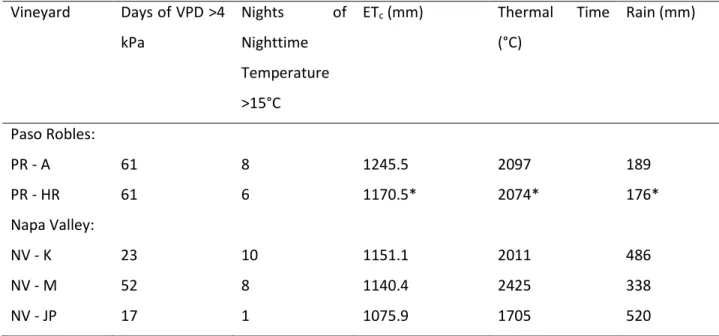
Table 2: 2014 climatic comparison between 5 study sites located in Paso Robles and Napa Valley Vineyard Days of VPD >4 kPa Nights of Nighttime Temperature >15°C ETc (mm) Thermal Time (°C) Rain (mm) Paso Robles: PR - A 61 8 1245.5 2097 189 PR - HR 61 6 1170.5* 2074* 176* Napa Valley: NV - K 23 10 1151.1 2011 486 NV - M 52 8 1140.4 2425 338 NV - JP 17 1 1075.9 1705 520
VPD & Nighttime temperature observed from the 60th day of the year (March 1) through
October 31, 2014.
ETc & thermal time are observed from January 1, 2014 through October 31, 2014.
Rain (mm) is observed for the time period of November 1, 2013 through October 31, 2014.
* Halter Ranch 2014 data starts on February 14 and therefore requires further analysis in order to compare to the other sites.
Climatic quantification demonstrates the climatic difficulty of the Paso Robles growing region with intense temperature, high vapor pressure deficit and low rainfall. Paso Robles can be considered a typical Mediterranean climate that exhibits extreme temperatures during summer months that are reflected in the high number of vapor pressure deficit days greater than 4kpa throughout the season. These growing conditions precipitate the need for irrigation earlier and more often in the growing season when compared to Napa Valley – therefore the possibility of saving water in the area is considerable.
4.2 Introduction to data presentation
The data was analyzed as individual sites and then compiled to analyze as a group. Both
analyses are important due to individual vineyards realizing benefits and also to identify success of the application method applied across all sites.
4.3 Site #1. PR - A
Site PR-A is located in Paso Robles and used a Syrah block for the experiment, Michael Young. The experimental treatment used less water, both the recorded volume and volume reported by
the client were less in the experimental treatment, shown in Table 3. This site was the most extreme, with low rainfall and high climatic demands. The need for irrigation is increased by the regions on-going drought conditions and water well, that is becoming insufficient to meet vineyard needs. Due to this, PR-A was an excellent site to monitor possibility for water saving.
Table 3: PR – A 2014 Syrah vineyard site rainfall and irrigation: Applications, duration and volumes comparing the site’s traditional study block and experimental study block.
Treatment 1st Irrigation event Total # of irrigations 2014 hours of activity - rain gauge 2014 rain gauge volume Measured (mm) 2014 verbal volume Reported (mm) Rainfall (mm)*
Traditional 6/17 4 24 hours 20 min 87.55 46.26 37.4 Experimental 7/23 1 8 hours 40 min 25.18 18.92 37.4
Water saving - 71% -59%
*Rainfall is reported during the growing season from bud break (March 15, 2014) to harvest (September 3, 2014).
Before July 22 the experimental treatment at this site exhibits higher levels of water stress shown in both the PDWP (Figure 11) and WDI (Figure 12). The lower vine water status is in agreement with the withholding of the first and only irrigation in the experimental block until this date. This extended 25 mm irrigation maintains the vine through the growing season – until harvest.
Although the experimental section of the block used substantially less water – shown in Table 3 – the traditional site is on average exhibiting a lower WDI profile. The vertical bars displayed in Figure 11 and 12 coincide with irrigation events applied to the respective block. For example, in Figure 12, early season irrigation (denoted by the yellow, vertical bar) on June 16 increases the traditional vines WDI profile at near field capacity. This irrigation is thought to have decreased the vines water use efficiency and prepares the vine to require more water throughout the growing season, due to a decrease in hydraulic and chemical control (Etchebarne et al. 2010).