Recurrent selection of popcorn composites
UEM-CO1
and
UEM-CO2
based on selection indices
Rafael Augusto Vieira
1, Renato da Rocha
1, Carlos Alberto
Scapim
1and Antonio Teixeira do Amaral Junior
2Abstract: Selection indices were applied to data sets of 169 half-sib families of
the popcorn composites UEM-Co1 and UEM-Co2 in four cycles of recurrent selec -tion. From 2005 to 2008, the experiments were arranged in a 13 by 13 lattice square design, with two replications per cycle and composite. Genetic gains for popping expansion (PE) and grain yield (GY) were estimated based on several selection indices and truncation selection. The magnitude and balance of gains estimated for each trait by the indices were compared by an auxiliary statistical value (Ci). This value Ci consists of an arbitrary value, resulting from differences between the gains estimated for n traits by truncation selection and by index i. The indices of Subandi and Mulamba and Mock were the most promising to estimate high and balanced genetic gains for PE and GY in recurrent selection of half-sib popcorn families.
Key words: Zea mays L., multiple-trait selection, popping expansion, grain yield.
Crop Breeding and Applied Biotechnology
17: 266-272, 2017
Brazilian Society of Plant Breeding. Printed in Brazil
http://dx.doi.org/10.1590/1984-70332017v17n3n40
NOTE
*Corresponding author:
E-mail: ?
Received: 10 January 2014
Accepted: 09 September 2015
1 Universidade Estadual de Maringá, Departa -mento de Agronomia, 87.020-900, Maringá, PR, Brazil 2 Universidade Estadual do Norte Fluminense Darcy Ribeiro, Laboratório de Melhoramento Genético Vegetal, 28.013-602, Campos dos Goytacazes, RJ, Brazil,
INTRODUCTION
Popcorn is highly appreciated by the Brazilian population and the crop acreage in the country is on the rise. However, factors such as the limited availability of hybrid seeds and high-quality varieties are pressing towards higher popcorn imports (Sawazaki et al. 2003). On the other hand, researchers are dedicated to developing superior and adapted genotypes, especially with regard to popping expansion (PE) and grain yield (GY) (Amaral Júnior et al. 2013, Ribeiro et al. 2016). In some situations, the obstacle of negative correlation between PE and GY has to be overcome, so that the developed product satisfies both producers and consumers (Zinsly and Machado 1987, Carpentieri-Pípolo et al. 2002, Broccoli and Burak 2004, Faria et al. 2008, Freitas et al. 2013).
With a view to increase the accuracy of choice of the genotypes that contain a combination of both agronomic and quality traits in a single line, selection indices are very useful breeding tools for crops such as popcorn, for allowing the choice of the target traits for improvement. In this context, Granate et al. (2002) evaluated half-sib families of the popcorn composite CMS-43, and found that the Smith and Hazel index predicted higher gains for a greater number of traits, and that the percentage gain for the combination of the two most important traits was 9.14%. In a study of the perfromance of S1 and S2 progenies obtained
267
Crop Breeding and Applied Biotechnology -
17: 266-272, 2017
(UNB-2U/UENF-14) by the method of half-sib families, Santos et al. (2007) found that the Mulamba and Mock index using arbitrary weights, resulted in higher gains for most traits, including PE and GY (7.6% and 10%). In the fourth recurrent selection cycle of the same population, Freitas Júnior et al. (2009) selected 30 superior families by the Mulamba and Mock selection index with arbitrary weights, (10.55% for PE and 8.50% for GY). In an evaluation of the fifth selection cycle of population UNB-2U, Rangel et al. (2011) found that the selection of superior families should be based on the Mulamba and Mock index, for estimating highest gains (6.01% for PE and 8.53% for GY). Analyzing the sixth recurrent selection cycle in population UENF-14, Ribeiro et al. (2012) observed, as in the previous publications, that the Mulamba and Mock index predicted the best gains (PE 10.97% and GY 15.30%), based on random economic weights.
Although the above studies demonstrate the efficiency of the tested indices, to date only part of the methodologies have been applied. Among the indices used in popcorn breeding, those of Smith (1936) and Hazel (1943), Williams (1962), Pesek and Baker (1969) and Mulamba and Mock (1978) are noteworthy. However, the indices of Tallis (1962), Cunningham et al. (1970) and Subandi et al. (1973) have not been applied in segregating popcorn populations so far. Moreover, previous studies failed to indicate a measurable form of comparing the selection indices in terms of the genetic gain estimates. In this context, this paper proposes and describes the statistical value C
i, which is promising for indicating which index estimates high and balanced genetic gains for traits. In this sense, the different selection indices for popcorn were compared, based on data collected in four recurrent selection cycles of half-sib families of the composites UEM-Co1 and UEM-Co2.
MATERIAL AND METHODS
Four recurrent selection cycles (C0, C1, C2, and C3) of the popcorn composites UEM-Co1 and UEM-Co2 were evaluated
in this study. Composite UEM-Co1 has yellow grain, resulting from open pollination among 17 popcorn genotypes. Composite UEM-Co2 has white grain, derived from 12 popcorn genotypes. The selection cycles of the composites UEM-Co1 and UEM-Co2 were performed and evaluated in the municipality of Iguatemi, Maringá, in the north of Paraná, Brazil. One hundred and sixty-nine half-sib families were tested in a 13 by 13 lattice square design, with two replications for each selection cycle of the composites. The experimental units consisted of a single 5-m row, spaced 0.90 m apart, with a total of 25 plants per plot. The experiments were carried out between 2005 and 2008. Basal and topdressing fertilization were applied according to the crop requirements, as indicated by soil analysis. Other cultural practices were applied as recommended for maize cultivation in southern Brazil.
The half-sib families were evaluated for the traits grain yield (GY) and popping expansion (PE) in each selection cycle of the two composites. Grain yield was measured by weighing the amount of grain produced per plot, adjusted to kg ha-1, at 13% moisture. The PE was determined based on a grain sample of 30 g taken from the intermediate portion
of the cobs, at 13% moisture (mL g-1). The grain samples were popped for 2.5 minutes at 270 °C in an electric popcorn
popper. The best families were selected and recombined, according to the method between and within half-sib families (Paterniani 1967).
For data analyses, analysis of variance (ANOVA) was performed for each selection cycle and composite. The intra-block analysis followed the lattice model: Yijk = m + gi + bk/j+ rj + E
ijk , where: Yijk = observation of each half-sib family ith, located in the kth block in the jth replication; m = overall mean; g
i = effect of each half-sib family; bk/j = effect of the kth block, in the jth replication; r
j = effect of the rth replication of the experiment; Eijk = experimental error associated with Yijk; and gi and bk/j were adjusted by analysis of variance.
The statistical value C
i was designed to compare the selection indices with regard to maximization and balance of genetic gains for GY and PE. This value is based on the difference between the genetic gain for each trait of a set, estimated by an index, and the maximum possible gain of this trait in the study population. We suggest the measurement of the maximum genetic gain by truncation selection. The C
i value should be calculated for each selection index under study. The most appropriate selection index is the one represented by the lowest C
i value, indicating effectiveness and the possibility of considerable genetic gain for several traits under the specific conditions of the study population. The reason is that in every trait, the genetic gains of an index are subtracted from the maximum possible genetic gains in the study population. It is expected that good selection indices will estimate high gains for the traits with highest chances for improvement in the population, as estimated by truncation selection. In the opposite case, the higher C
i valueindicates the situation. This procedure is performed at the beginning of the calculation. The basis of the maximum possible gain is a key point of using C
i. Nevertheless, it is also expected that good selection indices will achieve relevant gains for the other target traits, a condition measured by the sum of all effects of n characters, incorporated in the general expression of C
i. Furthermore, when the genetic gain of truncation selection is reduced to one trait, the difference between the maximum gain and the gain estimated by an index is not as important in terms of increase in the C
i value. In this sense, the statistical value C
i allows an identification of the selection index that fits best in view of the possibilities of breeding and limitations of each population, i.e., this index can provide high and balanced genetic gains for the studied traits and makes better use of the opportunities for breeding intrinsic to the study population.
The general expression to calculate C iis: Ci=
J
Σ
j=1(GGij – GGtsj)2
2 |GGtsj|
Where: GGij = is the genetic gain estimated by the ith selection index for the jth trait; GGtsj = maximum possible genetic gain for the jth trait, estimated by truncation selection. If the truncation selection cannot be estimated, GGts
j can be represented by the maximum genetic gain for the jth trait, for the ith selection index. In this study, the genetic gains for each index were estimated over four selection cycles of the two composites at a selection intensity of 20%. Then the statistical value C
i was applied, using Microsoft Office Excel spreadsheets.
RESULTS AND DISCUSSION
The results of the analysis of variance (ANOVA) for all cycles and composites are shown in Table 1. Significant differences were observed for the source of variation (p <0.05) for all cycles and composites for both traits (PE and GY). It is well-documented that the presence of genetic variability is imperative for good results with selection (Silva et al. 2001). In this context, the genetic variability for the composite UEM-Co2 was generally greater, a factor that can explain the relatively higher gains of this composite than of UEM-Co1 in the different selection cycles (Table 1).
Different conditions of variability (CVg) and heritability based on the family means were observed for the study traits of the composites throughout the selection cycles. The CVg values varied from 3.86 to 15.04% for PE and from 7.20 to 12.54% for GY. High heritability estimates were also found, indicating the possibility of selecting half-sib families with good accuracy. In fact, the heritability of composite UEM-Co1 in C0 was 0.638 for PE and 0.634 for GY. The heritability
estimated for composite UEM-Co2 was 0.754 and 0.606 for PE and 0.697 and 0.757 for GY, in the cycles C0 and C2,
respectively (Table 1). High heritability values for PE and GY were also reported by other authors (Pacheco et al. 1998, Coimbra et al. 2002, Santos et al. 2008).
The results of truncation selection at a selection intensity of 20%, for the composites UEM-Co1 and UEM-Co2, are shown in Tables 2 and 3. For both composites, positive genetic gains were estimated in most selection cycles on the basis of truncation selection. For composite UEM-Co1, the most significant gains for GY were estimated in cycles C0 and C3
(14.2% and 11.3% respectively), while for PE, in the cycles C0 and C1 (11.1% and 8.0%, respectively). The highest gains for
PE and GY were estimated in the first selection cycle C0 (Table 2). For composite UEM-Co2, based on truncation selection,
the genetic gains estimates were highest in the cycles C2 (16.5%) and C0 (14.1%) for GY, while higher PE estimates were
found in the cycles C0 and C1 (18.2 and 13.6%, respectively) (Table 3). These results indicate that, for both populations
and traits, truncation selection would maximize the efficiency in the initial breeding cycle (C0), which may be related to
269
Crop Breeding and Applied Biotechnology -
17: 266-272, 2017
Table 1. Analysis of variance (ANOVA) for popping expansion (PE) and grain yield (GY) in two popcorn populations in four selection
cycles of two popcorn composites UEM-Co1 and UEM-Co2
Source of variation df Mean squares
PE GY
C0 C1 C2 C3 C0 C1 C2 C3
UEM-Co1
Families 168 27.3* 22.3* 19.2* 17.6* 1.90E+5* 1.67E+5* 1.70E+5* 1.98E+5*
Block/Replications 24 9.5 10.8 30.4 58.8 0.89E+5 1.26E+5 4.29E+5 4.12E+5
Replications 1 18.9 10.0 4.5 84.5 2.52E+5 7.34E+6 5.62E+6 1.22E+6
Erro 144 9.9 10.3 11.9 14.2 7.00E+4 9.70E+4 1.09E+5 8.40E+4
Mean 29.6 30.6 31.3 32.3 1.97E+3 2.17E+3 2.15E+3 2.35E+3
CVe 10.63 10.49 11.02 11.67 13.45 14.38 15.38 12.36
CVg 9.96 8.02 6.11 4.04 12.48 8.58 8.16 10.17
Heritability 0.638 0.540 0.379 0.193 0.634 0.415 0.361 0.576
UEM-Co2
Families 168 31.2* 26.0* 22.7* 17.6* 1.98E+5* 1.70E+5* 1.42E+6* 1.97E+5*
Blocks/Replications 24 11.3 5.5 15.7 52.5 0.96E+5 1.22E+5 4.83E+5 4.22E+5
Replications 1 0.1 1.1 4.3 3.6 0.73E+5 1.70E+5 3.42E+4 1.96E+5
Error 144 7.7 6.2 9.0 14.2 6.00E+4 9.84E+4 8.31E+4 8.78E+4
Mean 22.8 28.2 33.3 33.9 2.18E+3 2.63E+3 2.87E+3 3.10E+3
CVe 12.17 8.83 9.01 11.12 11.26 11.92 10.04 9.56
CVg 15.04 11.10 7.87 3.86 12.06 7.20 12.54 7.53
Heritability 0.750 0.762 0.606 0.194 0.697 0.422 0.757 0.554
*Significant at 5% probability; C
0, C1, C2, and C3, indicating the recurrent selection cycles, 0, 1, 2, and 3, respectively
Table 2. Genetic gains estimated by selection indices and truncation selection for grain yield (GY) and popping expansion (PE) in four
cycles of the composite UEM-Co1 withyellow popcorn grain
Selection indices and truncation selection†
Estimated genetic gains C
0 C1 C2 C3
GY PE GY PE GY PE GY PE
Truncated for GY 14.2 1.9 7.9 2.1 7.1 0.4 11.3 0.1
Truncated for PE -0.1 11.1 0.9 8.0 -0.8 5.3 -0.9 2.4
SHCVg 14.1 1.0 7.9 2.2 6.9 -1.3 11.1 -0.3
SH350.1 4.2 10.8 3.0 7.7 1.7 5.1 8.2 2.0
SH1.1 14.1 1.0 7.9 2.2 6.9 -1.3 11.1 -0.3
WCVg 14.2 1.9 7.9 2.1 7.1 0.4 11.3 0.1
W350.1 5.7 9.8 3.6 7.8 2.6 5.0 5.4 2.3
W1.1 14.2 1.9 7.9 2.1 7.1 0.4 11.3 0.1
MMCVg 11.5 6.9 6.1 5.5 5.2 3.8 10.0 1.4
MM350.1 2.0 10.3 0.9 8.0 0.2 5.2 0.1 2.4
MM1.1 9.9 7.9 6.0 5.5 5.0 3.9 8.2 1.8
CunnCVg 13.4 4.9 7.4 4.2 1.7 5.1 11.2 0.5
Cunn350.1 10.3 2.0 -0.4 7.8 6.9 2.0 1.9 2.4
Cunn1.1 13.0 5.6 7.4 4.2 6.9 2.0 10.8 1.1
TallisCVg 10.9 7.7 6.5 5.7 5.3 3.9 7.2 2.1
Tallis350.1 10.9 7.7 6.5 5.7 5.3 3.9 7.2 2.1
Tallis1.1 10.9 7.7 6.5 5.7 5.3 3.9 7.2 2.1
PB1-DPG 10.9 7.3 5.5 5.7 5.3 3.9 7.2 2.1
Sub 11.7 6.9 6.7 5.5 5.6 3.7 9.6 1.6
†SH
CVg, SH350,1, SH1,1: indices based on Smith (1936) and Hazel (1943); WCVg, W350,1, W1,1: indices of Williams (1962); MMCVg,MM350,1, MM1,1: indices based on the sum of
“ranks” of Mulamba and Mock (1978); CunnCVg, Cunn350,1, Cunn1,1: restricted index of Cunningham et al. (1970); TallisCVg, Tallis350,1, Tallis1,1: restricted selection index of Tallis
(1962); PB1-DPG: index proposed by Pesek and Baker (1969) based on a genetic standard deviation as desired genetic gain; Sub: multiplicative index of Subandi et al. (1973);
higher for both traits, this direct selection strategy - also called truncated - is inadequate for satisfactory simultaneous genetic gains for two or more traits, as in the case of PE and GY, which are occasionally negatively correlated as well (Pacheco et al. 1998, Carpentieri-Pípolo et al. 2002, Daros et al. 2004b, Faria et al. 2008).
With regard to the applied selection indices, in a first analysis, the classical index of Smith and Hazel (1936, 1943) and that of Williams (1962) did not estimate balanced gains for both traits of the study populations (Table 2 and Table 3), suggesting limited applicability. Our results for the index of Williams (1962) confirmed those of Granate et al. (2002), who could find no advantage of using it. Other authors, however, reported different results. For example Daros et al. (2004a), when selecting families by the Smith and Hazel index, predicted relatively high genetic gains (17.8% for PE and 26.95% for GY). Similarly, Granate et al. (2002) found that this index allowed the prediction of higher gains for a larger number of characters, with joint gains of 9.14% for GY and PE. The results of the above authors differ from those in this study, since the Smith and Hazel index proved unsatisfactory for the prediction of genetic gains of the two main target traits in popcorn breeding (Tables 2 and 3). For both composites, the index of Tallis (1962), for all studied possibilities of economic weights, and that of Pesek and Baker (1969) using a genetic standard deviation as desired gain, estimated balanced genetic gains for GY and PE, except in cycle C3 of composite UEM-Co1, with gains of 7.2% for GY and 2.1 for PE
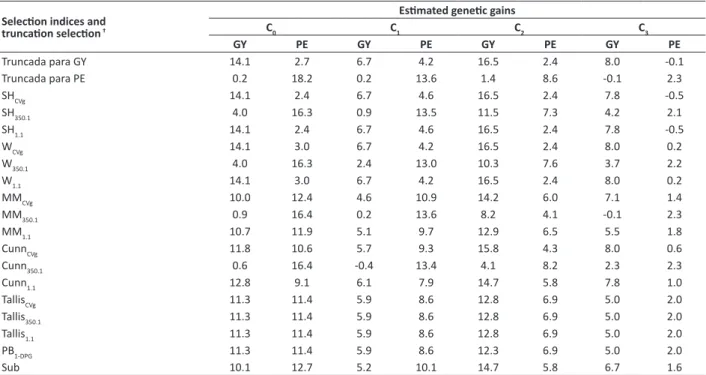
(Table 2). For composite UEM-Co2 in cycle C3, however, genetic gains of 12.8% and 6.9% for GY and PE, respectively, were
estimated by the Pesek and Baker method (Table 3). Good simultaneous gains were predicted by the index of Pesek and Baker (7.99% for GY, and 10.75% for PE), according to Freitas Junior et al. (2009), in an evaluation of 200 full-sib families in cycle C4 of the popcorn population UENF-14. Other selection indices, as that of Mulamba and Mock, also estimated balanced gains for the selection cycles of both composites. For this the economic weights were determined as CVg and 1 for PE and 1 for GY, in cycle C1 of composite UEM- Co1- (Table 2) and in C0 of UEM-Co2 (Table 3). The use of this index
was also effective in popcorn breeding of the germplasm studied by Vilarinho et al. (2003), Santos et al. (2007), Freitas Júnior et al. (2009), Amaral Júnior et al. (2010), Rangel et al. (2011), Ribeiro et al. (2012) and Freitas et al. (2014).
For the index of Subandi et al. (1973), the genetic gains estimated for composite UEM-Co1 in cycles C0 to C3 for GY
ranged from 5.6% to 11.7%, and from 1.6% to 6 9% for PE. For UEM-Co2, genetic gains between 5.2% and 14.7% were estimated for GY and from 1.6% to 12.7% for PE (Tables 2 and 3).
Table 3. Genetic gains estimated by selection indices and truncation selection for grain yield (GY) and popping expansion (PE) in four
cycles of the composite UEM-Co2 with yellow popcorn grain
Selection indices and truncation selection †
Estimated genetic gains
C0 C1 C2 C3
GY PE GY PE GY PE GY PE
Truncada para GY 14.1 2.7 6.7 4.2 16.5 2.4 8.0 -0.1
Truncada para PE 0.2 18.2 0.2 13.6 1.4 8.6 -0.1 2.3
SHCVg 14.1 2.4 6.7 4.6 16.5 2.4 7.8 -0.5
SH350.1 4.0 16.3 0.9 13.5 11.5 7.3 4.2 2.1
SH1.1 14.1 2.4 6.7 4.6 16.5 2.4 7.8 -0.5
WCVg 14.1 3.0 6.7 4.2 16.5 2.4 8.0 0.2
W350.1 4.0 16.3 2.4 13.0 10.3 7.6 3.7 2.2
W1.1 14.1 3.0 6.7 4.2 16.5 2.4 8.0 0.2
MMCVg 10.0 12.4 4.6 10.9 14.2 6.0 7.1 1.4
MM350.1 0.9 16.4 0.2 13.6 8.2 4.1 -0.1 2.3
MM1.1 10.7 11.9 5.1 9.7 12.9 6.5 5.5 1.8
CunnCVg 11.8 10.6 5.7 9.3 15.8 4.3 8.0 0.6
Cunn350.1 0.6 16.4 -0.4 13.4 4.1 8.2 2.3 2.3
Cunn1.1 12.8 9.1 6.1 7.9 14.7 5.8 7.8 1.0
TallisCVg 11.3 11.4 5.9 8.6 12.8 6.9 5.0 2.0
Tallis350.1 11.3 11.4 5.9 8.6 12.8 6.9 5.0 2.0
Tallis1.1 11.3 11.4 5.9 8.6 12.8 6.9 5.0 2.0
PB1-DPG 11.3 11.4 5.9 8.6 12.3 6.9 5.0 2.0
Sub 10.1 12.7 5.2 10.1 14.7 5.8 6.7 1.6
†SH
CVg, SH350,1, SH1,1: indices based on Smith (1936) and Hazel (1943); WCVg, W350,1, W1,1: indices of Williams (1962); MMCVg,MM350,1, MM1,1: indices based on the sum of
271
Crop Breeding and Applied Biotechnology -
17: 266-272, 2017
In an analysis of the results of all selection cycles (Table 1), different conditions of genetic variability and heritability were noted, which allowed an estimation of genetic gains by selection indices and thereafter the application of the new statistical value C
i. The Ci values for the different indices are listed in Table 4. For both composites, the lowest Ci values were observed for the methodology proposed by Subandi (UEM-Co1 2.16 and UEM-Co2 2.78). The second highest index was that of Mulamba and Mock, when using CVg as economic weight, with C
i values of 2.40 and 2.90 for UEM-Co1 and UEM-Co2, respectively. These C
i values, derived from the mean of composites and cycles, suggest good results in the estimation of high and balanced genetic gains for both PE and GY by the indices of Subandi and of Mulamba and Mock (Table 4), suggesting that these would improve the selection responses, in magnitude as well as in the balance between the two traits, and are therefore recommended for popcorn breeding. Among the multiplicative and restrictive indices, the indices of Subandi (multiplicative) and Tallis (restricted) achieved good results and allowed favorable genetic gain estimates for GY and PE in popcorn.
The use of the statistical value C
i eliminates the subjectivity of choice of the best indices, because this statistical value, genetic gain estimated by an index for many traits, are easily summarized in a single C
i value, based on the improvement possibilities of the study population. This study is a non- exhaustive comparison of efficiency of selection indices in popcorn. In this context, other complementary studies are suggested, to address other crops and traits, testing the C
i value as a tool in new combinations of economic weights and selection indices that allow greater genetic progress.
CONCLUSIONS
The selection indices were effective to estimate the genetic gains of half-sib families, indicating that their application can lead to high and balanced genetic gains.
According to the statistical value C
i, the index of Subandi, followed by that of Mulamba and Mock, estimated high and better balanced genetic gains for grain yield and popping expansion.
Table 4. Statistical value C
i calculated to compare the genetic gains estimated by selection indices in two popcorn populations
Indices
C
i †
Mean
UEM-Co1 UEM-Co2
GY-PE GY-PE
SHCVg 12.33 13.78 13.05
SH350.1 7.57 7.99 7.78
SH1.1 12.33 13.78 13.05
WCVg 9.36 12.79 11.07
W350.1 6.77 7.49 7.13
W1.1 9.36 12.79 11.07
MMCVg 2.40 2.90 2.65
MM350.1 17.28 16.79 17.03
MM1.1 2.73 3.34 3.03
CunnCVg 5.48 4.25 4.86
Cunn350.1 13.57 17.01 15.29
Cunn1.1 3.72 4.48 4.10
TallisCVg 2.53 3.68 3.10
Tallis350.1 2.53 3.68 3.10
Tallis1.1 2.53 3.68 3.10
PB1-DPG 2.66 3.80 3.23
Sub 2.16 2.78 2.47
† Low C
i values indicate that the selection indices estimate high and consistent genetic gains for traits GY and PE.
REFERENCES
Amaral Júnior AT, Freitas Júnior SP, Rangel RM, Pena GF, Ribeiro RM, Morais RC and Schuelter AR (2010) Improvement of a popcorn population using selection indexes from a fourth cycle of recurrent
selection program carried out in two different environments.
Genetics and Molecular Research9: 340-347.
Carvalho GF (2013) UENF 14: a new popcorn cultivar. Crop Breeding and Applied Biotechnology 13: 218-218.
Broccoli AM and Burak R (2004) Effect of genotype x environment interactions in popcorn maize yield and grain quality. Spanish Journal of Agricultural Research 2: 85-91.
Carpentieri-Pípolo V, Takahashi HW, Endo RM, Petek MR and Seifert AL (2002) Correlações entre caracteres quantitativos em milho-pipoca.
Horticultura Brasileira 20: 551-554.
Coimbra RR, Miranda GV, Viana JMS, Cruz CD, Murakami DM, Souza LV and Fidelis RR (2002) Estimation of genetic parameters and prediction of gains for DFT1-Ribeirão popcorn population. Crop Breeding and Applied Biotechnology2: 33-38.
Cruz CD (2013) GENES - A software package for analysis in experimental statistics and quantitative genetics. Acta Scientiarum 35: 271-276. Cunningham EP, Moen RA and Gjedrem T (1970) Restriction of selection
indexes. Biometrics26: 67-74.
Daros M, Amaral Júnior AT, Pereira MG, Santos FS, Gabriel APC, Scapim CA, Freitas Júnior SP and Silvério L (2004a) Recurrent selection in inbred popcorn families. Scientia Agricola61: 609-614.
Daros M, Amaral Júnior AT, Pereira MG, Santos FS, Scapim CA, Freitas Júnior SP, Daher RF and Ávila MR (2004b) Correlações entre caracteres agronômicos em dois ciclos de seleção recorrente em milho-pipoca.
Ciência Rural34: 1389-1394.
Faria VR, Viana JMS, Sobreira FM and Silva AC (2008) Seleção recorrente recíproca na obtenção de híbridos interpopulacionais de milho-pipoca. Pesquisa Agropecuária Brasileira 43: 1749-1755.
Freitas ILJ, Amaral Júnior AT, Viana AP, Pena GF, Cabral PDC, Vitorazzi C and Silva TRC (2013) Ganho genético avaliado com índices de seleção via REML/Blup no milho-pipoca UENF 14. Pesquisa Agropecuária Brasileira 48: 1464-1471.
Freitas ILJ, Amaral Júnior AT, Freitas Júnior SP, Cabral PDS, Ribeiro RM and Gonçalves LSA (2014) Genetic gains in the UENF-14 popcorn population with recurrent selection. Genetics and Molecular Research 13: 518-527.
Freitas Júnior SP, Amaral Júnior AT, Rangel RM and Viana AP (2009) Predição de ganhos genéticos na população de milho-pipoca UNB-2U sob seleção recorrente utilizando-se diferentes índices de seleção.
Revista Semina30: 803-814.
Granate MJ, Cruz CD and Pacheco CAP (2002) Predição de ganho genético com diferentes índices de seleção no milho-pipoca CMS-43. Pesquisa Agropecuária Brasileira 37: 101-108.
Hazel LN (1943) The genetic basis for constructing selection indexes.
Genetics 28: 476-490.
Mulamba NN and Mock JJ (1978) Improvement of yield potential of the Eto Blanco maize (Zea mays L.) population by breeding for plant traits.
Egypt Journal of Genetics and Cytology7: 40-51.
Pacheco CAP, Gama EEG, Guimarães PEO, Santos MX and Ferreira AS (1998) Estimativas de parâmetros genéticos nas populações
CMS-42 e CMS-43 de milho pipoca. Pesquisa Agropecuária Brasileira 33: 1995-2001.
Paterniani E (1967) Selection among and within half-sib families in a Brazilian population of maize (Zea mays L.). Crop Science7: 212-216.
Pesek J and Baker RJ (1969) Desired improvement in relation to selected indices. Canadian Journal of Plant Science 49: 803-804.
Rangel RM, Amaral Júnior AT, Gonçalves LSA, Freitas Júnior SP and Candido LS (2011) Análise biométrica de ganhos por seleção em população de milho-pipoca de quinto ciclo de seleção recorrente. Revista Ciência Agronômica42: 473-481.
Ribeiro RM, Amaral Júnior AT, Gonçalves LSA, Candido LS, Silva TR and Pena GF (2012) Genetic progress in the UNB-2U population of popcorn under recurrent selection in Rio de Janeiro. Genetics and
Molecular Research 11: 1417-1423.
Ribeiro RM, Amaral Júnior AT, Pena GF, Vivas M, Kurosawa RN and Gonçalves LSA (2016) Effect of recurrent selection on the variability of the UENF-14 popcorn population. Crop Breeding and Applied Biotechnology16: 123-131.
Santos FS, Amaral Júnior AT, Freitas Júnior SP, Rangel RM and Pereira MG (2007) Predição de ganhos genéticos por índices de seleção na população de milho-pipoca UNB-2U sob seleção recorrente.
Bragantia66: 389-396.
Santos FS, Amaral Júnior AT, Freitas Júnior SP, Rangel RM, Scapim CA and Mora F (2008) Genetic gain prediction of the third recurrent selection cycle in a popcorn population. Acta Scientiarum Agronomy
30: 651-655.
Sawazaki E, Castro JL, Gallo PB, Paterniani MEAGZ, Silva RM and Luder RR (2003) Potencial de híbridos temperados de milho pipoca em cruzamentos com o testador semitropical IAC 12. Revista Brasileira de Milho e Sorgo 2: 61-70.
Silva ES, Silva PSL, Nunes GHS and Silva KMB (2001) Estimação de parâmetros genéticos no composto de milho ESAM-1. Caatinga
12: 43-52.
Smith HF (1936) A discriminant function for plant selection. Annals of Eugenics 7: 240-250.
Subandi W, Compton A and Emeig LT (1973) Comparison of the efficiencies of selection indices for three traits in two variety crosses of corn.
Crop Science13: 184-186.
Tallis GM (1962) A selection index for optimum genotype. Biometrics 22: 120-122.
Vilarinho AA, Viana JMS, Santos JF and Câmara TMM (2003) Eficiência da seleção de progênies S1 e S2 de milho-pipoca, visando à produção de linhagens. Bragantia 62: 9-17.
Williams JS (1962) The evaluation of a selection index. Biometrics18:
375-393.
Zinsly JR and Machado JA (1987) Milho-pipoca. In Paterniani E and Viégas GP (eds) Melhoramento e produção do milho. Editora Fundação