http://www.uem.br/acta ISSN printed: 1806-2636 ISSN on-line: 1807-8672
Doi: 10.4025/actascianimsci.v35i4.19807
Direct and indirect effects of measures and reasons morphometric
on the body yield of Nile tilapia,
Oreochromis niloticus
Carlos Cicinato Vieira Melo1*, Rafael Vilhena Reis Neto1, Adriano Carvalho Costa1, Rilke Tadeu Fonseca de Freitas1, Thiago Archangelo Freato2 and Ulisses Nascimento de Souza1
1
Universidade Federal de Lavras, Cx. Postal 3037, 37200-000, Lavras, Minas Gerais, Brazil. 2Empresa de Pesquisa Agropecuária de Minas Gerais, Belo Horizonte, Minas Gerais, Brazil. *Author for correspondence. E-mail: [email protected]
ABSTRACT. The study was carried out with the objective of verifying which measures and morphometric ratios are more directly related to the body yield of Nile tilapia, Oreochromis niloticus, in two weight classes. Data were analyzed from 257 specimens of tilapia divided into two weight classes: p1 = 400 to 599 g and p2 = 600 to 900 g. The morphometric measurements standard length (SL), head length (HL), body height (BH) and body width (BW), and the ratios of these measures (HL / SL, BH / SL, BW / SL, HL / BH, BW / BH, BW / HL) were evaluated. The following body yields were calculated: carcass (RCAR), fillet (RFILE) and head (RCAB). The data were initially submitted to the "stepwise" procedure to eliminate problems of multicollinearity among the morphometric variables, then the correlations between the dependent variables (body yield) and the independent variables (measured and morphometric relationships) were calculated. Later, these correlations were divided into direct and indirect effects through path analysis, and the direct and indirect contributions of each variable measured in percentage terms. The morphometric ratio BW/HL, for both weight classes, was the variable most highly correlated and with the highest direct effect on RFILE and RCAB, showing to be the most important morphometric variable studied for tilapia carcass trait determination.
Keywords: path analysis, evaluation of carcass, animal breeding, morphometry, Oreochromis niloticus.
Efeitos diretos e indiretos de medidas morfométricas e razões sobre o rendimento do corpo
de tilápia do Nilo,
Oreochromis niloticus
RESUMO. O estudo foi realizado com o objetivo de verificar quais medidas e razões morfométricas estão mais diretamente relacionadas com os rendimentos corporais da tilápia do Nilo, Oreochromis niloticus, em duas classes de peso. Foram analisados os dados de 257 exemplares de tilápia divididos em duas categorias de peso: p1 = 400 a 599 g e p2 = 600 a 900 g. As medidas morfométricas comprimento padrão (CP), comprimento da cabeça (CC), altura do corpo (AC) e largura do corpo (LC), e as razões entre estas medidas (CC / CP, AC / CP, LC / CP, LC / CC, LC / AC, CC / AC) foram avaliadas. Os rendimentos corporais calculados foram: carcaça (RCAR), filé (RFILE) e cabeça (RCAB). Os dados foram inicialmente submetidos ao procedimento ‘stepwise’ para eliminar os problemas de multicolinearidade entre as variáveis morfométricas, em seguida, as correlações entre as variáveis dependentes (rendimentos corporais) e as variáveis independentes (medidas e razões morfométrica) foram calculados. Posteriormente estas correlações foram desdobradas em efeitos diretos e indiretos por meio de análise de trilha e as contribuições diretas e indiretas de cada variável foram quantificadas percentualmente. A razão morfométrica LC / CC, para ambas as classes de peso, foi a variável mais altamente correlacionada e com o maior efeito direto sobre RFILE e RCAB, mostrando ser a variável morfométrica estudada mais importante para determinação das características de carcaça da tilápia.
Palavras-chave: análise de trilha, avaliação de carcaça, reprodução animal, morfometria, Oreochromis niloticus.
Introduction
The Nile tilapia Oreochromis niloticus is one of the main species cultivated commercially due to its good growth, its great potential for intensive fish farming, adaptation to different climates, tolerance to different
appreciated by the market, primarily as a result of its white color, lack of intramuscular bones and great texture and flavor (BRUMMETT et al., 2004)
The fillet is the presentation of the final product that is most marketed by the fish processing industry, especially when compared to the gutted whole fish or as a main trunk (without head, fins, skin and viscera) (SOUZA et al., 2000). In general,
Oreochromis sp. has a lower fillet yield when compared to other species (TURRA et al., 2012). According to the authors Freato et al. (2005), Burkert et al. (2008) and Grigorakis et al. (2011), fusiform fish such as Brycon. orbignyanus (44.97%),
Pseudoplatystoma sp. (47.79%), and Argyrosomus regius (42.2%), respectively, have relatively high yields, exceeding values found for Silva et al. (2009) (34.18 %) working with tilapia.
Breeding programmes that are aimed at body yield increase present difficulties, since the direct measurement results in sacrifice of the animal and hence in the loss of a potential breeder within the group (CREPALDI et al., 2008; RUTTEN et al., 2004). Thus, an alternative would be the use of body measurements as selection criteria mainly related to the carcass and fillet (SILVA et al., 2009; PONZONI et al., 2007). According Freato et al. (2005), information about the external shape of the fish's body (morphometry) is important to allow an estimation of productivity by reducing costs and increasing profits for both the farmer and for the fish industry itself.
The correlation between the measurements and morphometric ratios with body-associated proceeds was found in several studies (FREATO et al., 2005; DIODATTI et al., 2008; NETO et al., 2012). However, the simple correlation only allows an assessment of the magnitude and direction of the association between the two characters, without providing the necessary information relating to direct and indirect effects of a group of characters in relation to a dependent variable of the greatest importance (LOPES; FRANKE, 2011).
Path analysis is an artifice that researchers have to breack the correlation between direct and indirect effects (CRUZ; CARNEIRO, 2003) through a basic variable, such as body yields, and the explanatory variables, such as morphometric measures and ratios, enabling a better understanding of the causes involved in the associations between these traits (NETO et al., 2012).
The present study aimed to evaluate, through path analysis of phenotypic correlations, which
morphometric variables were more directly related to the body yield of Nile tilapia (O. niloticus) in two weight classes.
Material and methods
The database used in this study consisted of information on the morphometric measurements, body weights and slaughter yields, of 257 Nile tilapia, male, with a mean weight of 580.41 ± 126.7 grams.
According to Neto et al. (2012), the weight of the animals directly influences the coefficients of correlation between yields of the body and measurements and morphometric ratios, the data were organized into two files depending on the weight class, p1 = 400-599 g, and p2 = 600 - 900 g, (Table 1) and that the analyzes were developed, following exactly the same procedures for the two files.
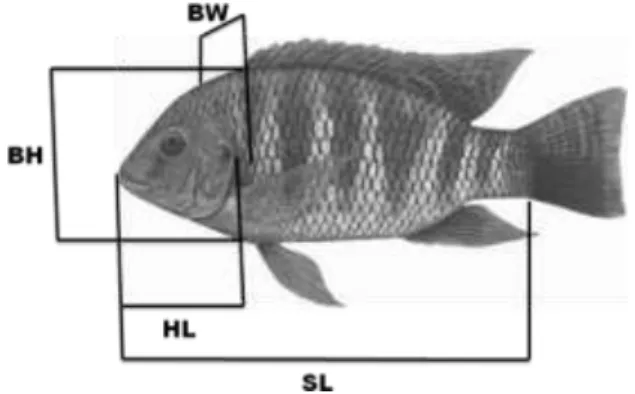
The following morphometric measurements were evaluated (Figure 1): standard length (SL), measured between the front head extremity and the insertion of the tail fin; head length (HL), measured between the upper and lower edges of the head; body height (BH), measured in front of the first ray of the dorsal fin; and body width (BW), measured at the first ray of the dorsal fin. To complement the measurements above, the following morphometric ratios were calculated: HL / SL, BH / SL, BW / SL, BW / HL, BW / BH, HL / BH.
Figure 1. Morphometric measurements of tilapia
To obtain the yields of the body, the animals were eviscerated to weigh the carcass with head (total weight minus the weight of the viscus), and then the skin was removed along with the flakes
use of a filleting knife, the fillets were removed, without the two lateral ribs of the fish that are present longitudinally along the entire length of the spine and ribs, and subsequently weighed.
Body yields of each product were calculated as the percentage of body weight (whole fish): carcass yield (RCAR), carcass weight / slaughter weight, head yield (RCAB), head weight / slaughter weight, and fillet yield (RFILE), fillet weight / body weight.
Because the weight of animals can influence the correlation coefficients between body yield, measurements and morphometric rations, organized our data into two files depending on the weight class, p1 = 400 – 599 g, and p2 = 600 – 900 g, (Table 1), and developed analyses which followed exactly the same procedures for the two files.
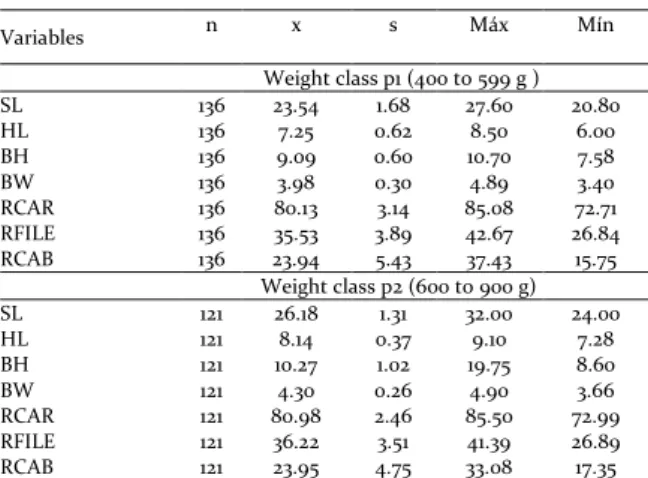
Table 1. Morphometric measures and body yield for each body-weight class of Nile tilapia, Oreochromis niloticus, with number of animals (n), mean (x), standard deviations (s), maximum (Max) and minimum (Min).
Variables n x s Máx Mín
Weight class p1 (400 to 599 g )
SL 136 23.54 1.68 27.60 20.80
HL 136 7.25 0.62 8.50 6.00
BH 136 9.09 0.60 10.70 7.58
BW 136 3.98 0.30 4.89 3.40
RCAR 136 80.13 3.14 85.08 72.71
RFILE 136 35.53 3.89 42.67 26.84
RCAB 136 23.94 5.43 37.43 15.75
Weight class p2 (600 to 900 g)
SL 121 26.18 1.31 32.00 24.00
HL 121 8.14 0.37 9.10 7.28
BH 121 10.27 1.02 19.75 8.60
BW 121 4.30 0.26 4.90 3.66
RCAR 121 80.98 2.46 85.50 72.99
RFILE 121 36.22 3.51 41.39 26.89
RCAB 121 23.95 4.75 33.08 17.35
SL: standard length; HL: head length; BH: body height; BW: body width, RCAR: carcass yield; RFILE: fillet yield; RCAB: head yield; n: number of animals; x: mean; s: standard deviations; Max: maximum data value, Min: minimum data value.
For this study, body incomes were considered as dependent variables, whereas measures and morphometric ratios were considered as independent variables.
Initially, a multiple linear regression analysis was done using the stepwise procedure. In order to eliminate possible problems, multicollinearity and the Akaike information criterion (AIC) were used to define the independent variables included in the path analysis of each dependent variable in the study (COIMBRA et al., 2005; CHARNET, et al., 2008). This is necessary because the estimated path coefficients (direct and indirect effects) are obtained by regression equations, i.e. from the solution of the equation ; therefore, it is necessary to obtain the direct effects, ensuring that the matrix X is well conditioned, as
multicollinearity problems can cause it to be unique, resulting in unreliability of the least squares estimates (CRUZ; CARNEIRO, 2003).
Having established the independent variables for each dependent variable, we proceeded to
identify, by Cook’s Distance, and disposal of
influential points. Soon after, the correlations between the independent and dependent variables were calculated using Pearson’s linear correlation coefficient and, subsequently, we applied the ‘student’ test to assess the significance of the correlations (CHARNET et al., 2008). Then, the correlations were deployed in direct and indirect effects through path analysis (CRUZ; CARNEIRO, 2003) and the direct and indirect contributions of each variable were quantified in percentages (NETO et al. 2012). Statistical analyses were performed using the
software ‘R’ version 2.13.2 for Windows.
To interpret the results, the criteria adopted by Neto et al. (2012) (adapted from LOURES et al., 2001) were considered, with four possible situations: a) a particular independent variable (x) shows a significant correlation and high direct effect with the dependent variable (y), indicating that by determining variation in y; b) the independent variable has a significant and direct
effect on ‘y low’, indicating that their effects
mainly occur indirectly through other variables, and an analysis with other independent variables can result in great benefits for effect estimates, but should not be used in isolation; c) the variable (x) has no significant correlation with y, but its direct effect is high, indicating that its use is of little utility in the determination of the effects of independent variables on y; d) the independent variable has low values of both the direct effect and correlation with y, indicating it to be of little use to the estimates.
Results and discussion
fillet of tilapia. Contradictory results were obtained by Diodatti et al. (2008) when working with tilapia which had coefficients of determination adjusted for very low income prediction equations in terms of body measurements and morphometric ratios.
Table 2. Morphometric variables included in the analysis models to track body income tilapia in two weight classes, and their adjusted coefficients of determination (r2).
Yields body Morphometric Variables R2 aj.
Weight class p1 (400 to 599 g )
RCAR SL,HL,BH,BW, HL / SL,BW / SL,BW / BH,HL / BH 0.67
RCAB HL,BH,BW,BH / SL,BW / SL,BW / HL 0.74
RFILE BH,BH / SL,BW / SL,BW / HL,HL / BH 0.74
Weight class p2 (600 to 900 g)
RCAR SL,HL,BW,BH / SL,BW / HL,BW / BH,HL / BH 0.22
RCAB SL,HL,BH,BW / HL,HL/BH 0.70
RFILE SL,HL, BH/SL,BW/HL,HL/BH 0.62
SL: standard length; HL: head length; BH: body height; BW: body width; RCAR: carcass yield; RFILE: fillet yield; RCAB: head yield.
The correlations between measurements and morphometric ratios with carcass yield (RCAR) were higher in fish slaughtered in class p1 (Table 3), with the highest values observed for standard length (-0.65) and head length (-0.40). The direct effect of SL accounted 63.04% of its correlation with RCAR since HL, with the second highest correlation coefficient, showed a large percentage of indirect effects (60.56%) in their correlation, mainly by SL (Table 4). These results reaffirm the importance of standard length in identifying animals with better carcass tilapia weighing between 400 and 600 g, indicating that fish with lower standard lengths in this weight range have a higher carcass yield.
Table 3. Amounts and percentages of direct and indirect effects of the morphometric measures and ratios on the carcass yield of Nile tilapia Oreochromis niloticus in different weight class.
Variables Direct Indirect Correlation
Effect % Effect %
Weight class p1 (400 to 599 g )
SL -1,571 63.04 0.921 36.96 -0.65 **
HL 0.746 39.44 -1.146 60.56 -0.40 **
BH -0.368 90.54 0.038 9.46 -0.33 **
BW 0.603 40.31 -0.893 59.69 -0.29 **
HL / SL 0.183 88.55 -0.023 11.45 0.16 ns
BH / SL -0.824 41.04 1.184 58.96 0.36 **
BW / BH -0.733 50.00 0.733 50.00 0.00 ns
HL / BH -0.362 79.68 0.092 20.32 -0.27 **
Weight class p2 (600 to 900 g)
SL -0.469 62.67 0.279 37.33 -0.19 ns
HL 0.553 56.65 -0.423 43.35 0.13 ns
BW -0.172 75.13 -0.057 24.87 -0.23 ns
BH / SL -0.194 31.41 0.424 68.59 0.23 ns
BW / HL 0.309 46.97 -0.349 53.03 -0.04 ns
BW / BH -0.162 58.07 -0.117 41.93 -0.28 *
HL / BH -0.193 44.27 0.243 55.73 0.05 ns
SL: standard length; HL: head length; BH: body height; BW: body width. *(p = 0.05); **(p = 0.01); ns (not significant).
For class weight p2, the ratio BW/BH is the only variable morphometric with significant correlation with the RCAR; however, this is low and negative (-0.28) and, furthermore, the direct effect of BW/BH was accountable for less than 60% of this correlation, primarily due to indirect effect via BW (-0.122) (Table 3 and Table 4). Correlation coefficients were low compared to those for fish weight class p1, indicating that the morphometric variables studied contribute very little to the variation in heavier tilapia carcasses. This implies that there may be one or more morphometric variables not measured in this study, requiring evaluation for their effects on RCAR.
Diodatti et al. (2008), working with some tilapia strains, found a significant correlation coefficient between morphometric measurements and carcass yield measured at the point of insertion of the anal fin. Moreover, Freato et al. (2005) reported that the height of the body, making the insertion of the pectoral fin was the most important measure for determining the yield of the carcass of Brycon orbignyanus. In round fish such as pacu (Piaractus mesopotamicus) and tambaqui (Colossoma macropomum), Neto et al. (2012) noted, in a study in path analysis, the ratio of the length of head and body height can be used in the assessment of RCAR. The ratio of the width of the body by head length (BW / HL) had the highest correlation coefficients, -0.75 and -0.82 (Table 5), respectively, in classes p1 and p2 with the head yield (RCAB). Besides high correlation with RCAB, BW / HL also showed high percentages of direct effects, both in class p1 (83.14%) and p2 (84.24%), with the path coefficients of 0.624 (Class p1) and -0.691 (Class p2) proving to be a key variable yield for the body (Tables 5 and 6). This indicates those tilapias which are wider at the head and dorsal region and of shorter length will result in a lower yield of fish head.
Such information is quite significant to the industry, especially since the head is considered a residue of fish processing and, therefore, of no economic value.
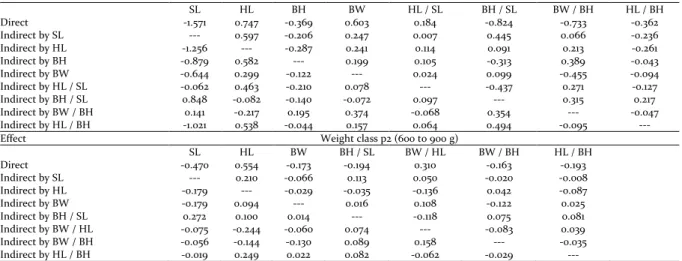
Table 4. Estimates of the direct and indirect effects, obtained by path analysis, between morphometric measurements and ratios and carcass yield of Nile tilapia, Oreochromis niloticus, in different weight classes.
SL HL BH BW HL / SL BH / SL BW / BH HL / BH
Direct -1.571 0.747 -0.369 0.603 0.184 -0.824 -0.733 -0.362
Indirect by SL --- 0.597 -0.206 0.247 0.007 0.445 0.066 -0.236
Indirect by HL -1.256 --- -0.287 0.241 0.114 0.091 0.213 -0.261
Indirect by BH -0.879 0.582 --- 0.199 0.105 -0.313 0.389 -0.043
Indirect by BW -0.644 0.299 -0.122 --- 0.024 0.099 -0.455 -0.094
Indirect by HL / SL -0.062 0.463 -0.210 0.078 --- -0.437 0.271 -0.127
Indirect by BH / SL 0.848 -0.082 -0.140 -0.072 0.097 --- 0.315 0.217
Indirect by BW / BH 0.141 -0.217 0.195 0.374 -0.068 0.354 --- -0.047
Indirect by HL / BH -1.021 0.538 -0.044 0.157 0.064 0.494 -0.095 ---
Effect Weight class p2 (600 to 900 g)
SL HL BW BH / SL BW / HL BW / BH HL / BH
Direct -0.470 0.554 -0.173 -0.194 0.310 -0.163 -0.193
Indirect by SL --- 0.210 -0.066 0.113 0.050 -0.020 -0.008
Indirect by HL -0.179 --- -0.029 -0.035 -0.136 0.042 -0.087
Indirect by BW -0.179 0.094 --- 0.016 0.108 -0.122 0.025
Indirect by BH / SL 0.272 0.100 0.014 --- -0.118 0.075 0.081
Indirect by BW / HL -0.075 -0.244 -0.060 0.074 --- -0.083 0.039
Indirect by BW / BH -0.056 -0.144 -0.130 0.089 0.158 --- -0.035
Indirect by HL / BH -0.019 0.249 0.022 0.082 -0.062 -0.029 ---
SL: standard length; HL: head length; BH: body height; BW: body width.
Furthermore, this ratio could be an important morphometric value, after a study evaluating genetic improvement programs for tilapia as an indirect selection criterion aiming fish with lower head yield.
Diodatti et al. (2008), working with RCAB tilapia, found the highest correlation coefficient (-0.481) for the width and length standard differed from the results of this work. Freato et al. (2005) and Neto et al. (2012) observed in piracanjuba round fish that the morphometric ratio, HL / SL is the most important, and the greater this ratio, the higher the yield of head.
Table 5. Amounts and percentages of direct and indirect effects of the morphometric measures and ratios on the head yield of Nile tilapia Oreochromis niloticus in different weight class.
Variables Direct Indirect Correlation
Effect % Effect %
Weight class p1 (400 to 599 g )
HL 0.345 75.06 0.114 24.94 0.46 **
BH 1.078 63.94 -0.608 36.06 0.47 **
BW -1.329 46.50 1.529 53.50 0.20 *
BH / SL -0.977 40.14 1.457 59.86 0.48 **
BW / SL 1.776 52.98 -1.576 47.02 0.20 *
BW / HL -0.623 83.14 -0.126 16.86 -0.75 **
Weight class p2 (600 to 900 g)
SL -0.107 71.85 -0.042 28.15 -0.15 ns
HL -0.430 31.86 0.920 68.14 0.49 **
BH 0.652 72.89 -0.242 27.11 0.41 **
BW / HL -0.690 84.24 -0.129 15.76 -0.82 **
HL / BH 0.489 58.34 -0.349 41.66 0.14 ns
SL: standard length; HL: head length; BH: body height; BW: body width. *(p = 0.05); **(p = 0.01); ns (not significant).
Table 6. Estimates of the direct and indirect effects, obtained by path analysis, between morphometric measurements and ratios and head yield of Nile tilapia, Oreochromis niloticus, in different weight classes.
Effect Weight class p1 (400 to 599 g )
HL BH BW BH / SL BW / SL BW/HL Direct 0.345 1.078 -1.329 -0.978 1.776 -0.624 Indirect by HL --- 0.819 -0.518 0.108 -0.693 0.399 Indirect by BH 0.262 --- -0.399 -0.401 -0.426 0.355
Indirect by BW 0.135 0.323 --- 0.166 0.924 -0.019 Indirect by BH / SL -0.038 0.442 0.226 --- 0.622 0.206 Indirect by BW / SL -0.135 -0.259 -0.691 -0.342 --- -0.150 Indirect by BW / HL -0.221 -0.615 -0.040 0.323 0.426 ---
Effect Weight class p2 (600 to 900 g)
SL HL BH BW / HL HL / BH
Direct -0.108 -0.430 0.653 -0.691 0.490
Indirect by SL --- -0.146 0.189 -0.124 0.039 Indirect by HL -0.037 --- 0.392 0.311 0.255 Indirect by BH -0.031 -0.258 --- 0.228 -0.181 Indirect by BW / HL -0.019 0.194 -0.215 --- -0.088 Indirect by HL / BH -0.009 -0.224 -0.241 0.124 ---
SL: standard length; HL: head length; BH: body height; BW: body width.
The fillet yield also had the highest correlation coefficients with the ratio BW / HL, being 0.74 and 0.78 in the p1 class in class p2, respectively (Table 7), and the percentages of the direct effects of this variable were also high with RFILE in both class p1 (77.63%) and class p2 (95.78%) (Table 7). Other variables might be important for class P1, such as the height of the body (BH) and the ratio BH / SL, which showed significant correlation coefficients of -0.5 to RFILE; however, the percentages under the direct effects were primarily due the indirect effects via BW / HL (0.069 to 0.094 BH and BH / SL) (Tables 7 and 8), confirming the importance of body length and the width ratio of the head to determine the fillet yield.
Table 7. Amounts and percentages of direct and indirect effects of the morphometric measures and ratios on the fillet yield of Nile tilapia Oreochromis niloticus in different weight class.
Variables Direct Indirect Correlation
Effect % Effect %
Weight class p1 (400 to 599 g )
BH -0.122 24.58 -0.377 75.42 -0.50**
BH / SL -0.284 56.97 -0.215 43.03 -0.50**
BW / SL -0.378 71.80 0.148 28.20 -0.23**
BW / HL 0.574 77.63 0.165 22.37 0.74 **
HL / BH -0.249 73.59 0.089 26.41 -0.16 ns
Weight class p2 (600 to 900 g)
SL 0.587 58.46 -0.417 41.54 0.17 ns
HL -0.590 73.73 0.210 26.27 -0.38 **
BH / SL 0.570 37.50 -0.950 62.50 -0.38 **
HL / BH 0.492 43.39 -0.642 56.61 -0.15 ns
SL: standard length; HL: head length; BH: body height; BW: body width. *(p = 0.05); **(p = 0.01); ns (not significant).
Generally, the variable morphometric BW / HL was the most determining factor for the variation of yield and fillet head; however, the correlations are given in opposite directions, namely wider and shorter heads have higher yields of fillet and lower yields of head and, therefore, are more desirable.
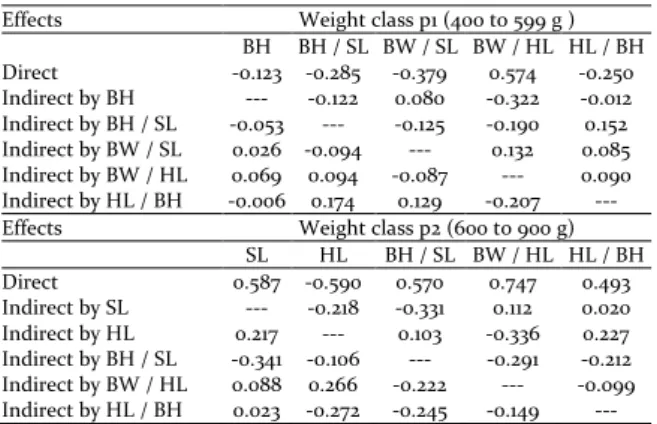
Table 8. Estimates of the direct and indirect effects, obtained by path analysis, between morphometric measurements and ratios and fillet yield of Nile tilapia, Oreochromis niloticus, in different weight classes.
Effects Weight class p1 (400 to 599 g )
BH BH / SL BW / SL BW / HL HL / BH
Direct -0.123 -0.285 -0.379 0.574 -0.250
Indirect by BH --- -0.122 0.080 -0.322 -0.012
Indirect by BH / SL -0.053 --- -0.125 -0.190 0.152 Indirect by BW / SL 0.026 -0.094 --- 0.132 0.085 Indirect by BW / HL 0.069 0.094 -0.087 --- 0.090 Indirect by HL / BH -0.006 0.174 0.129 -0.207 ---
Effects Weight class p2 (600 to 900 g)
SL HL BH / SL BW / HL HL / BH
Direct 0.587 -0.590 0.570 0.747 0.493
Indirect by SL --- -0.218 -0.331 0.112 0.020
Indirect by HL 0.217 --- 0.103 -0.336 0.227
Indirect by BH / SL -0.341 -0.106 --- -0.291 -0.212 Indirect by BW / HL 0.088 0.266 -0.222 --- -0.099 Indirect by HL / BH 0.023 -0.272 -0.245 -0.149 ---
SL: standard length; HL: head length; BH: body height; BW: body width.
Freato et al. (2005), working with piracanjuba
Brycon orbignyanus reported that fusiform fish , in other words, longer and plump, have higher incomes and housing fillet.
Results similar to the present study were observed by Neto et al. (2012), who evaluated round fish, in which morphometric ration BW / HL showed high correlation coefficients and high percentages of direct effect on the prime yield body (rib, fillet and fillet with rib), in other words, the wider and shorter the length of the fish heads, the better its carcass characteristics are.
The morphometric measurements and ratios could be used for assessing body yields of Nile tilapia and, therefore, should be subjected to character studies that provide genetic information necessary for these variables to be applied in breeding programs aimed at optimizing the carcass characteristics of this fish.
Conclusion
The ratio between the width and length of the body is the head morphometric most important variable for determining carcass characteristics of Nile tilapia, because it is strongly associated with head and fillet yield. Regardless of weight class evaluated.
Acknowledgements
The authors are grateful for the support from Federal University of Lavras – Minas Gerais State and the Center for Research of Experimental Farm – EPAMIG.
References
AYALA-PEREZ, L. A.; RAMOS-MIRANDA, J.; FLORES-HERNANDEZ, D.; VEGA-RODRIGUEZ, B. I.; MORENO-MEDINA, U. C. Biological and ecological characterization of the catfish Cathorops melanopus off the west coast of Campeche, Mexico. Ciências Marinas, v. 34, n. 4, p. 453-465, 2008.
BRUMMETT, R. E.; ANGONI, D. E.; POUOMOGNE, V. On-farm and on-station comparison of wild and domesticated Cameroonian populations of Oreochromis niloticus. Aquaculture, v. 242, n. 1/4, p. 157-164, 2004. BURKERT, D.; ANDRADE, D. R.; SIROL, R. N.; SALARO, A. L.; RASGUIDO, J. E. A.; QUIRINO, J. E. A. Rendimentos do processamento e composição química de filés de surubim cultivado em tanques-rede. Revista Brasileira de Zootecnia, v. 37, n. 7, p. 1137-1143, 2008. CHARNET, R.; BONVINO, H.; CHARNET, E. M. R.; FREIRE, C. A. L. Análise de modelos de regressão linear com aplicações. Campinas: Unicamp, 2008. COIMBRA, J. L. M.; BENIN, G.; VIEIRA, E. A; DE OLIVEIRA, A.C.; CARVALHO, F. I. F.; GUIDOLIN, A. F.; SOARES, A. P. Consequências da multicolinearidade sobre a análise de trilha em canola. Ciência Rural, v. 35, n. 2, p. 347-352, 2005.
CREPALDI, D. V.; TEIXEIRA, E. A.; FARIA, P. M.; RIBEIRO, L. P.; MELO, D. C.; OLIVEIRA, D. A. A.; TURRA, E. M.; QUEIROZET, B. M.; Rendimento de carcaça em surubim (Pseudoplatystoma spp.) avaliado por ultra-som. Revista Brasileira de Saúde e Produção Animal, v. 9, n. 4, p. 813-824, 2008.
CRUZ, C. D.; CARNEIRO, P. C. S. Modelos biométricos aplicados ao melhoramento genético. Viçosa: UFV, 2003.
morfométricos en el rendimiento de los componentes corporales de tilapia del nilo (Oreochromis oreochromis). Anales de Veterinaria de Murcia, v. 24, n. 4, p. 45-55, 2008.
FREATO, T. A.; FREITAS, R. T. F.; SANTOS, V. B.; LOGATO, P. V. R.; VIVEIROS, A. T. M. Efeito do peso de abate nos rendimentos do processamento da piracanjuba (Brycon orbignyanus, Valenciennes, 1849). Ciência e Agrotecnologia, v. 29, n. 3, p. 676-682, 2005.
GRIGORAKIS, K.; FOUNTOULAKI, E.; VASILAKI, A.; MITTAKOS, I.; NATHANAILIDES, C. Lipid quality and filleting yield of reared meagre (Argyrosomus regius). International Journal of Food Science and Technology, v. 46, n. 4, p. 711-716, 2011.
LOPES, R. R.; FRANKE, L. B. Correlação e análise do coeficiente de trilha dos componentes do rendimento de sementes de grama-forquilha. Revista Brasileira Zootecnia, v. 40, n. 5, p. 972-977, 2011.
LOURES, B. T. R. R.; RIBEIRO, R. P.; VARGAS, L.; MOREIRA, H. L. M.; SUSSEL, F. R.; POVH, J. A.; CAVICHIOLO, F. Manejo alimentar de alevinos de tilápia do Nilo, Oreochromis niloticus (L.), associado às variáveis físicas, químicas e biológicas do ambiente. Acta Scientiarum. Animal Sciences, v. 23, n. 4, p. 877-883, 2001.
NETO, R. V. R.; DE FREITAS, R. T. F.; SERAFINI, M. A.; COSTA, A. C.; FREATO, T. A.; ROSA, P. V.; ALLAMAN, I. B. Interrelationships between morphometric variables and rounded fish body yields evaluated by path analysis.Revista Brasileira de Zootecnia, v. 41, n. 7, p. 1576-1582, 2012.
PONZONI, R. W.; KHAW, H. I.; NGUYEN H. N. Investment appraisal of genetic improvement programs in Nile tilapia (Oreochromis niloticus). Aquaculture, v. 269,
n. 1/4, p. 187-199, 2007.
RUTTEN, M. J. M.; BOVENHUIS, H.; KOMEN, H. Modeling fillet traits based on body meansurements in three tilápia strains (Oreochromis niloticus). Aquaculture,
v. 231, n. 1/4, p. 113-122, 2004
SAHU, B. B.; KUMAR, K.; SAHOO, A. K.; KUMAR, R.; MOHANTY, U. L.; SAHOO, N. J. M.; EKNATH, A. E. Carcass characteristics of marketable size striped murrel, Channa striatus (Bloch, 1793). Journal of Applied Ichthyology, v. 28, n. 2, p. 258-260, 2012. SANTOS, V. B.; FREATO, T. A.; FREITAS, R. T. F.; LOGATO, P. V. R. Crescimento relativo e coeficientes alométricos do corpo de linhagens de tilápias do Nilo. Ciência Animal Brasileira, v. 7, n. 4, p. 357-364, 2006. SHIBATTA, O. A.; HOFFMANN, A. C. Geographic variation in Corydoras paleatus (Jenyns) (Siluriformes, Callichthyidae) from southern Brazil. Revista Brasileira de Zoologia, v. 22, n. 2, p. 366-371, 2005. SILVA, F. V.; E SARMENTO, N. L. A. F.; VIEIRA, J. S.; TESSITORE, A. J. A.; OLIVEIRA, L. L. S.; SARAIVA. E. P.
Características morfométricas, rendimentos de carcaça, filé, vísceras e resíduos em tilápias-do-nilo em diferentes faixas de peso. Revista Brasileira
Zootecnia, v. 38,
n. 8, p. 1407-1412, 2009.
SOUZA, M. L. R.; MARENGONI, N. G.; PINTO, A. A.; CAÇADOR,W. C. Rendimento do processamento da tilápia-do-nilo (Oreochromis niloticus): tipos de corte da cabeça em duas categorias de peso. Acta Scientiarum. Animal Sciences, v. 22, n. 1, p. 701-706, 2000.
in Nile tilápia Oreochromis nilaticus. Aquaculture, v. 356, n. 49, p. 381-390, 2012
Received on February 13, 2013. Accepted on March 26, 2013.