Stay-green
character and its contribution in Brazilian wheats
Caráter stay-green e sua contribuição em trigos brasileiros Henrique de Souza Luche1 José Antônio Gonzalez da Silva2 Rafael Nornberg1
Maraisa Crestani Hawerroth3 Solange Ferreira da Silveira Silveira1
Vanderlei da Rosa Caetano4 Rodrigo Lisboa Santos1 Ricardo Garcia Figueiredo1
Luciano Carlos da Maia1 Antônio Costa de Oliveira1*
ISSNe 1678-4596
1Centro de Genômica e Fitomelhoramento (CGF), Faculdade de Agronomia Eliseu Maciel (FAEM), Universidade Federal de Pelotas (UFPel),
96001-970, Pelotas, RS, Brasil. E-mail: acostol@cgfufpel.org. *Corresponding author.
2Departamento de Estudos Agrários, Universidade Regional do Noroeste do Estado do Rio Grande do Sul (UNIJUI), Ijui, RS, Brasil. 3Empresa de Pesquisa Agropecuária e Extensão Rural de Santa Catarina (EPAGRI), Caçador, SC, Brasil.
4Empresa Brasileira de Pesquisa Agropecuária (Embrapa), Embrapa Clima Temperado, Pelotas, RS, Brasil.
ABSTRACT: The stay-green character has been related to greater stress tolerance and yield through longer activity of the photosynthetic apparatus. Association of this character with grain yield may be linked to a network of features other than the grain mass. This study aimed to shed light on the actual contribution of stay-green character in Brazilian wheats and the associations between grain yield components in different environmental conditions. The experiment was conducted in a randomized block design with three replications in the years 2003, 2004 and 2005. Sibling lines with and without the stay-green character were evaluated analyzing the phenotypic correlation and path analysis separately by year and maturity group. Under favorable growing conditions, the contribution of stay-green character in wheat is obtained
by the increased ear fertility and number of grains. In a more restrictive scenario, it favors an increase in grain mass by longer filling time at
the end of the cycle.
Key words: Triticum aestivum,delayed senescence, correlation, path analysis.
RESUMO: O caráter stay-green tem sido relacionado à maior tolerância a estresses e a produtividade pela manutenção mais prolongada do aparato fotossintético. A relação deste caráter com a produtividade de grãos talvez esteja associada a uma rede de características que não somente a massa de grãos. O objetivo do estudo é trazer à luz a real contribuição do caráter stay-green em trigos brasileiros, na relação entre
os caracteres definidores da produtividade de grãos, em diferentes condições de ambiente. O experimento foi conduzido em delineamento experimental de blocos casualizados com três repetições, nos anos de 2003, 2004 e 2005. Foram avaliadas linhagens-irmãs com presença e ausência do caráter stay-green, analisando a correlação fenotípica e trilha separadamente por ano e grupo de maturação. Em condições
favoráveis de cultivo, a contribuição do caráter stay-green em trigo se dá pelo aumento da fertilidade de espiga, incrementando o número de
grãos. Num cenário mais restritivo, favorece a massa de grãos pelo maior tempo de enchimento no final do ciclo.
Palavras-chave: Triticum aestivum, senescência retardada, correlação, análise de trilha.
CROP PRODUCTION
INTRODUCTION
The stay-green trait favors the permanence of a photosynthetically active area, resulting on a
steady grain filling rate. As a consequence, it favors directly the cariopsis mass with reflect on grain
yield (CHEN et al., 2010). In wheat, this trait is suggested to be indirectly associated to other grain yield components, such as the number of fertile tillers and grains per ear (AHLAWAT et al., 2008). A higher contribution of the number of grains per ear and grain mass have been seen for the stay-green trait in ears with regular and scarce rainning conditions, respectively (LUCHE et al., 2013). A positive and high association between tolerance to
high temperatures and delayed maturation has been seen in wheat (KUMARI et al., 2006). In endogamic maize lines, a strong correlation between chlorophyll content and delayed senescence with grain yield, specially under drought, has been seen (MESSMER et al., 2011).Also, stay-green wheat mutants have shown lower levels of free radicals under drought, suggesting a potential impact on the selection for drought tolerance(TIAN et al., 2013).
and interaction factors (BARILI et al., 2011). However, in order to have a better understanding of the associations between traits, not only the values, but the cause and effect relationships are important. Path analysis maximizes the volume of information
obtained from the associations, finding the real
contribution of each character on the expression of the phenotype (VESOHOSKI et al., 2011).
The stay-green trait can contribute to grain yield through different paths affecting yield components, especially under high temperature and/ or rain shortage stresses. Thus, the objective of this study was bring light to the real contribution of the stay-green trait to Brazilian wheats through its effect on grain yield component traits under different environments.
MATERIALS AND METHODS
The experiment was carried out in the
experimental field located in the Municipality of
Capão do Leão, RS, located at 31º 52’ 00’ ‘ latitude south and 52º 21’ 24’’ longitude west, with soil type Red Yellow Argisol (Aridic Kandiustalf). Lines were obtained from crosses between TB438 (stay-green line) and TB188 (normal or synchronized maturation) lines. F1 and backcross generations were obtained and advanced homozygous lines were later selected for higher yield with differences in the stay green trait (stay-green or synchronized). Backcrosses one and two, BC1F1 and BC2F1, respectively, were directed to self-pollination and selected for the presence/ absence of the stay-green trait until reaching a homozygous state. In 2002, 14 stay-green (SG30, SG39, SG47, SG53, SG65, SG71, SG74, RC1SG32, RC2SG34, RC2SG40, RC2SG46, RC2SG54, RC2SG62, RC2SG67), 16 synchronized (SZ31, SZ37 SZ49, SZ57, SZ69, RC1SZ43, RC1SZ45, RC1SZ55, RC1SZ58, RC1SZ68, RC1SZ72, RC1SZ76, RC2SZ35, RC2SZ42, RC2SZ56, RC2SZ61) and the parental genotypes TB 438 and TB188 were developed. Lines showed similarity for cycle and stature, differing regarding the maturation group.
The experimental design used was random blocks with three replications, being the
experimental unit composed of five three meter
long lines spaced by 0.2m, and a seeding scheme of 300 viable seeds m-2. Fertilizer was used according
to recommendations for the wheat crop, for an expected harvest of 2t ha-1. Crop management,
pest and disease control were performed according to technical recommendations. The following agronomic characters were measured: 1. Grain yield
(GY, kg ha-1) by harvesting the central three lines of
each plot and converting it to one hectare; 2. weight of a thousand grains (WTG, in g), from the weighting of 250 grains and multiplying it by four; 3. number of fertile tillers (NFT, in units) from the counting of one linear meter from the central line of each plot. Before harvesting, twenty ears were randomly collected per plot in order to perform the following measurements in the lab: 4. Ear length (EL, in cm); 5. number of fertile spikelets (NFS, counting); 6. ear weight (EW, in g); 7. ear grain weight (EGW, in g); 8. number of grains per ear (NGE, counting) and; 9. Ear harvesting index (EHI, g g-1) calculated by the
ratio between grain weight and ear weight.
The data were subjected to analysis of variance in order to detect the major and interaction effects. Thus, a test comparison of means and
estimative of correlation coefficients in each
maturation group for each season was performed. The obtained correlations were partitioned into direct and indirect effects of variables on the grain yield through path analysis (WRIGHT, 1921). All the procedures were performed with the aid of the Genes Software (CRUZ, 2001).
RESULTS AND DISCUSSION
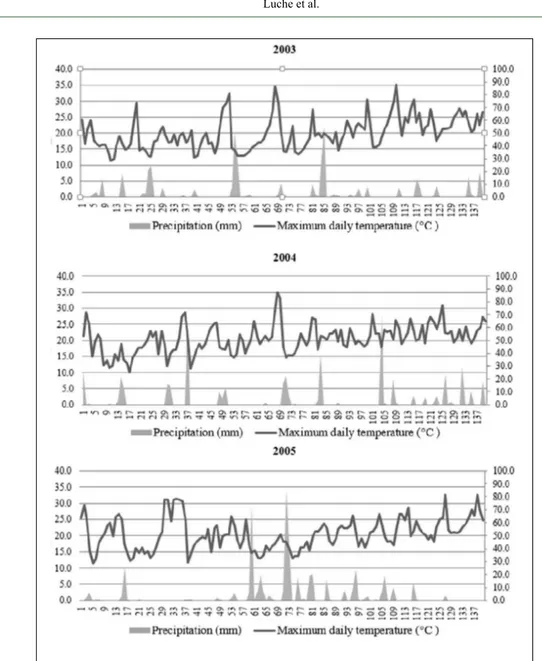
Associations that lead to the increase in GY were variable according with the year of cultivation (Table 1). In 2003, characters associated with GY were observed only in synchronized maturation lines. In this condition, WTG, NGE, EW, EGW, EL and NFE presented negative correlations, being NFT the only variable positively correlated with GY (Table 1). Results suggested that the higher yield in synchronized maturation lines is associated to the increase in tiller number. However, this leads to a decrease in ear length and weight, grain number and weight. Absence of correlations in the stay-green group raises the hypothesis that the character can lead to a higher stability on yield related characters, since no negative association with GY was detected. The year of 2003 evidences the best conditions, since it rained regularly (Figure 1). In this condition, the average GY of the stay-green group was better than the synchronized (Table 1). Selection for higher NFT in wheat is effective in years with favorable environmental conditions, because a positive association with GY is observed (SANGOI et al., 2007; SILVEIRA et al., 2010; VALÉRIO et al., 2009).
This condition reports more severe drought conditions during the vegetative phase, signalizing with a strong loss of GY in the synchronized when compared to the stay-green group (Table 1). Under these conditions,
stay-green lines showed significant and positive
correlations between GY and NFT. One can observe that tillering starts and ends its expression during the vegetative phase and, despite the water restriction in this period, an effective correlation with GY was observed. The group of synchronized lines showed
significant and positive association with GY only via
EHI. Conversely , for the characters EW and EGW, a negative association was observed. It becomes evident that indirect selection strategies aiming high GY have to be different when dealing with the distinct maturation groups in 2004. Also, higher stability in GY was observed for the stay-green lines in both years. The stay-green lines increased the NFT without interfering negatively on other yield components. It is important to point out that NFT affects EGW and EW in synchronized genotypes, through a negative association and a compensation between these variables (VESOHOSKI et al., 2011). A positive selection for NFT is important for the increase in GY in wheat when there are no negative changes on ear components (HARTWIG et al., 2007). Therefore, in order to elongate photosynthetic
capacity in stay-green genotypes, grain filling rate
is favored, favoring EGW (PEIGAO et al., 2006). Also, besides EGW, stay-green wheat genotypes tend to increase NFT (AHLAWAT et al., 2008).
In 2005, two periods with low precipitation and high temperature were detected during the
crop season: tillering phase at the beginning of
primordia differentiation and grain filling final phase
(Figure 1). Thus, it was observed that for stay-green
lines, WTG was key for yield definition, showing significant and positive correlation coefficients
with GY (0.70). Meanwhile, for synchronized lines, strategy for yield increase was an increase in ear number per unit area, observed by a positive and
significant correlation between NFT and GY (0.52).
A higher instability, showing high temperatures
and reduced rains in the vegetative and final grain filling phases was observed in 2005 (Figure 1). This
year was shown to be the most restrictive to the
crop, as confirmed by low average GY values when
compared with the other years (Table 1). Despite these restrictions, the stay-green lines expressed higher average performance. In the synchronized lines, a positive association between NFT and GY was observed, without showing a compensation on the remaining ear components. However, the stay-green group revealed the possibility of favoring GY via an increase in WTG, especially in years showing more water restrictive conditions at the end
of the grain filling. TIAN et al. (2012) reported a
strong drought tolerance of stay-green mutants in wheat, since high values for yield components, such as WTG, were detected. Also, stay-green wheat genotypes were also reported to maintain yield in unfavorable conditions by increasing their WTG (LUCHE et al. (2013).
The distinct correlation values when comparing years and maturation groups indicated the need for a further analysis of direct and indirect
Table 1 - Pearson's correlation and general mean according to year and maturation group (Stay-green = SG and Synchronized = SZ) on the grain yield of wheat lines. Capão do Leão, RS, 2014.
Character ---2003--- ---2004--- ---2005---
SG SZ SG SZ SG SZ
GY x WTG -0.09 -0.56* -0.38 0.39 0.70** 0.12
GY x NFT 0.23 0.63** 0.59* 0.08 0.46 0.52*
GY x NGE 0.12 -0.64** 0.32 -0.45 -0.06 -0.10
GY x EW -0.01 -0.80** 0.11 -0.67** -0.27 -0.24 GY x EGW 0.02 -0.64** 0.30 -0.50* -0.27 -0.12
GY x EL 0.15 -0.51* -0.30 -0.44 -0.32 0.05
GY x NFS 0.09 -0.85** -0.10 -0.15 -0.04 -0.21
GY x EHI 0.09 0.40 0.47 0.51* 0.01 0.10
General Mean
A 2638+ B 2226 A 2308 B 1649 A 1608 B 1331 GY
** and *= Significant at P≤0.01 and P≤0.05 , respectively, according to the T test; GY = grain yield; WTG = weight of a thousand grains;
NFT = number of fertile tillers; NGE = number of grains per ear; EW = ear weight; EGW = ear grain weight; EL = ear length; NFS = number of fertile spikelets; EHI = ear harvesting index. + = Means followed by a distinct letter in the line differ maturation groups in the
effects through a path analysis (Tables 2 and 3). Considering 2003, the path analysis indicated that stay-green lines lead to an increase in GY via an increase in NGE, both by an expressive and favorable direct and indirect effect on grain yield. This was also reported by OOSTEROM et al. (2009), indicating that a higher leaf chlorophyll content and nitrogen accumulation in stay-green lines favors NGE via an increase in anthecia fertility; however, with a tendency
to cause reductions in WTG (ACRECHE &
SLAFER, 2005). In 2004, the stay-green group showed a different strategy for GY increase,
both via NFT or via EW with a negative effect on EL. Under these conditions, the synchronized group favored GY via increases in WTG and EHI, with a penalty regarding NGE. In 2005, year with higher cultivation constraints, it is evident that the stay-green character contributed to yield via WTG. Such condition reinforces that a longer active photosynthetic machinery is efficient on the accumulation of grain biomass, inclusive, without negatively interfering on NGE. Conversely, synchronized genotypes need to compensate lower WTG values, via an increase in NFT and NGE.
occurs by an increase in ear fertility, increasing grain number. In a more restrictive scenario, it
favors grain weight, since it elongates the final grain filling stage.
CONCLUSION
Under favorable conditions, the contribution of the stay-green character in wheat
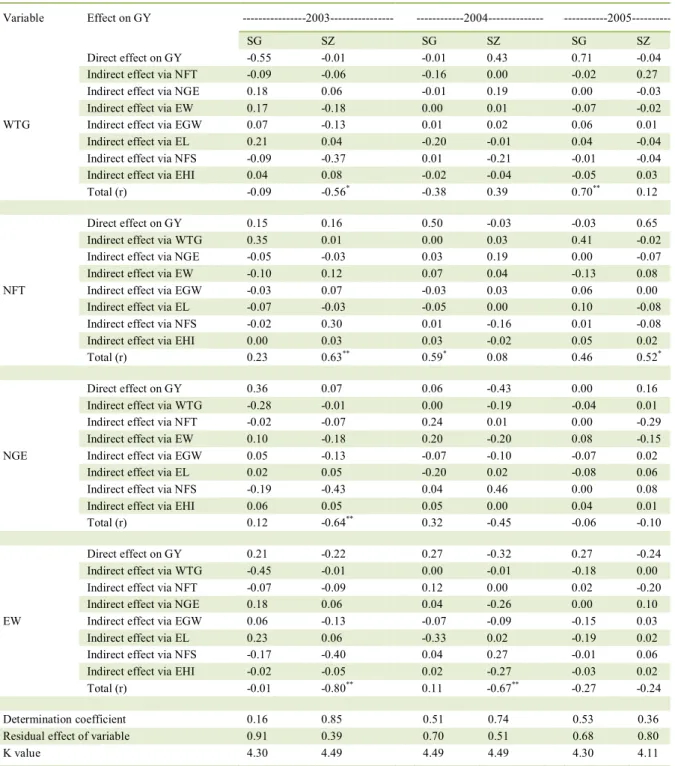
Table 2 - Estimative of direct and indirect effects of path coefficients through phenotypic correlations on the character grain yield (GY) as main dependent variable and yield component characters as independent explanatory variables for 32 wheat genotypes conducted in the years 2003, 2004 and 2005. Capão do Leãos, RS, 2014.
Variable Effect on GY ---2003--- ---2004---
---2005---SG SZ SG SZ SG SZ
WTG
Direct effect on GY -0.55 -0.01 -0.01 0.43 0.71 -0.04 Indirect effect via NFT -0.09 -0.06 -0.16 0.00 -0.02 0.27 Indirect effect via NGE 0.18 0.06 -0.01 0.19 0.00 -0.03 Indirect effect via EW 0.17 -0.18 0.00 0.01 -0.07 -0.02 Indirect effect via EGW 0.07 -0.13 0.01 0.02 0.06 0.01 Indirect effect via EL 0.21 0.04 -0.20 -0.01 0.04 -0.04 Indirect effect via NFS -0.09 -0.37 0.01 -0.21 -0.01 -0.04 Indirect effect via EHI 0.04 0.08 -0.02 -0.04 -0.05 0.03 Total (r) -0.09 -0.56* -0.38 0.39 0.70** 0.12
NFT
Direct effect on GY 0.15 0.16 0.50 -0.03 -0.03 0.65 Indirect effect via WTG 0.35 0.01 0.00 0.03 0.41 -0.02 Indirect effect via NGE -0.05 -0.03 0.03 0.19 0.00 -0.07 Indirect effect via EW -0.10 0.12 0.07 0.04 -0.13 0.08 Indirect effect via EGW -0.03 0.07 -0.03 0.03 0.06 0.00 Indirect effect via EL -0.07 -0.03 -0.05 0.00 0.10 -0.08 Indirect effect via NFS -0.02 0.30 0.01 -0.16 0.01 -0.08 Indirect effect via EHI 0.00 0.03 0.03 -0.02 0.05 0.02 Total (r) 0.23 0.63** 0.59* 0.08 0.46 0.52*
NGE
Direct effect on GY 0.36 0.07 0.06 -0.43 0.00 0.16 Indirect effect via WTG -0.28 -0.01 0.00 -0.19 -0.04 0.01 Indirect effect via NFT -0.02 -0.07 0.24 0.01 0.00 -0.29 Indirect effect via EW 0.10 -0.18 0.20 -0.20 0.08 -0.15 Indirect effect via EGW 0.05 -0.13 -0.07 -0.10 -0.07 0.02 Indirect effect via EL 0.02 0.05 -0.20 0.02 -0.08 0.06 Indirect effect via NFS -0.19 -0.43 0.04 0.46 0.00 0.08 Indirect effect via EHI 0.06 0.05 0.05 0.00 0.04 0.01 Total (r) 0.12 -0.64** 0.32 -0.45 -0.06 -0.10
EW
Direct effect on GY 0.21 -0.22 0.27 -0.32 0.27 -0.24 Indirect effect via WTG -0.45 -0.01 0.00 -0.01 -0.18 0.00 Indirect effect via NFT -0.07 -0.09 0.12 0.00 0.02 -0.20 Indirect effect via NGE 0.18 0.06 0.04 -0.26 0.00 0.10 Indirect effect via EGW 0.06 -0.13 -0.07 -0.09 -0.15 0.03 Indirect effect via EL 0.23 0.06 -0.33 0.02 -0.19 0.02 Indirect effect via NFS -0.17 -0.40 0.04 0.27 -0.01 0.06 Indirect effect via EHI -0.02 -0.05 0.02 -0.27 -0.03 0.02 Total (r) -0.01 -0.80** 0.11 -0.67** -0.27 -0.24
Determination coefficient 0.16 0.85 0.51 0.74 0.53 0.36 Residual effect of variable 0.91 0.39 0.70 0.51 0.68 0.80
K value 4.30 4.49 4.49 4.49 4.30 4.11
GY = grain yield (kg ha-1); WTG = weigth of a thousand grains (g); NFT = number of fertile tillers (units); NGE = number of grains per ear (units); EW = ear weight (g); r = coefficient of phenotypic correlation; ** and *= Significant at P≤0.01 and P≤0.05, respectively, according
ACKNOWLEDGEMENTS
The authors are thankful to Conselho Nacional de Desenvolvimento Científico e Tecnológico (CNPq) (Grant #
477083/2013-7; fellowships to ACO, JAGS, RN, SFSS and RGF), Coordenação de Aperfeiçoamento de Pessoal de Nível Superior (CAPES) (fellowship to HSL and MCH) and Fundação de Amparo à Pesquisa do Estado do Rio Grande do Sul (FAPERGS) (fellowship to RLS) for financial support .
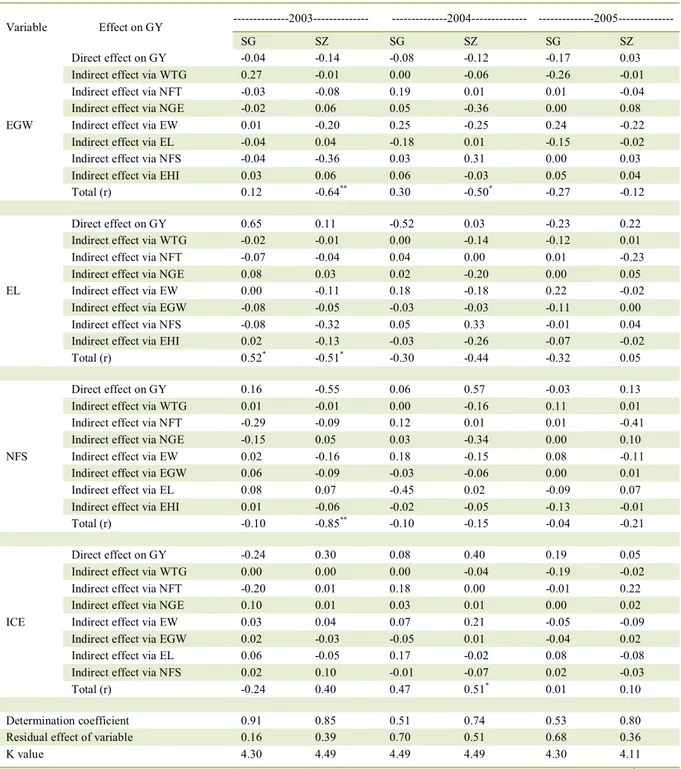
Table 3 - Estimative of direct and indirect effects of path coefficients through phenotypic correlations with grain yield (GY) as main dependent variable and yield component characters as independent explanatory variables for 32 wheat genotypes conducted in the years 2003, 2004 and 2005. Capão do Leão, RS, 2014.
Variable Effect on GY ---2003--- ---2004--- ---2005---
SG SZ SG SZ SG SZ
EGW
Direct effect on GY -0.04 -0.14 -0.08 -0.12 -0.17 0.03 Indirect effect via WTG 0.27 -0.01 0.00 -0.06 -0.26 -0.01 Indirect effect via NFT -0.03 -0.08 0.19 0.01 0.01 -0.04 Indirect effect via NGE -0.02 0.06 0.05 -0.36 0.00 0.08 Indirect effect via EW 0.01 -0.20 0.25 -0.25 0.24 -0.22 Indirect effect via EL -0.04 0.04 -0.18 0.01 -0.15 -0.02 Indirect effect via NFS -0.04 -0.36 0.03 0.31 0.00 0.03 Indirect effect via EHI 0.03 0.06 0.06 -0.03 0.05 0.04 Total (r) 0.12 -0.64** 0.30 -0.50* -0.27 -0.12
EL
Direct effect on GY 0.65 0.11 -0.52 0.03 -0.23 0.22 Indirect effect via WTG -0.02 -0.01 0.00 -0.14 -0.12 0.01 Indirect effect via NFT -0.07 -0.04 0.04 0.00 0.01 -0.23 Indirect effect via NGE 0.08 0.03 0.02 -0.20 0.00 0.05 Indirect effect via EW 0.00 -0.11 0.18 -0.18 0.22 -0.02 Indirect effect via EGW -0.08 -0.05 -0.03 -0.03 -0.11 0.00 Indirect effect via NFS -0.08 -0.32 0.05 0.33 -0.01 0.04 Indirect effect via EHI 0.02 -0.13 -0.03 -0.26 -0.07 -0.02 Total (r) 0.52* -0.51* -0.30 -0.44 -0.32 0.05
NFS
Direct effect on GY 0.16 -0.55 0.06 0.57 -0.03 0.13 Indirect effect via WTG 0.01 -0.01 0.00 -0.16 0.11 0.01 Indirect effect via NFT -0.29 -0.09 0.12 0.01 0.01 -0.41 Indirect effect via NGE -0.15 0.05 0.03 -0.34 0.00 0.10 Indirect effect via EW 0.02 -0.16 0.18 -0.15 0.08 -0.11 Indirect effect via EGW 0.06 -0.09 -0.03 -0.06 0.00 0.01 Indirect effect via EL 0.08 0.07 -0.45 0.02 -0.09 0.07 Indirect effect via EHI 0.01 -0.06 -0.02 -0.05 -0.13 -0.01 Total (r) -0.10 -0.85** -0.10 -0.15 -0.04 -0.21
ICE
Direct effect on GY -0.24 0.30 0.08 0.40 0.19 0.05 Indirect effect via WTG 0.00 0.00 0.00 -0.04 -0.19 -0.02 Indirect effect via NFT -0.20 0.01 0.18 0.00 -0.01 0.22 Indirect effect via NGE 0.10 0.01 0.03 0.01 0.00 0.02 Indirect effect via EW 0.03 0.04 0.07 0.21 -0.05 -0.09 Indirect effect via EGW 0.02 -0.03 -0.05 0.01 -0.04 0.02 Indirect effect via EL 0.06 -0.05 0.17 -0.02 0.08 -0.08 Indirect effect via NFS 0.02 0.10 -0.01 -0.07 0.02 -0.03 Total (r) -0.24 0.40 0.47 0.51* 0.01 0.10
Determination coefficient 0.91 0.85 0.51 0.74 0.53 0.80 Residual effect of variable 0.16 0.39 0.70 0.51 0.68 0.36
K value 4.30 4.49 4.49 4.49 4.30 4.11
EGW = ear grain weight (g); EL = ear length (cm); NFS = number of fertile spikelets (units); EHI = ear harvest index (g g-1); r =
REFERENCES
ACRECHE, M.M.; SLAFER, G.A. Grain weight response to increases in number of grains in wheat in a Mediterranean area.
Field Crops Research, v.98, p.52-59, 2006. Available from: <http:// www.sciencedirect.com/science/article/pii/S0378429005002790#>. Accessed: June 2013. doi: 10.1016/j.fcr.2005.12.005.
AHLAWAT, S. et al. Genotypic divergence analysis for stay green characters in Wheat (Triticum aestivum L. em. Thell). South Pacific Journal of Natural Sciences, v.26, p.73-81 2008. Available from: <http://www.publish.csiro.au /?act=view_file&file_id=SP08012.pdf>. Accessed: June 2013. doi: 10.1071/SP08012.
CHEN, J. et al. Physiological characterization of ‘stay green’ wheat cultivars during the grain filling stage under field growing conditions.
Acta Physiol Plant, v.32, p.875-882, 2010. Available from: <http://link.springer.com/article/10.1007%2Fs11738-010-0475-0>. Accessed: June 2013. doi: 10.1007/s11738-010-0475-0.
CRUZ, C.D. Programa genes-versão Windows 2001. Viçosa: UFV, 2001. 648p.
BARILI, L.D. et al. Correlação fenotípica entre componentes do rendimento de grãos de feijão comum (Phaseolus vulgaris L.).
Semina: Ciências Agrárias, v.32, n.4, p.1263-1274, 2011. Available from: <http://www.uel.br/revistas/uel/index.php/ semagrarias/article/view/4813/0>. Accessed: June 2013. doi: 10.5433/1679-0359.2011v32n4p1263.
HARTWIG, I. et al. Estimativa de coeficientes de correlação e trilha em gerações segregantes de trigo hexaplóide. Bragantia, v.66, n.2, p.203-218, 2007. Available from: <http://www.scielo.br/ scielo.php?script=sci_arttext&pid=S0006-87052007000200004>. Accessed: June 2013. doi: 10.1590/S0006-87052007000200004.
KUMARI, M. et al. Variation for stay green trait and its association with canopy temperature depression and yield traits under terminal heat stress in wheat. Developments in Plant Breeding, v.12, p.357-363, 2007. Available from: <http://link.springer.com/ chapter/10.1007/1-4020-5497-1_44>. Accessed: June 2013. doi: 10.1007/1-4020-5497-1_44.
LUCHE, H.S. et al. Desempenho per se e parâmetros genéticos de linhagens de trigo com expressão do caráter “stay‑green”.
Pesquisa Aagropecuária Brasileira, v.48 n.2, p.167-173, 2013. Available from: <http://www.scielo.br/scielo.php?script=sci_ arttext&pid=S0100-204X2013000200006>. Accessed: June 2013. doi: 10.1590/S0100-204X2013000200006.
MESSMER, R. et al. Drought stress and tropical maize: QTLs for leaf greenness, plant senescence, and root capacitance. Field Crops Research, v.124, p.93-103, 2011. Available from: <http:// www.sciencedirect.com/science/article/pii/S0378429011002097>. Accessed: June 2013. doi: 10.1016/j.fcr.2011.06.010.
OOSTEROM, E.J. et al. Functional dynamics of the nitrogen balance of sorghum: I. N demand of vegetative plant parts. Field Crops Research, v.115, p.19-28, 2010. Available from: <http:// www.sciencedirect.com/science/article/pii/S0378429009002652>. Accessed: June 2013. doi: 10.1016/j.fcr.2009.09.018.
PEIGAO, L. et al. Structural and biochemical mechanism responsible for the stay-green phenotype in common wheat.
Chinese Science Bulletin, v.51 n.21, p.2595-2603, 2006. Available from: <http://csb.scichina.com: 8080/kxtbe/EN/abstract/ abstract316905.shtml#>. Accessed: June 2013. doi: 10.1007/ s11434-006-2175-0.
SANGOI, L. et al. Características agronômicas de cultivares de trigo em resposta à época da adubação nitrogenada de cobertura.
Ciência Rural, v.37, n.6, p.1564-1570, 2007. Available from: <http://www.scielo.br/scielo.php?script=sci_arttext&p id=S0103-84782007000600010>. Accessed: June 2013. doi: 10.1590/S0103-84782007000600010.
SILVEIRA, G. et al. Efeito da densidade de semeadura e potencial de afilhamento sobre a adaptabilidade e estabilidade em trigo. Bragantia, v.69, n.1, p.1-884, 2010. Available from: <http://www.scielo.br/scielo.php?script=sci_arttext&pi d=S0006-87052010000100009>. Accessed: June 2013. doi: 10.1590/S0006-87052010000100009.
TIAN, F. et al. Enhanced stability of thylakoid membrane proteins and antioxidant competence contribute to drought stress resistance in the tasg1 wheat stay-green mutant. Journal of Experimental Botany, v.64, n.6, p.1509-1520, 2013. Available from: <http://jxb. oxfordjournals.org/content/early%20/2013/01/30/jxb.ert004.full. pdf>. Accessed: June 2013. doi: 10.1093/jxb/ert004.
TIAN, F.X. et al. Improved drought resistance in a wheat
stay-green mutant tasg1under field conditions. Biologia Plantarum, v.56, n.3, p.509-515, 2012. Available from: <http://link.springer. com/article/10.1007%2Fs10535-012-0049-7>. Accessed: June 2013. doi: 10.1007/s10535-012-0049-7.
VALÉRIO, I.P. et al. Fatores relacionados à produção e
desenvolvimento de afilhos em trigo. Semina: Ciências Agrárias,
v.30, supl. 1, p.1207-1218, 2009. Available from: <http://www.uel.br/ revistas/uel/index.php/semagrarias/article/view/4658/0>. Accessed: June 2013. doi: 10.5433/1679-0359.2009v30n4Sup1p1207.
VESOHOSKI, F. et al. Componentes do rendimento de grãos em trigo e seus efeitos diretos e indiretos na produtividade. Revista Ceres, v.58, n.3, p.337-341, 2011. Available from: <http://www.scielo.br/scielo.php?pid=S0034-737X2011000300014&script=sci_arttext>. Accessed: June 2013. doi: 10.1590/S0034-737X2011000300014.