Printed version ISSN 0001-3765 / Online version ISSN 1678-2690 http://dx.doi.org/10.1590/0001-3765201720160707
www.scielo.br/aabc | www.fb.com/aabcjournal
Assigning dates and identifying areas affected by fires in Portugal based on MODIS data
JESSICAPANISSET2
, CARLOS C.DACAMARA1
, RENATALIBONATI2
,
LEONARDO F.PERES2
, TERESA J.CALADO1 and ANABARROS3
1
Instituto Dom Luiz, Faculdade de Ciências, Universidade de Lisboa, Av. Campo Grande - Edifício C1, 1749-016 Lisboa, Portugal 2
Universidade Federal do Rio de Janeiro, Departamento de Meteorologia, Av. Athos da Silveira Ramos, 274, Bl. G, Cidade Universitária, 21941-916 Rio de Janeiro, RJ, Brazil 3
Oregon State University, College of Forestry, Department of Forest Engineering, Resources and Management, 280, Peavy Hall, Corvallis, OR, 97331, USA
Manuscript received on October 14, 2016; accepted for publication on March 31, 2017
ABSTRACT
An automated procedure is here presented that allows identifying and dating burned areas in Portugal using values of daily reflectance from near-infrared and middle-infrared bands, as obtained from the MODIS instrument. The algorithm detects persistent changes in monthly composites of the so-called (V,W) Burn-Sensitive Index and the day of maximum change in daily time series of W is in turn identified as the day of the burning event. The procedure is tested for 2005, the second worst fire season ever recorded in Portugal. Comparison between the obtained burned area map and the reference derived from Landsat imagery resulted in a Proportion Correct of 95.6%. Despite being applied only to the months of August and September, the algorithm is able to identify almost two-thirds of all scars that have occurred during the entire year of 2005. An assessment of the temporal accuracy of the dating procedure was also conducted, showing that 75% of estimated dates presented deviations between -5 and 5 days from dates of hotspots derived from the MODIS instrument. Information about location and date of burning events as provided by the proposed procedure may be viewed as complementary to the currently available official maps based on end-of-season Landsat imagery.
Key words: burned area, MODIS, Portugal, remote sensing.
Correspondence to: Renata Libonati E-mail: [email protected]
INTRODUCTION
Vegetation fires have major direct and indirect
impacts on all components of the Earth System,
in particular the atmosphere where they act as a
source of aerosols and of greenhouse and trace
gases (Dentener et al. 2006, Zhang et al. 2008, Van
(Fisher et al. 2009, Driscoll et al. 2010) and land use/cover dynamics (Sellers et al. 1996, Lambin and Geist 2006), they have adverse effects on public health and economy (Bowman and Johnston 2005, Fowler 2003, Patz et al. 2003).
Fire is globally used to manage natural resources, but despite how it is used, humans may not completely control the fires they set. Accordingly, the consequences of using fire as a management tool remain unpredictable since it often spreads without control, mostly during extreme climatic conditions, e.g., drought and heat waves (Alencar et al. 2006, Bowman et al. 2009, 2011, Page et al. 2002, Trigo et al. 2006). Currently, most fires are no longer associated with land management in Mediterranean Europe, but this practice is still used in some rural areas (Corti et al. 2012, San-Miguel-Ayanz et al. 2012). The expansion of wildland-urban interface areas in Mediterranean Europe reduces fuels availability but, on the other hand, people and their houses are put next to flammable vegetation types, increasing the possibility of fire start by human causes. In addition, the abandonment of unproductive land results in fuel accumulation (Moreira et al. 2011, Ganteaume et al. 2013, Corti et al. 2012, San-Miguel-Ayanz et al. 2012). Accordingly, the European Mediterranean region is a prone area to fire ignition and spread under drought and warmer summer conditions. Thousands of square kilometers of forests, woods and pastures burn every year in Southern European countries (i.e., Portugal, Spain, France, Italy and Greece) causing economic, ecological and human life losses (Quintano et al. 2011).
Fires in Portugal are conditioned by natural factors like the morphology of the landscape, land use, land cover, weather and climate. In particular, precipitation and temperature exhibit a well-marked seasonal behavior, with a dry season during the hot summer (June to August) and a wetter period during the remaining months, with a maximum in the cold winter months (Pereira et al. 2011).
Accordingly, most fires in Portugal occur during the summer months. In addition, socio-economic and demographic trends, similar to those recorded in the European Mediterranean rural areas, have contributed to increase the susceptibility to fire of the landscape (Pereira et al. 2005). According to Pereira et al. (2013), an area equivalent to 3/5 of the forested surface has burned in Portugal since 1980. Between 2003 and 2005, fire density and burned areas in Portugal were respectively more than eight and ten times higher than in Spain (Pereira et al. 2011).
The present study focuses on 2005, the second worst fire season ever recorded in Portugal, closely following the record fire season of 2003. Following an exceptionally dry period that took place between the end of 2004 and the beginning of 2005, a total of 35,319 fires took place in Portugal, an amount that is 80% larger than the average for the last decade and corresponds to 47% of the total fires in southern euro countries. These fires caused the death of 16 people and have burnt 338,593 ha of which 168,797 and 132,407 were forests, and shrubland and pasture, respectively. This number is 220% larger than the average for the last decade and corresponds to 58% of the burned area in southern euro countries. The highest number of fires occurred in the northern district of Porto and the largest burned area occurred in the central district of Coimbra (DGRF 2006).
spectral signatures that follow the burning events, a problem that is frequently encountered in tropical savanna areas where combustion products are easily scattered by the wind (Pereira et al. 1999). Burned area identification may also be severely affected by smoke aerosols, which contaminate surface observation and reduce the spectral contrast between distinct land cover types. Several studies have shown that use of MIR reflectance is especially appropriate for BA detection (Roy et al. 1999, Pereira et al. 1999, Libonati et al. 2012, 2010). On one hand, the MIR domain is virtually unaffected by smoke, allowing for almost undisturbed surface observation, including under extreme biomass burning conditions (Libonati et al. 2010). On the other hand, the MIR domain contributes to solving certain ambiguities between burned and unburned surfaces which may occur, e.g., in the visible (VIS) and short-wave infrared (SWIR), especially between 2.0 and 2.5 μm. As shown by Libonati et al. (2011) the increase in reflectance over burned surfaces is higher in MIR than in SWIR, allowing a better discrimination between both surfaces. In addition, the spectral response to fire in the MIR domain is similar to that observed in the VIS region, but with a larger increase in brightness and with an unequivocal reduction of sensitivity to atmospheric effects. However, a concern exists in the use of daytime MIR images, since the signal recorded by the sensor is a combination of reflected and emitted radiation, and specific procedures must be used to discriminate between the two types (Kaufman and Remer 1994).
Special attention has therefore been devoted to investigating relationships between spectral bands that enhance the burned scar signal using the MIR domain. Because MIR and Red (R) reflectances are strongly correlated, Pereira et al. (1999) suggested to replace the Red (R) reflectance by the reflective component of MIR in the Normalized Difference Vegetation Index (NDVI) and in the Global Environment Monitoring Index (GEMI), leading
to two new indices in the AVHRR NIR/MIR bi-spectral space, namely VI3 from NDVI and GEMI3 from GEMI. Barbosa et al. (1999) suggested a modified version of VI3 where the reflective part of MIR is replaced by the full MIR brightness temperature in Boreal and Mediterranean forests. Libonati et al. (2011) have found a new constraint in the NIR/MIR space, similar to the soil line in the RED/NIR space. Introduced by Richardson and Wiegand (1977), the soil line concept consists of a linear relationship between NIR and R reflectances of bare soil that has greatly contributed to the design of robust vegetation indices that are insensitive to the soil background while remaining responsive to vegetation (Verstraete and Pinty 1996). The NIR/ MIR constraint has in turn opened new perspectives in the line of the development of optical vegetation indices, in contrast to the above mentioned GEMI3 and VI3 that have been heuristically derived from indices already developed in the R/NIR domain. Taking advantage of the constraint in the NIR/MIR space, Libonati et al. (2011) proposed a new pair of indices aiming at BA discrimination, the so-called (V,W) pair, which has shown to be more performant than traditional ratio or modified ratio indices, and has revealed to be especially appropriate to detect vegetation changes, in particular those caused by fire events.
knowledge and despite the unequivocal need for fire information in a reliable and timely fashion, studies focusing on the problem of dating end-of-season Landsat burned scars in Portugal were limited to the one by Calado and DaCamara (2008). Accordingly, the aim of this work is to apply the so-called (V,W) Burn-Sensitive Vegetation Index (Libonati et al. 2011, Dacamara et al. 2016) to map and date burned areas in Portugal that resulted from fire events during 2005. The procedure relies on daily reflectance from near-infrared (NIR) and middle infrared (MIR) bands, as obtained from the Moderate Resolution Imaging Spectrometer (MODIS) instrument on-board Aqua and Terra satellites. Burned area identification is based on the automated algorithm proposed by Libonati et al. (2015), whereas burned area dating is derived from the method proposed by Roy et al. (1999) and Giglio et al. (2009). Obtained burned area maps are validated against the ICNF fire atlas based on end-of-season Landsat TM/ETM imagery. Obtained estimates of dates of occurrence of burning events are in turn compared with dates of active fires detected by the MODIS instrument.
MATERIALS AND METHODS
STUDY AREA
As other southern European regions, Portugal is characterized by a mild Mediterranean climate, but with well-known vulnerability to climate variability, namely to droughts and desertification in the southern sector (Miranda et al. 2002). Although markedly changing from north to south and from coast to mountain areas, the climate of Portugal is characterized by rainy winters, and dry and hot summers. More intense winds and higher rainfall take place in autumn and winter, with low temperatures occurring in the northernmost districts. In general, spring and summer have low cloudiness with high temperatures during the dry months of July and August (especially in the
interior of the southern province of Alentejo). The mean annual precipitation ranges from just over 3000 mm in the northwest region to less than 500 mm in the interior of Alentejo.
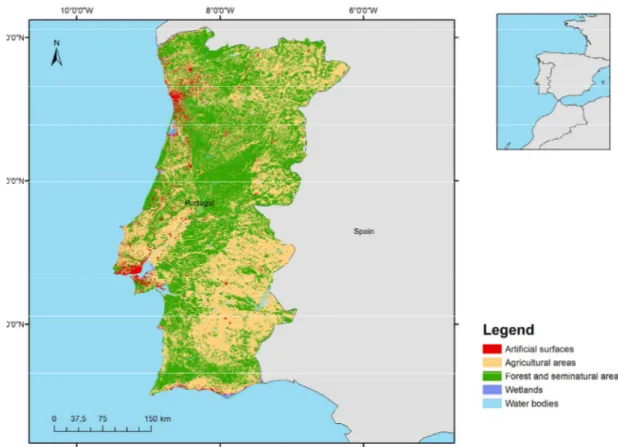
Forests and evergreen trees cover about 60% of the territory (Figure 1). The natural vegetation is pyrophyte and drought resistant. The fires incidence is higher in the northern section, where the typical Mediterranean summer coexists with high primary productivity, leading to a large amount of available fuels (Oliveira et al. 2014). Most of the burnt areas in Portugal (80%) are due to fire events that occur on a small number of summer days (10%) when atmospheric circulation forms a prominent ridge over the Iberian Peninsula with a strong meridional flow (Pereira et al. 2005).
DATA
middle-infrared (MIR. Data from Aqua and Terra / MODIS Geolocation Fields 5-Min Level 1A Swath 1 km V6 product were also used (MOD03 and MYD03).
Burned area identification and dating in Portugal was performed using the (V,W) Burn-Sensitive Vegetation Index together with active fire data from MODIS product Thermal Anomalies/Fire 5-Min L2 Swath 1km MOD14 (from Terra) and MYD14 (from Aqua). These products are level-2 swath data provided daily at 1-kilometer resolution, and include fire-mask, algorithm quality, radiative power, and numerous layers describing fire pixel attributes. The Terra (Aqua) MODIS instrument acquires data twice a day, at 10:30 AM and PM (1:30 PM and AM).
In general, validation of remote sensing data and products are based on in-situ measurements obtained during field campaigns, which are viewed as the ground reference. An alternative approach is
resolution (1 km) only scars larger than 100 ha were here used for validation. Obtained estimated dates were in turn validated by comparison with hotspots dates from MOD14 and MYD14 product. Each hotspot is associated with both spatial (latitude and longitude) and temporal (time, day, month and year) information. Moreover, each occurrence is associated with a confidence level, ranging from 1 to 100%. It is worth noting that almost 70% of the 2005 hotspots have a confidence level above 50% and more than 80% of the hotspots occurred in the period between July and September. Thus, both the burned area identification and validation processes use only hotspots with a confidence level above 50%.
THE (V,W) BURN-SENSITIVE VEGETATION INDEX
The (V,W) Burn-Sensitive Vegetation Index has been developed and successfully tested for MODIS channels 2 and 20 (Libonati et al. 2010, 2011, 2015), e.g., based on red and near-infrared, to discriminate between burned and unburned surfaces in tropical environments. Surface reflectance in the middle-infrared (MIR. Indices V and W are defined on a coordinate system η and ξ based on a transformation defined on NIR and MIR space that is appropriate for vegetation and burned area discrimination. The new coordinates η and ξ are based respectively on the distance from a convergence point in the MIR/ NIR, representing an entirely burned surface, and on the difference between MIR and NIR reflectance:
(
0) (
2 0)
2MIR NIR
ñ
ñ
η
=
ρ
MIR−
+
ρ
NIR−
(1)ξ ρ
=
MIR−
ρ
NIR (2)In the above expressions, ρ is the reflectance, and ρ0MIR and
0 MIR
ρ are reflectance values defining
the convergence point on the MIR/NIR space, according to Libonati et al. (2011) ρMIR0 =0.24
and 0
NIR 0.05
ρ = . As shown by Dacamara et al.
(2016), when using MODIS channels 2 (NIR) and 20 (daytime reflected component of MIR) indices V and W may be conveniently approximated as
(0.14 0.71)/
V′= − ξ η and W′ =1.1 η.
The V-index presents a small scatter for pixels associated with vegetated surfaces (strict scale) whereas the W index covers a wide range of values (large scale) that suggest its use as a proxy of the water content of vegetation. The strict and large scale character make the (V,W) Burn-Sensitive Vegetation Index especially adequate to discriminate vegetated surfaces and rank them according to the water content, from green and dry to burned vegetation. All green and burned vegetation surfaces are accordingly located along V = 1, and green, dry and burned vegetation pixels being associated respectively with decreasing values of W.
IDENTIFICATION OF BURNED AREAS
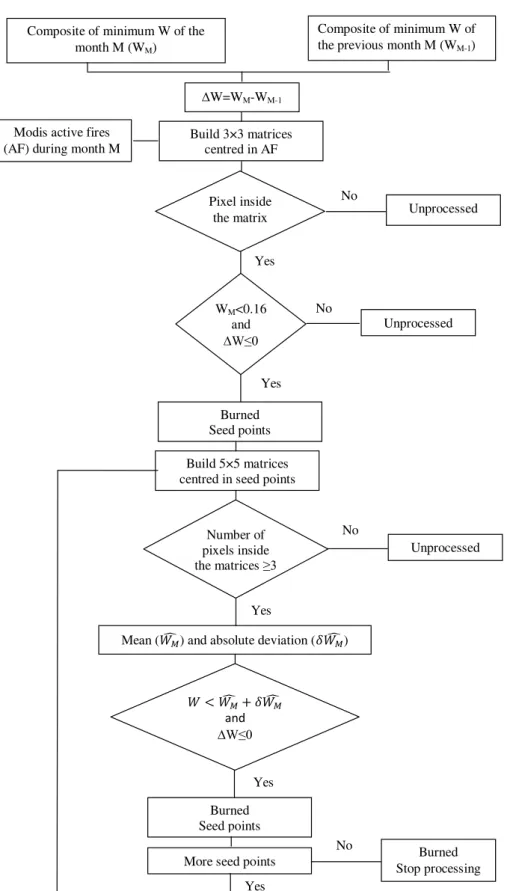
also burned, despite presenting weaker radiometric signals that may be due to partial burning or to low fire intensity. Accordingly, for each seed point (i.e., each pixel classified as burned in the first phase) the 24 surrounding pixels are analyzed and if the total number of burned pixels inside this grid of 5 × 5 pixels is greater than or equal to 3, then the mean (Wˆ) and the mean absolute deviation (δW) of burned pixels within the grid is computed. A pixel inside the grid that initially was not classified as burned will be now classified as such and in turn considered as a new seed point if the respective value of W for the current month is less than
ˆ
W+δW and the temporal difference between the
current and the previous month is less than or equal to zero. This procedure is recursively performed until no new seed points are generated. Finally, the burned area is obtained by summing up all identified burned pixels. Figure 2 presents a brief schematic overview of the processing stages of the algorithm that allow identification of burned areas.
ASSIGNMENT OF DATES TO BURNED AREAS
The dating method consists in identifying those pixels classified as burned and then analyzing the associated daily time series of W in order to find the occurrence of a sudden drop in W, which may be used as an indicator of the day of the burning event. For each day D, the mean value of W is computed for two consecutive temporal windows, covering respectively six days before and after D. The day of maximum change is then identified by means of a discrimination index S (Giglio et al. 2009) that provides a measure of temporal separability between the two groups of W observations. Discrimination index S relies on estimates of mean and standard deviation of W in the window before day D as well as on estimates of mean and standard deviation the window following day D. For a given location with coordinates , the value of is given by:
( )
( )
( )
( )
W x, y ,
, , / 2
ν
σ σ
=
−
pre post
S x y
x y x y
(3)
where:
( )
,( )
,( )
,ν
W x y =Wpre x y −Wpost x y (4)and
( )
,(
( )
,)
, 6 :{
}
pre i
W x y =mean W x y i= D− D (5)
( )
,(
( )
,)
pre x y std W x yi
σ
= (6)( )
,(
( )
,)
, :{
6}
post i
W x y =mean W x y i= D D+ (7)
( )
,(
( )
,)
post x y std W x yi
σ
= (8)As shown in Figure 3, when there is a sudden and large decrease in W, S is positive. On the other hand, when there are no time changes or the variations are gradual, S is quite close to zero, and when there is an increase in W, S is negative. The largest positive value of S (on day 38) indicates the day of burning.
RESULTS
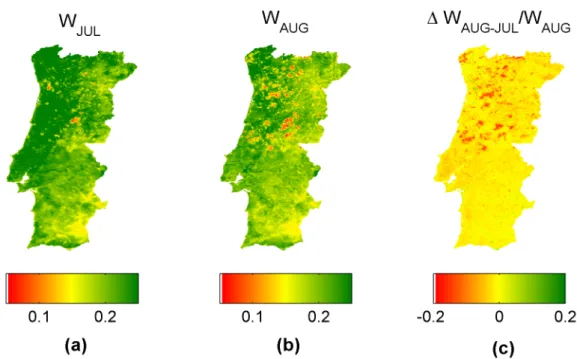
Figure 4 shows the minimum value composites of W for July and August 2005 (a, b) and the (normalized) temporal difference of W between the current and the previous month (c). As expected, burned areas are represented by low values of W (low water content) and/or by negative values in the temporal difference (associated to a monthly decrease of W).
Yes
Composite of minimum W of the previous month M (WM-1)
Pixel inside the matrix Composite of minimum W of the
month M (WM)
W=WM-WM-1
Build 3×3 matrices centred in AF Modis active fires
(AF) during month M
No
Unprocessed
WM<0.16
and
W≤0
Yes
Unprocessed
No Burned
Seed points Yes
Build 5×5 matrices centred in seed points
Number of pixels inside the matrices ≥3
Unprocessed
Burned Seed points
No
Mean (𝑊𝑊̂𝑀𝑀) and absolute deviation (𝛿𝛿𝑊𝑊̂𝑀𝑀)
𝑊𝑊 < 𝑊𝑊̂ + 𝛿𝛿𝑊𝑊𝑀𝑀 ̂𝑀𝑀 and W≤0
More seed points Yes
Yes
Burned Stop processing No
Figure 3 - Temporal series of W (left panel) and discrimination index S (right panel) for a selected pixel. Red and blue circles (left panel) distinguish Terra and Aqua data, respectively. The highest value of S is represented by a red circle (right panel) and corresponds to the day with a sudden and large decrease in W (left panel).
normalized temporal difference of W (Figure 4) in order to identify burned pixels. As shown in Figure 5 (a), the methodology was applied to generate a burned area map for August and September 2005. For validation purposes, a map was also produced for the whole year of 2005, based on information from Landsat imagery; this map is presented in Figure 5 (b).
Validation of burned area was based on a systematic comparison of the map obtained by the proposed algorithm based on the (V,W) index against the 2005 annual burned area atlas provided by the ICNF based on end of fire season Landsat TM/ETM imagery. For that purpose, the scar vectors from the reference map were rasterized at 1 km spatial resolution to allow the comparison with the burned map based on MODIS imagery. As some resized pixels at 1 km (mainly those located in the borders of the scars) represent areas that were not totally burned, we have used the original burned area atlas at 30 m to compute the percentage of burned area on the low-resolution cells.
The performance of the method based on the (V,W) index was evaluated by means of contingency tables and standard accuracy measures, namely the Proportion Correct (PC), Commission Error (CE), Omission Error (OE) and Probability of Detection (POD). All these measures were computed following Binaghi et al. (1999). Accordingly, agreement or disagreement between reference data (resized at 1 km) and classified data are computed taking into account the proportion of burned/unburned area of the reference data inside each pixel of classified data. Tables I and II, respectively present the confusion matrix and standard accuracy measures, whereas Figure 6 shows the spatial distribution of PODs (green pixels), CEs (red pixels) and OEs (blue pixels) for August and September 2005.
As shown in Table II, the proposed algorithm based on (V,W) index correctly identified almost two-thirds of burned pixels (62.9%). It is
nevertheless worth noting that the algorithm has just been used to detect scars in August and September whereas the reference map refers to the whole year of 2005. This means that despite restricting the analysis to the months of July (used in the temporal difference of W), August and September, the proposed algorithm was nevertheless able to detect almost two-thirds of the burned area for the whole year of 2005.
On the other hand, 37.1% of burned pixels in the reference ICNF map were not identified by the algorithm. However, information from hotspots shows that 22.5% of all OEs refer to wildfires that have not occurred in August and September, i.e., to events not covered by the study period. Most of these specific cases are related to July hotspots (15.2%), which include the largest scar highlighted in the right panel of Figure 6 (circle in black) that was not detected by the algorithm.
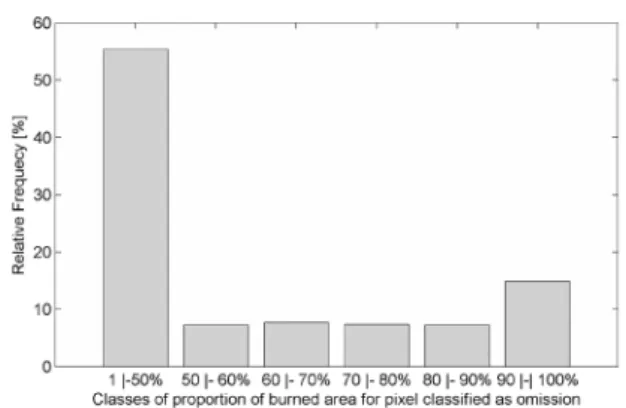
Table III shows that 29.9% of OEs are associated with the occurrence of hotspots in August or September, and therefore should have been detected by the algorithm. The remaining 47.6% of omission cases occurred in pixels where no hotspots were detected. This may happen mainly due to the fact that: a) only hotspots with confidence level above 50% were ingested by the algorithm, b) MOD14 and MYD14 products have failed to detect an active fire, and c) the ICNF scar map is incorrect in some cases, detecting scars that do not correspond to wildfires (e.g., deforestation).
TABLE III
Monthly relative frequency of hotspots for OEs and CEs pixels [%].
[%] August September Other months No hotspots
Commission Error 11.8 3.1 4.5 80.6
Omission Error 27.5 2.4 22.5 47.6
TABLE I
Contingency table computed according to Binaghi et al. (1999). Values correspond to fraction of pixels.
LANDSAT
MODIS
BURNED UNBURNED Total
BURNED 1596.7 3165.0 4761.7
UNBURNED 943.7 87765.6 88709.4
Total 2540.4 90930.6 93471.0
TABLE II
Standard accuracy measures computed from contingency Table I: Proportion Correct (PC), Commission Error (CE), Omission Error (OE) and Probability of Detection
(POD). Accuracy Measures(%)
PC 95.6
CE 66.5
OE 37.1
POD 62.9
Figure 5 - Burned area map for August and September 2005, as obtained by the algorithm based on MODIS imagery (a)
and the reference map for the whole year of 2005, based on Landsat imagery (b).
Figure 6 - Spatial distribution of PODs (green pixels), CEs (red pixels) and OEs (blue pixels). Right panel (b) shows a zoom of the area delimited by the black rectangle (a). The area inside the black circle (b) shows the largest scar not detected by the algorithm.
As shown in Table II, 66.5% of the detected burned pixels correspond to CEs. However, 14.9% of them have at least one hotspot detected by the MODIS product in August and September (Table III) and are also associated to low values of W (< 0.16) and to negative monthly temporal difference of W. Therefore, there is strong evidence that those pixels are really burned ones, and should not be classified as commission errors. The disagreement may be due to a drawback in the classification of the
reference ICNF map because of its low temporal
resolution. Table III also shows that 80.6% of CEs
are associated with the absence of hotspots, an indication that information about active fires has an important role in the entire procedure, when burned
pixels are identified restricting to information
Figure 9 - Differences between dates assigned by the algorithm and MODIS hotspots dates.
Figure 7 - Proportion of burned area for pixels characterized as omission errors.
Figure 8 - Days of wildfires occurrences as obtained by the algorithm (a) and hotspots dates from MOD14 and MYD14 products (b), for pixels that have been classified as burned by the two methods. Day 1 refers to August 1, and day 61, to September 30, 2005. Pixels in light gray represent unburned pixels and pixels in white correspond to pixels outside Portugal. Figure 8 shows the dates assigned to each scar
by the dating algorithm (a) as well as the dates of the available hotspots extracted from MOD14 and MYD14 products (b). It may be noted that date assignment was restricted to those pixels that were found to be correctly identified as burned by the algorithm based on the (V,W) Burn-Sensitive Vegetation Index. Validation was carried out by comparing the results obtained from these two sources for the period between August 1 and September 30. In order to ensure that the hotspots represent the wildfires with a higher confidence level, we have again opted to restrict the dating algorithm to those pixels with the confidence of occurrence higher than 50%. Obtained results indicate that almost two-thirds of the cases (63.5%) have differences between -2 and +2 days, and three-quarters of the cases (75.0%) have differences between -5 and +5 days (Figure 9).
CONCLUSIONS
monthly minimum value composites of W together with hotspot information from MOD14 and MYD14 products.
Comparison between the obtained burned area map based on the (V,W) index and the 2005 annual burned area atlas provided by the ICNF based on end of fire season Landsat TM/ETM imagery has resulted in PC and POD values of 95.6% and 62.9%, respectively. Accordingly, and despite being applied only to low-resolution images of July, August, and September, the proposed automatic method for burned area detection was able to detect almost two-thirds of all scars for the whole year of 2005.
It is worth noting that OEs and CEs were mainly observed on the scar borders, where the proportion of burned area is lower and the spectral signal on the W Index is not so pronounced. CEs were also observed in small isolated scars that are associated with hotspots. In such cases, the reference ICNF map may have failed to classify those pixels as burned because the ICNF identification is based on end of fire season imagery, when the radiometric signal of some of the smaller scars could have disappeared. This may be also due to the lower temporal resolution of Landsat TM/ET. On the other hand, OEs were mainly observed in isolated scars corresponding to wildfires that have not occurred in August and September.
Date assignment to scars was performed based on the analysis of time series of W, the day of burning being associated to a steep decrease in W (characterised by a large temporal separation between two consecutive temporal windows). Validation of results against dates of hotspots by the MODIS instrument shows that 63.5% of the pixels were correctly dated, with differences between assigned dates by the algorithm and dates of ranging from -2 to +2 days. The matching score increases to 75% for differences of up to ±5 days.
Results from this work show that the proposed automatic method for burned area detection and
dating is suitable to be applied over continental Portugal, paving the way to the generation of a long-term series of burned area maps containing accurate information about the dates of fire occurrence. This information may be viewed as complementary to the currently existing spatial information contained in the annual maps of fire perimeters provided by the Portuguese authority for forests (ICNF).
ACKNOWLEDGMENTS
The research was performed in the framework of Fundação de Amparo à Pesquisa do Estado de São Paulo (FAPESP)/FCT Project Brazilian Fire-Land-Atmosphere System (BrFLAS) (FAPESP/1389/2014 and 2015/01389-4), of EUMETSAT Satellite Application Facility for Land Surface Analysis (LSA SAF) and of grant E-26/201.521/2014 by Fundação Carlos Chagas Filho de Amparo à Pesquisa do Estado do Rio de Janeiro (FAPERJ).
REFERENCES
ALENCAR A, NEPSTAD D AND DZIA MCV. 2006. Forest understory fire in the Brazilian Amazon in ENSO and non-ENSO years: Area burned and committed carbon emissions. Earth Interact 10(6): 1-17.
ANDREAE MO, ROSENFELD D, ARTAXO P, COSTA AA, FRANK GP, LONGO KM AND SILVA-DIAS MAF. 2004. Smoking rain clouds over the Amazon. Science 303(5662): 1337-1342.
BARBOSA PM, GRÉGOIRE JM AND PEREIRA JMC. 1999. An algorithm for extracting burned areas from time series of AVHRR GAC data applied at a continental scale. Remote Sens Environ 69(3): 253-263.
BINAGHI E, BRIVIO PA, GHEZZI P AND RAMPINI A. 1999. A fuzzy set-based accuracy assessment of soft classification. Pattern Recognit Lett 20(9): 935-948. BOWMAN DMJS ET AL. 2011. The human dimension of fire
regimes on Earth. J Biogeogr 38(12): 2223-2236. BOWMAN DMJS AND JOHNSTON FH. 2005. Wildfire
smoke, fire management, and human health. EcoHealth 2(1): 76-80.
CERTINI G. 2005. Effects of fire on properties of forest soils: a review. Oecologia 143(1): 1-10.
CORTI P, SAN-MIGUEL-AYANZ J, CAMIA A, MCINERNEY D, BOCA R AND DI LEO M. 2012. Fire news management in the context of the European Forest Fire Information System (EFFIS). In: proceedings of “Quinta conferenza italiana sul software geografico e sui dati geografici liberi” (GFOSS DAY 2012).
DACAMARA CC, LIBONATI R, ERMIDA SL AND CALADO TJ. 2016. A user-oriented simplification of the (V,W) burn-sensitive vegetation index system. IEEE Geosci Remote Sens Lett 13(12): 1822-1826.
DENTENER FJ ET AL. 2006. Emissions of primary aerosol and precursor gases in the years 2000 and 1750 prescribed data-sets for AeroCom. Atmos Chem Phys Discuss 6(12): 4321-4344.
D G R F - F O R E S T RY R E S O U R C E S G E N E R A L DIRECTORATE. 2006. Incêndios Florestais – Relatório 2005. Divisão de Defesa da Floresta contra Incêndios, Direção Geral dos Recursos Florestais. Lisbon.
DRISCOLL DA ET AL. 2010. Fire management for biodiversity conservation: key research questions and our capacity to answer them. Biol Conserv 143(9): 1928-1939. FISHER JL, LONERAGAN WA, DIXON K, DELANEY
J AND VENEKLAAS EJ. 2009. Altered vegetation structure and composition linked to fire frequency and plant invasion in a biodiverse woodland. Biol Conserv 142(10): 2270-2281.
FOWLER C. 2003. Human health impacts of forest fires in the Southern United States: A Literature Review. J Ecol Anthropol 7: 39-63.
GANTEAUME A, CAMIA A, JAPPIOT M, SAN-MIGUEL-AYANZ J, LONG-FOURNEL M AND LAMPIN C. 2013. A review of the main driving factors of forest fire ignition over Europe. Environ Manage 51(3): 651-662.
GIGLIO L, LOBODA T, ROY DP, QUAYLE B AND JUSTICE CO. 2009. An active-fire based burned area mapping algorithm for the MODIS sensor. Remote Sens Environ 113(2): 408-420.
KAUFMAN YJ AND REMER LA. 1994. Detection of forests using mid-IR reflectance: an application for aerosol studies. IEEE Trans Geosci Remote Sens 32(3): 672-683. LAMBIN EF AND GEIST HJ. 2006. Land-use and land-cover
change: local processes and global impacts. Springer Science & Business Media, Berlin.
LIBONATI R, DACAMARA CC, PEREIRA JMC AND PERES LF. 2010. Retrieving middle-infrared reflectance for burned area mapping in tropical environments using MODIS. Remote Sens Environ 114(4): 831-843.
LIBONATI R, DACAMARA CC, PEREIRA JMC AND PERES LF. 2011. On a new coordinate system for improved discrimination of vegetation and burned areas
using MIR/NIR information. Remote Sens Environ 115(6): 1464-1477.
LIBONATI R, DACAMARA CC, PEREIRA JMC AND PERES LF. 2012. Retrieving middle-infrared reflectance using physical and empirical approaches: Implications for burned area monitoring. IEEE Trans Geosci Remote Sens 50: 281-294.
LIBONATI R, DACAMARA CC, SETZER AW, MORELLI F AND MELCHIORI AE. 2015. An algorithm for burned area detection in the Brazilian Cerrado using 4 μm MODIS imagery. Remote Sens 7(11): 15782-15803.
LOHMANN U, STIER P, HOOSE C, FERRACHAT S, KLOSTER S, ROECKNER E AND ZHANG J. 2007. Cloud microphysics and aerosol indirect effects in the global climate model ECHAM5-HAM. Atmos Chem Phys 7(13): 3425-3446.
MIRANDA P, COELHO FES, TOMÉ AR, VALENTE MA, CARVALHO A, PIRES C, PIRES HO, PIRES VC AND RAMALHO C. 2002. 20th century Portuguese climate and climate scenarios. In: Santos FDK et al. (Eds), Climate change in Portugal: scenarios, impacts and adaptation measures (SIAM Project): Gradiva, p. 23-83.
MOREIRA F ET AL. 2011. Landscape-wildfire interactions in southern Europe: Implications for landscape management. J Environ Manage 92(10): 2389-2402.
OLIVEIRA S, PEREIRA JMC, SAN-MIGUEL-AYANZ J AND LOURENÇO L. 2014. Exploring the spatial patterns of fire density in Southern Europe using Geographically Weighted Regression. Appl Geogr 51: 143-157.
OLIVEIRA SLJ, PEREIRA JM AND CARREIRAS JMB. 2012. Fire frequency analysis in Portugal (1975 - 2005), using Landsat-based burnt area maps. Int J Wildland Fire 21: 48-60.
PAGE SE, SIEGERT F, RIELEY JO, BOEHM HDV, JAYA A AND LIMIN S. 2002. The amount of carbon released from peat and forest fires in Indonesia during 1997. Nature 420(6911): 61-65.
PATZ JA, GITHEKO AK, MCCARTY JP, HUSSEIN S, CONFALONIERI U AND DE WET N. 2003. Climate change and infectious diseases. Climate change and human health: risks and responses. World Health Organization, p. 103-127.
PEREIRA JMC, SÁ ACL, SOUSA AMO, SILVA JMN, SANTOS TN AND CARREIRAS JMB. 1999. Spectral characterisation and discrimination of burnt areas. In: Chuvieco E (Ed), Remote Sensing of Large Wildfires in the European Mediterranean Basin, New York: Springer Berlin Heidelberg, New York, USA, p. 123-138.
PEREIRA MG, CALADO TJ, DACAMARA CC AND CALHEIROS T. 2013. Effects of regional climate change on rural fires in Portugal. Clim Res 57(3): 187-200. PEREIRA MG, MALAMUD BD, TRIGO RM AND ALVES
Portuguese rural fire database. Nat Hazards Earth Syst Sci 11(12): 3343-3358.
PEREIRA MG, TRIGO RM, DACAMARA CC, PEREIRA JMC AND LEITE SM. 2005. Synoptic patterns associated with large summer forest fires in Portugal. Agric For Meteorol 129: 11-25.
QUINTANO C, FERNÁNDEZ-MANSO A, STEIN A AND BIJKER W. 2011. Estimation of area burned by forest fires in Mediterranean countries: A remote sensing data mining perspective. For Ecol Manage 262(8): 1597-1607. RICHARDSON AJ AND WIEGAND CL. 1977. Distinguishing
vegetation from soil background information. Photogramm Eng Remote Sens 43(12): 1541-1552.
ROSENFELD D. 1999. TRMM observed first direct evidence of smoke from forest fires inhibiting rainfall. Geophys Res Lett 26(20): 3105-3108.
ROY DP, GIGLIO L, KENDALL JD AND JUSTICE CO. 1999. Multi-temporal active-fire based burn scar detection algorithm. Int J Remote Sens 20(5): 1031-1038.
SAN-MIGUEL-AYANZ J ET AL. 2012. Comprehensive monitoring of wildfires in Europe: the European Forest Fire Information System (EFFIS). In: Tiefenbacher J (Ed), Approaches to Managing Disaster - Assessing Hazards, Emergencies and Disaster Impacts, Rijeka: InTech, Rijeka, Croatia, p. 87-108.
SELLERS PJ, RANDALL DA, COLLATZ GJ, BERRY JA, FIELD CB, DAZLICH DA, ZHANG C, COLLELO GD AND BOUNOUA L. 1996. A revised land surface
parameterization (SiB2) for atmospheric GCMs. Part I: Model formulation. J Clim 9: 676-705.
STORELVMO T, LEIRVIK T, LOHMANN U, PHILLIPS PCB AND WILD M. 2016. Disentangling greenhouse warming and aerosol cooling to reveal Earth’s climate sensitivity. Nat Geosci 9(4): 286-291.
TOLLER G AND ISAACMAN A. 2009. MODIS Level 1B Product User’s Guide. NASA: 63. Available from: http:// ccplot.org/pub/resources/Aqua/MODIS%5CnLevel%5Cn 1B%5CnProduct%5CnUser%5CnGuide.pdf.
TRIGO RM, PEREIRA JMC, PEREIRA MG, MOTA B, CALADO TJ, DACAMARA CC AND SANTO FE. 2006. Atmospheric conditions associated with the exceptional fire season of 2003 in Portugal. Int J Climatol 26(13): 1741-1757.
VAN LEEUWEN TT AND VAN DER WERF GR. 2011. Spatial and temporal variability in the ratio of trace gases emitted from biomass burning. Atmos Chem Phys 11(8): 3611-3629.
VERSTRAETE MM AND PINTY B. 1996. Designing optimal spectral indexes for remote sensing applications. IEEE Trans Geosci Remote Sens 34(5): 1254-1265.