Article
J. Braz. Chem. Soc., Vol. 22, No. 10, 1987-1992, 2011. Printed in Brazil - ©2011 Sociedade Brasileira de Química
0103 - 5053 $6.00+0.00
A
*e-mail: [email protected]
Determination of Iron and Aluminum Based on the Catalytic Effect on the Reaction
of Xylene Cyanol FF with Hydrogen Peroxide and Potassium Periodate
Longfei Cai* and Chunxiu Xu
Department of Chemistry, Hanshan Normal University, Chaozhou, 521041 P. R.China
Um método simples, sensível e seletivo para determinação simultânea de traços de ferro e alumínio por espectrofotometria catalítica foi desenvolvido. Esse método baseia-se nos efeitos catalíticos de ferro e alumínio sobre a reação de xileno cianol FF com peróxido de hidrogênio e periodato de potássio. Ferro e alumínio não apresentaram efeitos catalíticos sobre a reação de oxidação do xileno cianol FF em meio contendo apenas peróxido de hidrogênio ou apenas periodato de potássio. Entretanto, foram obtidos efeitos catalíticos signiicativos de ferro e alumínio quando ambos oxidantes foram usados simultaneamente. Gráicos de calibração linear foram obtidos no intervalo de 3,57 × 10⁻⁸ a 3,57 × 10⁻⁷ mol L-1 para Fe e de 1,48×10⁻⁷ a 1,48 ×10⁻⁶ mol L-1 para Al.
Os limites de detecção, baseados no critério de 3 vezes o desvio padrão, foram 1,50 × 10⁻⁸ mol L-1
para Fe e 6,10 × 10⁻⁸ mol L-1 para Al. Este método foi aplicado para determinação simultânea de
traços de ferro e alumínio em água de torneira, água de lago, de rio e folhas de chá sem etapas de separação e pré-concentração. Os teores de Fe e Al em águas de torneira, lago e rio foram 3,13 × 10⁻⁷, 3,21 × 10⁻⁷ e 2,74 × 10⁻⁷ mol L-1 para Fe e 1,31 × 10⁻⁶, 9,83 × 10⁻⁷ e 1,43 × 10⁻⁶ mol L-1
para Al, respectivamente. As quantidades de Fe e Al nas folhas de chá foram 3,10 × 10² μg g-1 Fe e
7,37 × 10² μg g-1 Al. Estudos complementares são necessários para o entendimento do mecanismo
catalítico do ferro e alumínio nesta reação de oxidação inédita.
A simple, sensitive and selective method for the simultaneous determination of trace iron and aluminum by catalytic spectrophotometry is presented. This method is based on the catalytic effects of iron and aluminum on the reaction of xylene cyanol FF with hydrogen peroxide and potassium periodate. Both iron and aluminum did not show catalytic effects on the oxidation reaction of xylene cyanol FF in the presence of either hydrogen peroxide or potassium periodate. However, signiicant catalytic effects of iron and aluminum were obtained when the two oxidants were simultaneously used. Linear calibration graphs were obtained from 3.57 × 10⁻⁸ to 3.57 × 10⁻⁷ mol L-1 for Fe and
from 1.48 × 10⁻⁷ to 1.48 × 10⁻⁶ mol L-1 for Al. The detection limits, based on the 3-fold standard
deviation criterion, were 1.50 × 10⁻⁸ mol L-1 for Fe and 6.10 × 10⁻⁸ mol L-1 for Al. This method was
applied to the simultaneous determination of trace iron and aluminum in tap water, lake water, river water and tea leaves without separation and preconcentration. Contents of Fe and Al in tap water, lake water and river water were 3.13 × 10⁻⁷, 3.21 × 10⁻⁷, 2.74 × 10⁻⁷ mol L-1 for Fe and 1.31 × 10⁻⁶,
9.83 ×10⁻⁷, 1.43× 10⁻⁶ mol L-1 for Al, respectively. Tea leaves contained 3.10 × 10² μg g-1 Fe and
7.37 × 10² μg g-1 Al. Further research is required for understanding the catalytic mechanism of
iron and aluminum on this novel oxidation reaction.
Keywords: iron, aluminum, xylene cyanol FF, catalytic spectrophotometry
Introduction
In recent years, there has been a growing interest in understanding the physiological and toxicological role of iron and aluminum in plants, animals and humans. The deficiency of iron is the main cause of anemia, and aluminum is correlated with Alzheimer’s disease.1
Consequently, determination of iron and aluminum in environmental samples and foods is important.
Several techniques such as inductively coupled plasma mass spectrometry (ICP-MS),2 atomic emission
spectrometry (AES),3-6 atomic absorption spectrometry
(AAS)7-11 and chromatography12-14 have been reported for the
are the common limitations. In addition, the use of ICP-AES and AAS for the determination of aluminum in water samples may be restricted. Spectrophotometric methods have also been reported for the determination of iron or aluminum based on the complexation reactions between the chelating agents and iron or aluminum ions.15-17 However, these spectrophotometric methods
mentioned above are usually limited by the low sensitivity, posing dificulties for applications when the contents of iron and aluminum in samples are extremely low. Catalytic kinetics is becoming increasingly promising for the determination of trace or ultra-trace amounts of substances due to its high sensitivity, low costs and simplicity. Various kinetic methods have been reported for the determination of iron and aluminum.18-22 To
the best of our knowledge, however, few methods for simultaneous determination of aluminum and iron by catalytic kinetics have been reported. Additionally, the kinetic methods reported previously usually suffered from poor selectivity, which limited its application to real samples. In this work, a simple, selective and sensitive method for the simultaneous determination of iron and aluminum by catalytic spectrophotometry is presented, based on the catalytic effects of iron and aluminum on the reaction of xylene cyanol FF by hydrogen peroxide and potassium periodate.
Another novel and creative advance in this work is the use of two combined oxidants. The catalytic spectrophotometric methods for determination of species are usually based on the reactions of a dye by various oxidants.20,23-27 However, in those catalytic
spectrophotometric methods reported thus far, the oxidation reaction of dye was usually proceeded by one oxidant only. In this work, a catalytic spectrophotometric method based on the oxidation of xylene cyanol FF by double oxidants is presented. Xylene cyanol FF is an acid triphenylmethane dye used for histochemical staining of hemoglobin peroxidase and as a tracking dye for DNA sequencing in electrophoresis.28,29 In addition, it had also been used
for determination of nitrite by spectrophotometry.30 In
this work, both Fe and Al have no catalytic effect when oxidation reaction of Xylene cyanol FF is proceeded either by hydrogen peroxide or by potassium periodate. However, signiicant catalytic effects of both Fe and Al are obtained when hydrogen peroxide is added together with potassium periodate.
Therefore, an analytical method of catalytic spectrophotometry in the presence of two oxidants is presented in this work. This method was successfully applied to the simultaneous determination of iron and aluminum in environmental water and tea leaves without
preconcentration and separation due to its high sensitivity and selectivity. Although oxidation potential of two combined oxidation agents are usually higher than those of the individual oxidation agents, two combined oxidants so far have not been used to enhance the catalytic effect of catalysts on oxidation reaction of dyes. Hence, this work also presents a method to study more and better catalytic spectrophotometric methods by use of two or more oxidants.
Experimental
Reagents
All reagents used were of analytical grade. Redistilled water was used throughout.
A Fe3+ stock standard solution (1.79 × 10⁻² mol L-1
contained 1.0 mol L-1 sulfuric acid) was prepared by
dissolving 0.8606 g NH4Fe(SO4)2•12H2O (Huzhou Hushi
Chemical Factory, Huzhou, China) in 50 mL of 2.0 mol L-1
H2SO4 (Nanjing Chemicals Co., Ltd., Nanjing, China) and
diluting to 100 mL with water. Iron(III) working standard solutions were obtained by proper dilution of the stock solution.
An Al3+ stock standard solution (3.70 × 10⁻³ mol L-1
contained 1.0 mol L-1 sulfuric acid) was prepared by
dissolving 0.1757 g KAl(SO4)2•12H2O (Xingtai Lide
Chemicals Co., Ltd., Hebei, China) in 50 mL of 2.0 mol L-1
H2SO4 and diluting to 100 mL with water. Aluminum(III)
working standard solutions were obtained by proper dilution of the stock solution.
Nitric acid (Suzhou Jingrui Chemicals Co., Ltd., Suzhou, China) solution of 4 × 10⁻² mol L-1 and 9.90 mol L-1
solutionof hydrogen peroxide (Tianjin Damao Chemical Factory, Tianjin, China) were also prepared.
Xylene cyanol FF (Sigma, St. Louis, USA) solution of 1.0 × 10⁻³ mol L-1 was prepared by dissolving 0.1346 g
xylene cyanol FF and diluting to 250 mL with water. A standard solution of potassium periodate (1.0 × 10⁻² mol L-1) was prepared by dissolving 2.30 g KIO
4
(Guoyao Group Co., Shanghai, China) and then diluting to 1000 mL with water.
Apparatus
Recommended procedure
Into two 25 mL stoppered colorimetric tubes, both 0.55 mL of xylene cyanol FF solution and 0.80 mL of nitric acid were added. Then a suitable amount of standard or sample solution was added into only one tube. Next, volumes of 0.30 mL of hydrogen peroxide and 0.30 mL of potassium periodate were added into both tubes. After the solutions in both tubes were diluted to 25 mL, the contents were heated for 5 or 6 min at 100 °Cin a thermostated water bath. After the two tubes were cooled down to room temperature in running cold water, the absorbance (A) was measured at 610 nm with respect to water blank (A0 for
non-catalytic reaction and A for catalytic reaction). The difference value (∆A) between A0 and A was calculated.
Sample preparation
Tap water
Tap water was directly determined by following the recommended procedure.
Lake water and river water
Samples were collected and iltered through a 0.45 μm Millipore membrane ilter. Then, several drops of concentrated nitric acid were added and heated for 5 min at 100 °C in a thermostated water bath to digest the organics in samples. Afterwards, the pH was adjusted to 6.5-7.0 with dilute ammonia (Guoyao Group Co., Shanghai, China) and analytes were determined by following the recommended procedure.
Tea leaves
Tea leaves were ground into ine pieces and were dried in a forced-draft oven for 2 h at 80 °C. A suitable amount
ca. 1 g was accurately weighed into a small quartz crucible and pretreated as described in reference.31 Briely, the
sample was placed in a mufle furnace and heated to 500 °C for several hours to remove organic compounds. After being cooled to room temperature, a suitable amount of nitric acid solution was added to dissolve Fe and Al from the residue. The solution obtained was quantitatively transferred into a 100 mL volumetric lask and diluted to the mark with water. Iron and Al were then determined by following the recommended procedure.
Principle of determination
The kinetically catalytic reaction was given as the following:
After a given time interval, t, and provided that neither reagent was exhausted, the absorbance difference (∆A) could be expressed as follows:
∆At = k ∆[Xyl FF]t = K1t[Fe] + K2t[Al]
At times t1 and t2, ∆A should be:
∆At1 = K11 [Fe] + K21 [Al] and ∆At2 = K12 [Fe] + K22 [Al]
The conditional constants K11, K21, K12andK22 could be
determined in reaction systems catalyzed by Fe or Al only, with the aid of graphs of ∆A versus catalyst concentration at times t1 and t2. Therefore, the concentrations of catalysts
in the samples could be calculated by solving the above equations.
Results and Discussion
Absorption spectra
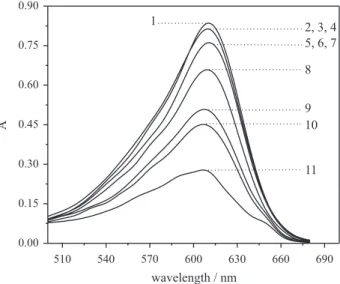
Figure 1 shows that xylene cyanol FF could be oxidized by potassium periodate slightly (curves 1 and 2), but was oxidized relatively well by hydrogen peroxide (curve 5). Iron and Al did not show any catalytic effects when xylene cyanol FF was oxidized either by potassium periodate or by hydrogen peroxide (curves 2, 3 and 4 and curves 5, 6 and 7). Comparing with the use of one oxidant only, the use of two combined oxidants could enhance the oxidation
Figure 1. Absorption spectra:1, Xyl FF + HNO3; 2, Xyl FF + HNO3 +
KIO4; 3, Xyl FF + HNO3 + KIO4+Fe3+; 4, Xyl FF + HNO
3 + KIO4 + Al3+;
5, Xyl FF + HNO3 + H2O2; 6, Xyl FF + HNO3 + H2O2 + Fe3+; 7, Xyl FF +
HNO3 + H2O2 + Al3+; 8, Xyl FF + HNO3 + KIO4 + H2O2; 9, Xyl FF +
HNO3 + KIO4 + H2O2 + Al3+; 10, Xyl FF + HNO
3 + KIO4 + H2O2 + Fe3+;
11, Xyl FF + HNO3 + KIO4 + H2O2 + Fe3+ + Al3+. t (reaction time) = 5 min,
CFe = 2.14 × 10⁻⁷ mol L-1, C
Al = 1.19 × 10⁻⁶ mol L-1. Other conditions were
of xylene cyanol FF (curve 8). The oxidation reaction of xylene cyanol FF by the two combined oxidants could be catalyzed by Al and Fe (curves 9 and 10). Higher catalytic effect was noted when the two catalysts were added together (curve 11). All solutions showed a maximum absorbance at 610 nm. Further measurements were therefore made at 610 nm.
Effect of temperature and reaction time
The experimental results showed that both rates of non-catalyzed and catalyzed reactions increased with temperature, ∆A increased with temperature and reached the highest value at 100 °C (Figure 2). The reaction was therefore carried out at 100 °C.
Figure 3 shows that ∆A increased with reaction time when the reaction time was lower than 7 min, and ∆A increased linearly with reaction time when the reaction
time was lower than 6 min. Therefore ∆A was determined at 5 and 6 min, because the sensitivities were high enough at these times.
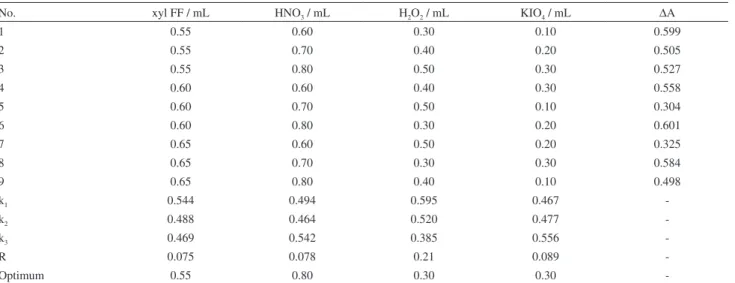
Optimization of the reagent concentrations
In the preliminary experiments, high ∆A values were obtained when xylene cyanol FF, nitric acid, hydrogen peroxide and potassium periodate were added in the following volume ranges: 0.55-0.65, 0.60-0.80, 0.30-0.50 and 0.10-0.30 mL, respectively. An orthogonal L9(3)
4 test
was then designed to establish the optimum conditions based on these preliminary experiments. As shown in Table 1, the orthogonal experiment was carried out with 4 factors and 3 levels, namely volume of xylene FF (0.55, 0.60, and 0.65 mL), volume of nitric acid (0.60, 0.70, and 0.80 mL), volume of hydrogen peroxide (0.30, 0.40, and 0.50 mL) and volume of potassium periodate (0.10, 0.20,
Figure 2. Inluence of temperature.t = 6 min, CFe = 2.14 × 10⁻⁷ mol L-1,
CAl = 1.19 × 10⁻⁶ mol L-1. Other conditions were those given in the
recommended procedure.
Figure 3. Influence of reaction time.CFe = 2.14 × 10⁻⁷ mol L-1,
CAl = 1.19 × 10⁻⁶ mol L-1. Other conditions were those given in the
recommended procedure.
Table 1. Results of orthogonal testsa
No. xyl FF / mL HNO3 / mL H2O2 / mL KIO4 / mL ∆A
1 0.55 0.60 0.30 0.10 0.599
2 0.55 0.70 0.40 0.20 0.505
3 0.55 0.80 0.50 0.30 0.527
4 0.60 0.60 0.40 0.30 0.558
5 0.60 0.70 0.50 0.10 0.304
6 0.60 0.80 0.30 0.20 0.601
7 0.65 0.60 0.50 0.20 0.325
8 0.65 0.70 0.30 0.30 0.584
9 0.65 0.80 0.40 0.10 0.498
k1 0.544 0.494 0.595 0.467
-k2 0.488 0.464 0.520 0.477
-k3 0.469 0.542 0.385 0.556
-R 0.075 0.078 0.21 0.089
-Optimum 0.55 0.80 0.30 0.30
-aReaction conditions: t= 6 min, C
and 0.30 mL). Although the maximum ∆A value was 0.601, the corresponding reaction conditions were not the optimum conditions. To obtain the optimum conditions, the values of k and R should be calculated. According to the R values in Table 1, the factors that inluenced the
∆A value could be listed in a decreasing order as follows: H2O2 > KIO4 > HNO3 > xyl FF.
The k values shown in Table 1 indicated that the optimum conditions were 0.55, 0.80, 0.30 and 0.30 mL for xylene cyanol FF, nitric acid, hydrogen peroxide and potassium periodate, respectively. ∆A was therefore determined under these optimum conditions for reaching the highest sensitivity.
Interference of foreign species
The effects of foreign species on the determination of 2.14 × 10⁻⁷ mol L-1 Fe and 1.19 × 10⁻⁶ mol L-1 Al were
studied. Tolerable concentrations of foreign species are shown in Table 2. The tolerance level was deined as the concentration of foreign specie that caused a variation lower than 5% in ∆A value. Table 2 shows that only Th interfered signiicantly, indicating that the developed method has good selectivity for determining Fe and Al. Furthermore, the interference of Th will be negligible since concentrations of Th in common samples are much lower than those of Fe and Al. Hence, this method could be applied to the determination of Fe and Al without preconcentration and separation processes.
Calibrations
Iron and Al solutions of different concentrations were measured using the reaction system under the optimum conditions mentioned above and ∆A was measured at 5 and 6 min. Linear calibration graphs were obtained from 3.57 × 10⁻⁸ to 3.57 × 10⁻⁷ mol L-1 for Fe and from
1.48 × 10⁻⁷ to 1.48 × 10⁻⁶ mol L-1 for Al, and the calibration
equations were derived as:
∆A(5 min) = 7.41 × 10 5 C
Fe + 2.20 × 10 5 C
Al− 0.010 ∆A(6 min) = 1.20 × 10⁶ CFe + 3.00 × 10⁵ CAl + 0.009
Five standard binary mixtures with different ratios of CFe/CAl were employed to perform experiments on recovery.
Each one was analyzed 6 times. Results are shown in Table 3. These results also showed that there were no interactions between Fe and Al.
The detection limits, based on the 3sb criterion (sb is
the concentration corresponding to the standard deviation obtained from determining blank solution 11 times), were 1.50 × 10⁻⁸ mol L-1 for Fe and 6.10 × 10⁻⁸ mol L-1 for Al.
Interaction between the two catalysts
The experimental results showed that ∆A value caused by the mixed catalysts (Fe and Al) is nearly equal to the total value of ∆A caused by Fe and Al only, and relative error was lower than 5%. These results indicated that the interactions between Fe and Al were negligible within certain concentrations. Therefore, the developed method could be used for the simultaneous determination of Fe and Al.
Table 2. Tolerance levels of foreign species in the determination of 2.14 × 10⁻⁷ mol L-1 Fe and 1.19 × 10⁻⁶ mol L-1 Al
Ion Tolerance level / (mol L-1) Ion Tolerance level / (mol L-1) Ion Tolerance level / (mol L-1)
NH4+ 1.11 × 10⁻² Bi3+ 1.91 × 10⁻⁴ Hg2+ 2.0 × 10⁻⁵
Ca2+ 1.0 × 10⁻² K+ 1.02 × 10⁻³ Ag+ 3.7 × 10⁻⁵
Mg2+ 8.23 × 10⁻³ Co2+ 6.80 × 10⁻⁴ UO
22+ 7.41 × 10⁻⁶
Cl− 5.63 × 10⁻³ Ni2+ 6.80 × 10⁻⁴ V5+ 3.92× 10⁻⁵
SO42− 2.08 × 10⁻³ As5+ 5.34 × 10⁻⁴ Sn2+ 6.74 × 10⁻⁶
NO3− 3.23 × 10⁻³ Mn2+ 1.45 × 10⁻⁴ Re3+ 5.71 × 10⁻⁶
Na+ 1.73 × 10⁻³ Cu2+ 1.25 × 10⁻⁴ Cr6+ 1.54 × 10⁻⁵
Ba2+ 2.91 × 10⁻⁴ Pb2+ 1.93× 10⁻⁵ Th4+ 8.62 × 10⁻⁸
Cd2+ 3.56 × 10⁻⁴ Zn2+ 6.12 × 10⁻⁵
Table 3. Test of accuracy and precision
Sample Added / (10-7mol L-1) Recovery / (%) RSD / (%)
Fe Al Fe Al Fe Al
1 2.14 1.48 99.5 103.4 1.97 3.83
2 1.43 1.48 98.6 97.2 1.83 2.52
3 1.43 3.00 102.9 102.3 2.33 2.67
4 2.14 11.9 101.1 98.6 2.05 2.11
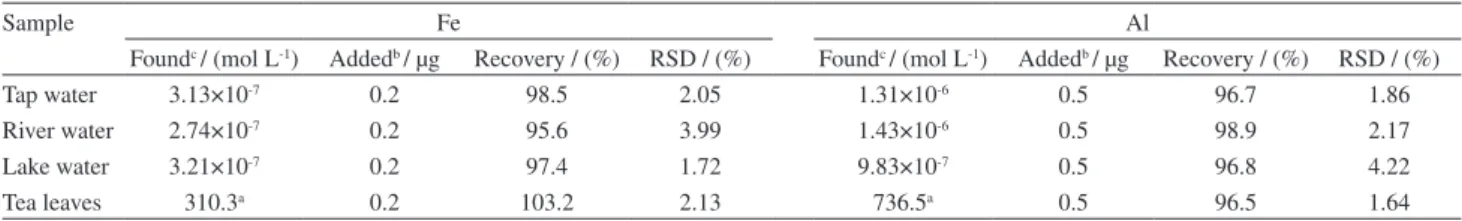
Applications
Owing to its high sensitivity and selectivity, the method here develoepd was applied to the determination of Fe and Al in water samples and tea leaves without any prior separation or preconcentration processes. Results are shown in Table 4.
Conclusions
In conclusion, a catalytic spectrophotometric method for the simultaneous determination of iron and aluminum is presented. This method is simple, sensitive and selective, and it was successfully applied to the simultaneous determination of Fe and Al in tap water, lake water, river water and tea leaves without prior separation and preconcentration. This method could also be applied to other samples due to its simplicity, sensitivity and selectivity.
Acknowledgments
This work was supported by the youth scientiic fund of Hanshan Normal University (Grants 413611 and 413615).
References
1. Fu, K. J.; Cao, G. H.; Xu, Y. G.; He, Q. S.; Human Vital Elements; Chinese Medicine Technology Press: Beijing, 1995.
2. Bianchi, F.; Careri, M.; Mafini, M.; Mangia, A.; Mucchino, C.; Rapid Commun. Mass Spectrom.2003, 17, 251.
3. Murillo, M.; Benzo, Z.; Marcano, E.; Gomez, C.; Garaboto, A.; Marin, C.;J. Anal. At. Spectrom. 1999, 14, 815.
4. Deng, L. P.; Chin. J. Anal. Lab. 2000, 19, 67.http://www.cnki. com.cn/article/cjfdtotal-fxsy200003022.htm.
5. Tangen, G.; Wickstrøm, T.; Lierhagen, S.; Vogt, R.; Lund, W.;
Environ. Sci. Technol. 2002, 36, 5421.
6. Peng, T. Y.; Jiang, Z. C.; Qin, Y. C.; J. Anal. At. Spectrom. 1999,
14, 1049.
7. Canfranc, E. ; Abarca, A. ; Sierra, I.; Marina, M. L.; J. Pharm. Biomed. Anal. 2001, 25, 103.
8. Wang, C.; Hao, Q. L.; Environ. Chem.1998, 17, 508.
Table 4. Determination of Fe and Al in samples
Sample Fe Al
Foundc / (mol L-1) Addedb / μg Recovery / (%) RSD / (%) Foundc / (mol L-1) Addedb / μg Recovery / (%) RSD / (%)
Tap water 3.13×10⁻⁷ 0.2 98.5 2.05 1.31×10⁻⁶ 0.5 96.7 1.86
River water 2.74×10⁻⁷ 0.2 95.6 3.99 1.43×10⁻⁶ 0.5 98.9 2.17
Lake water 3.21×10⁻⁷ 0.2 97.4 1.72 9.83×10⁻⁷ 0.5 96.8 4.22
Tea leaves 310.3a 0.2 103.2 2.13 736.5a 0.5 96.5 1.64
aμg g-1; bamount of Fe or Al added in 25 mL stoppered colorimetric tubes calculated from the added amount of standard solution before sample pretreatment; csampleconcentration without addition of standard solutions.
9. Zeiner, M.; Zödl, B.; Steffan, I.; Marktl, W.; Ekmekcioglu, C.;
Anal. Bioanal. Chem.2005, 382, 239.
10. Liu, H. W.; Peng, X. K.; Pan, Z. Q.; Bao, L. S.; Feng, J. L.;
Spectrosc. Spect. Anal.1994, 14, 89.
11. Wróbel, K.; Urbina, E. M. C.; Biol. Trace Elem. Res.2000, 78, 271. 12. Ruan, Y. P.; Liu, W. Y.; Tian, X. Q.; Zhao, H.; J. Xiamen Univ.,
Nat. Sci. Ed. 1995, 34, 582.
13. Eyama, T. S.; Uchiumi, A.; Chromatographia 1995, 40, 125. 14. Khuhawar, M. Y.; Lanjwani, S. N.; J. Chromatogr., A1996, 740,
296.
15. Stalikas, C. D.; Pappas, A. C.; Karayannis, M. I.; Veltsistas, P. G.; Microchim. Acta2003, 142, 43.
16. Rodrigues, J. L.; de Magalhães, C. S.; Luccas, P. O.; J. Pharm. Biomed. Anal. 2005, 36, 1119.
17. Pascual-Reguera, M. I.; Ortega-Carmona, I.; Molina-Díaz, A.;
Talanta1997, 44, 1793.
18. Kumar, T. N. K.; Revanasiddappa, H. D.; Anal. Bioanal. Chem.
2003, 376, 1126.
19. Hossein, T.; Ali, M.; Talanta1998, 47, 479.
20. Gong, R. M.; Chen, Q. Y.; Liu, Z. L.; Microchim. Acta 2003,
143, 53.
21. Yu, J. H.; Zhao, G. Q.; Chin. J. Anal. Lab.2000, 19, 50. 22. Blanco, M.; Coello, J.; Talanta1993, 40, 261.
23. Du, B.; Yan, T.; Liu, S. Y.; Wang, J.; Wei, Q.; J. Anal. Chem.
2007, 62, 794.
24. Mutaftchiev, K. L.; Chem. Pap. 2006, 60, 279.
25. Fukasawa, T.; Iwatsuki, M.; Kawakubo,S.; Mochizuki,M.;
Microchim. Acta1986, 90, 71.
26. Mohamed, A. A.; Fawy, K. F.; Anal. Sci.2001, 17, 769. 27. Sikalos, T. S.; Arabatzis, Y. M.; Prodromidis, M. I.; Veltsistas,
P. G.; Karayannis, M. I.; Microchim. Acta2000, 135, 197. 28. Maxam, A. M.; Gilbert, W.; Proc. Natl. Acad. Sci. U. S. A. 1977,
74,560.
29. Li, X. J.; Yang, X. P.; Qi, J.; Seeman, N. C.; J. Am. Chem. Soc.
1996, 118, 6131.
30. Dong, C. Z.; Chen, L. G.; Chin. J. Anal. Chem. 1998, 26, 858. 31. Jiang, G. B.; Pretreatment of Environmental Samples; Chinese
Chemical Engineering Press: Beijing,2004.