Printed version ISSN 0001-3765 / Online version ISSN 1678-2690 http://dx.doi.org/10.1590/0001-3765201820170607
www.scielo.br/aabc | www.fb.com/aabcjournal
Changes in microplanktonic protists assemblages promoted by the
thermocline induced stratification around an oceanic archipelago
ALEJANDRO E.S.F. DA COSTA1
, JANA R. DE SANTANA1,2
and SIGRID NEUMANN-LEITÃO1
1Laboratório de Zooplâncton, Museu de Oceanografia Prof. Petrônio Alves Coelho, Universidade Federal de Pernambuco, Avenida da Arquitetura, s/n, 50740-550 Recife, PE, Brazil 2Departamento de Ciências Humanas e Tecnologias, Universidade do Estado da Bahia,
Rua Professor Carlos Santos, 601, 47400-000 Xique-Xique, BA, Brazil
Manuscript received on August 4, 2017; accepted for publication on January 23, 2018
ABSTRACT
In the area around the archipelago of São Pedro e São Paulo (ASPSP), a set of small rocky islands in the Equatorial Atlantic, the thermocline begins at a more superficial depth than in the surrounding waters. This raises the question if there is any change in heterotrophic microplanktonic protists assemblages occurring in the surface mixed layer and in the subsurface layer. To answer this question, we sampled seawater in seven depths (between 1-100 m) with a 10L Niskin bottle and obtained temperature and salinity profiles with a CTD at eight sites around the ASPSP. The depth of the surface mixed layer varied between 18-63 meters. Dinoflagellates dominated in terms of abundance representing over 80% and 65% of the individuals found in the surface and subsurface layers, respectively. A PERMANOVA test revealed significant differences (p < 0.001) among the dinoflagellate and tintinnid assemblages occurring in both layers, but no evidence for difference in the radiolarian assemblage was detected. Good ecological indicators were found mainly within the dinoflagellate assemblage. The thermocline induced stratification allowed the development of different microplanktonic protists assemblages above and under the depth of the surface mixed layer in the upper 100 m of the water column.
Key words: Dinoflagellates, ecological indicators, polycystine radiolarians, tintinnid ciliates, tropical oceans, vertical distribution.
Correspondence to: Alejandro Esteweson Santos Faustino da Costa
E-mail: [email protected]
* Contribution to the centenary of the Brazilian Academy of Sciences.
INTRODUCTION
Tropical oceans are characterized by a strong and permanent thermocline, which inhibits the enrichment of the upper layers of the water column
by nutrient-rich deeper waters. Consequently, the upper layers of these ecosystems become depleted in nutrients in most of the extension of the tropical
oceanic waters. Under such conditions, the “typical
tropical structure” (Herbland and Voituriez 1979) is
formed and maintained, being modified only with sufficient nutrient flux to the upper layers (Cullen
1982).
column in well stratified waters, flourishing in certain
depths. Two striking features of oligotrophic oceans are the formation of a deep chlorophyll maximum (DCM) dominated by picophytoplanktonic cells and associated with the depth of the nitracline (Herbland et al. 1985, Partensky et al. 1996), and the occurrence of productivity maxima coinciding with or shallower than the depth of the DCM in regions with a permanent pycnocline (Longhurst and Harrison 1989). Diverse heterotrophic protists assemblages have been suggested as important consumers of the primary production, performing
a very important role in the flow of energy within
marine ecosystems, since they belong to a size class that is capable of feeding on pico- and nanoplanktonic cells and is still available to a wide range of metazoans (Sanders and Wickham 1993, Sherr and Sherr 1994, Calbet 2008) – characterizing the so called microbial loop (Azam et al. 1983). These protists assemblages are commonly associated with the primary producers and thus their vertical distribution is not uniform as well.
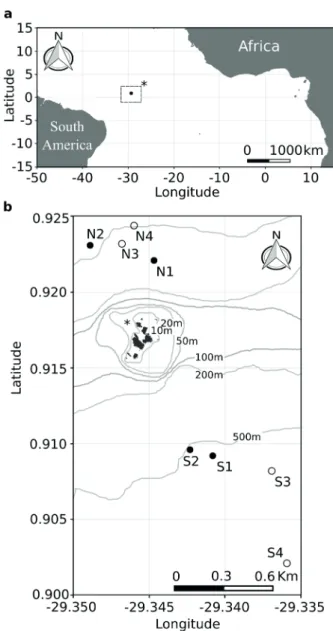
The archipelago of São Pedro e São Paulo (ASPSP) is composed of serpentinized and mylonitized peridotites islets (Campos et al. 2010), originated from a major uplift of the lithospheric mantle (Maia etal. 2016). The archipelago is under
the direct influence of two main current systems, the South Equatorial Current (SEC) flowing westward at the surface, and the Equatorial Under Current (EUC) flowing in the opposite direction at the
subsurface. Albeit the commonness of enrichment processes in surface waters around oceanic islands – e.g. local upwelling and the development of Taylor columns, among others – no enrichment process has ever been observed around the ASPSP (Bröckel and Meyerhöfer 1999, Travassos et al. 1999). Consequently, the waters surrounding the
archipelago are strongly stratified, with a surface
mixed layer (SML) separated by a permanent thermocline – and associated pycnocline – from deeper nutrient-rich waters. However, the SML is
considerably narrower around the ASPSP than in the surrounding oceanic waters. This raises the question if there is any change in the microplanktonic protists assemblages occurring in the narrow SML above the thermocline and in the subsurface layer (SSL) within the thermocline. We hypothesize that two assemblages may be found in the upper 100 meters depth of the water column, one typical of SML waters and other typical of SSL waters. If there is any change among these layers, indicator species of both layers shall be found. This is of great importance since studies related to the vertical distribution of microplanktonic protists assemblages in the tropical Atlantic are scarce (Dworetzky and Morley 1987, Boltovskoy etal. 1996).
MATERIALS AND METHODS
Samples were collected at seven depths (1, 10, 20, 30, 50, 75, and 100 m) of eight sites distributed at north (N sites) and south (S sites) of the ASPSP (Figure 1a, b) during April and November 2015, the maximum and minimum rainfall period, respectively. A 10-L Niskin bottle was used to collect the samples. The collected volume was gently passed from the bottle to a PVC tube
containing a 20 µm-mesh net fixed to its bottom to concentrate the sample on board of the “Transmar III” ship. The concentrates (~250 mL) were fixated with lugol’s iodine solution to a final concentration of 3%. A SonTek CastAWAY CTD was used to profile temperature and salinity from the surface to
a depth around 100 meters – the inferior limit of the equipment – in each site, to determine the depth of the top of the thermocline and to identify the water masses occurring at the sampled depths.
Prior to the analysis, the samples were left to
settle, and their content was gently siphoned off.
The whole volume of the concentrates was then analyzed using a Sedgwick-Rafter chamber and
compound microscopy under a magnification of
the sampling design. All the individuals in the samples were enumerated and identified to the lowest possible taxonomical unit according to classical taxonomic works – e.g. Wood (1963) and
Balech (1988), for dinoflagellates; Haeckel (1887), and Boltovskoy (1999) for radiolarians; Kofoid
and Campbell (1929) and Marshall (1969), for tintinnids. Foraminifers and aloricate ciliates were
counted but not identified.
The dinoflagellates, tintinnid ciliates and polycystine radiolarian assemblages were
investigated for differences among the SML and
SSL by means of a PERMANOVA (Anderson 2001). The PERMANOVA was performed with basis on a Bray-Curtis distance matrix calculated after the transformation of the biological data by the ln(X+1). An unconstrained ordination of the samples based on the Bray-Curtis distance matrix calculated for each one of the considered assemblages was performed using the method of the principal coordinate analysis (PCoA). To investigate the existence of indicator species associated with the SML and SSL, an indicator value analysis (Dufrêne and Legendre 1997) was
performed, and the significance of the relationships
was tested by means of a permutation test.
We estimated the species richness and the diversity for the pooled data of each layer in each site. Species richness was calculated as the absolute number of species and as the diversity index of Margalef (DMg). The diversity was calculated as the dominance/uniformity index of Simpson (D) and expressed as its reciprocal 1 – D, which is an
effective diversity measure. The measurements of
species richness and diversity were compared among the SML and SSL using the Mann-Whitney test.
All the statistical tests were performed using the R (R Core Team 2016) and RStudio Softwares.
RESULTS
ENVIRONMENTAL DATA
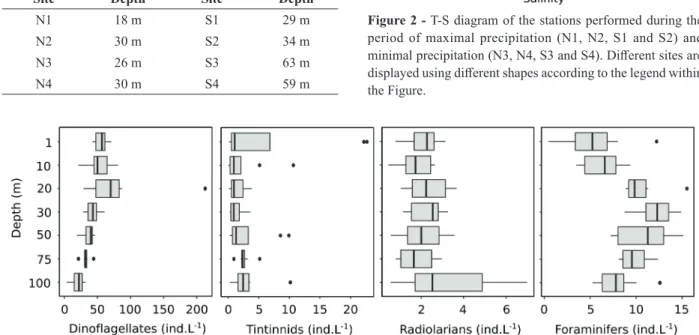
Sea surface temperature varied only between 27.2 ºC at N4 and S4 during the period of minimal precipitation and 28.1 ºC at S2 during the period of maximal precipitation. Sea surface salinity varied between 35.53 at S3 during the period of minimal precipitation, and 36.10 at N2 during the period of maximal precipitation. The depth of the onset of the thermocline varied between approx. 18 m at N1 during the period of maximal precipitation, and 63
m at S3 during the period of minimal precipitation (see Table I). A maximum of salinity close to the depth of the beginning of the thermocline was observed in many of the sites. Two water masses were sampled during the study, the Tropical Surface Water (TSW) and the South Atlantic Central Water (SACW) (Figure 2).
MICROPLANKTONIC PROTISTS ASSEMBLAGES
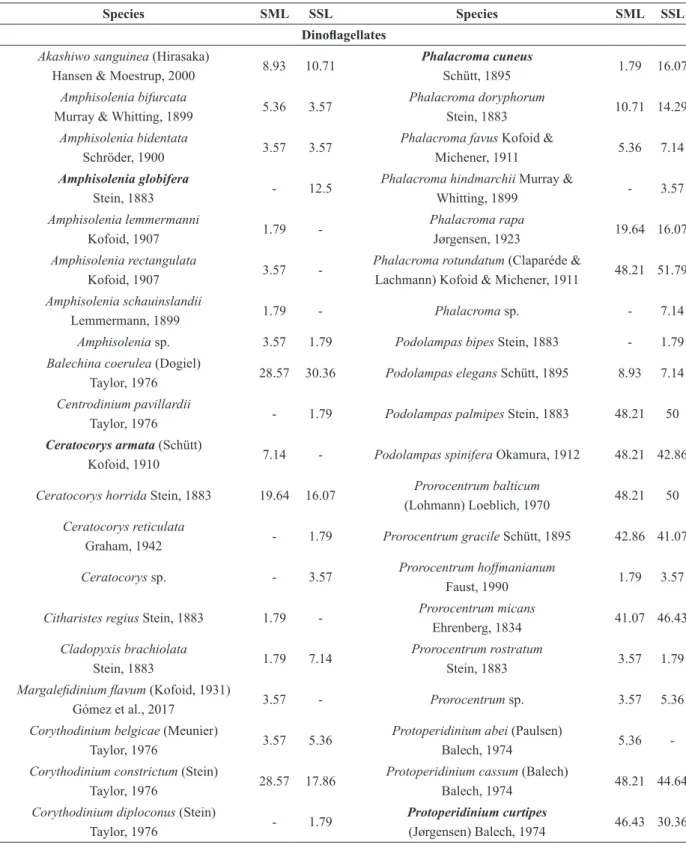
The dinoflagellates were the most abundant (Figure
3) and diverse group (Table II) among the protists
considered in this study; they represented 80.7% of
the total numberof individuals found in the SML,
65.8% of the individuals found in the SSL, and 124 identified species. The identification of very small
and delicate forms, which did not preserve well, was hindered and thus this number is underestimated by some degree. Tintinnid and aloricate ciliates, as
TABLE I
Approximate depth of the onset of the thermocline at
different sites and seasonal periods. Sites number 1 and 2
were sampled during the period of maximal precipitation, while sites number 3 and 4 were sampled during the
period of minimal precipitation.
Site Depth Site Depth
N1 18 m S1 29 m
N2 30 m S2 34 m
N3 26 m S3 63 m
N4 30 m S4 59 m
Figure 3 - Vertical distribution of the main microplanktonic protists assemblages in the upper 100 meters’ depth of the water column around the ASPSP.
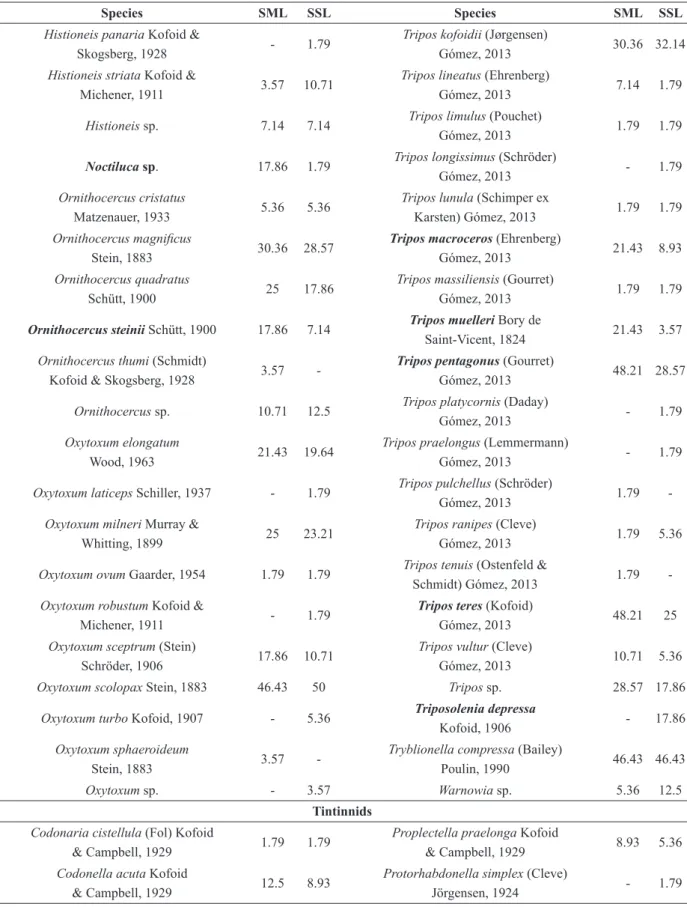
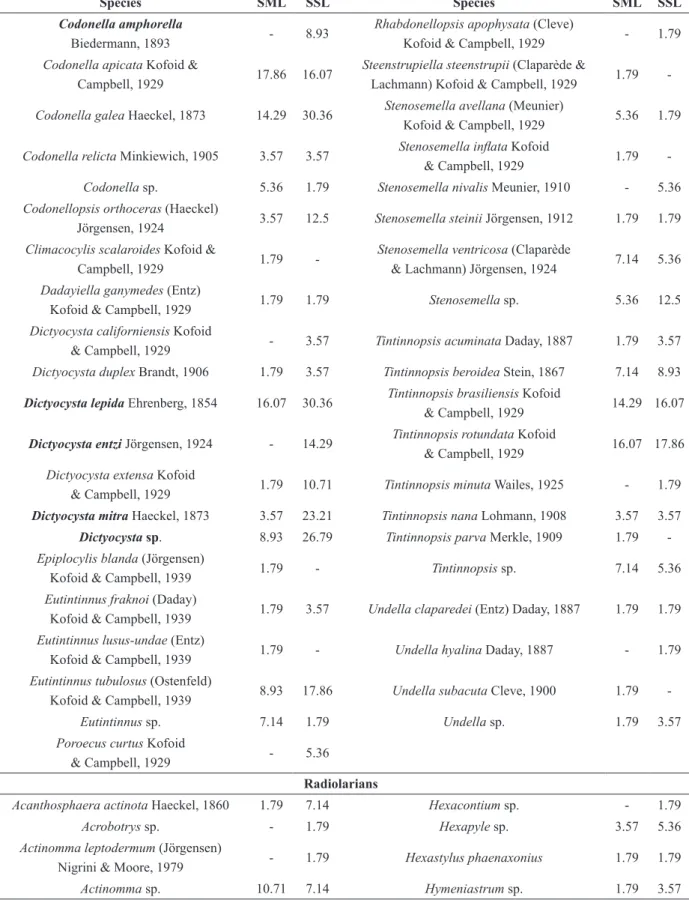
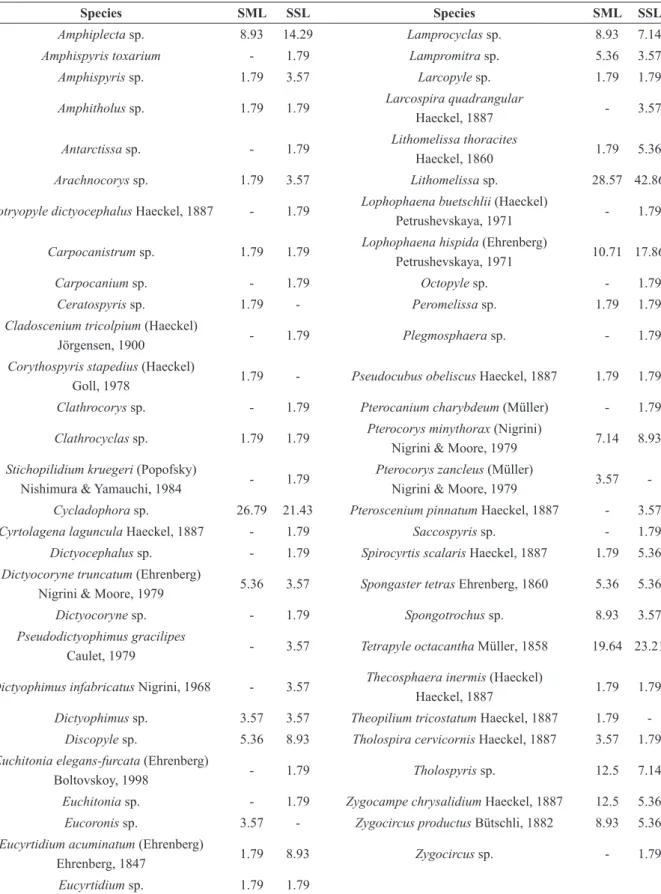
TABLE II
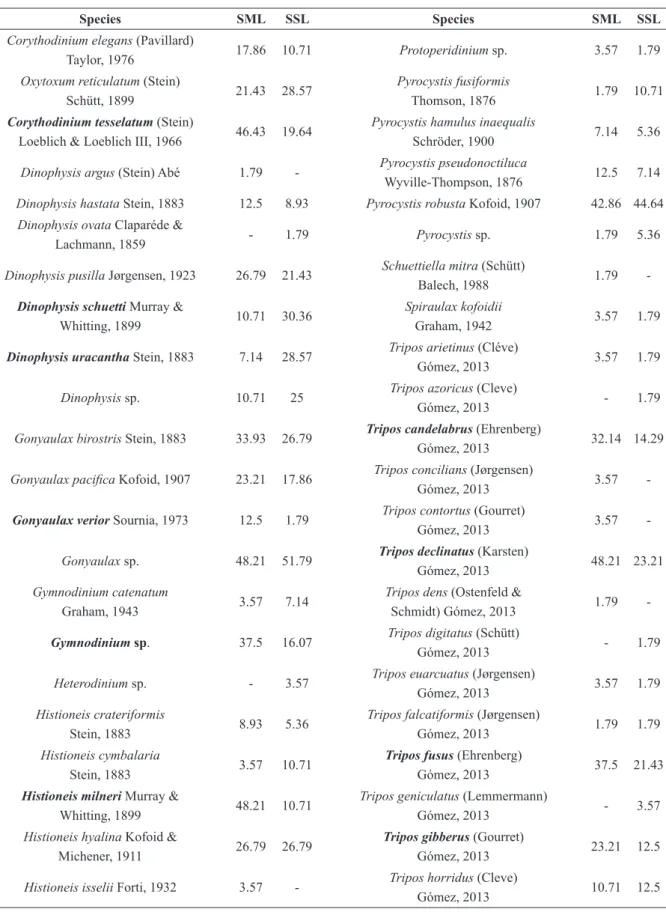
List of identified species found in the surface mixed layer (SML) and subsurface layer (SSL) around the ASPSP. Species in bold were classified as ecological indicators by the IndVal analysis. The numbers are frequency of occurrence in the
samples (%).
Species SML SSL Species SML SSL
Dinoflagellates
Akashiwo sanguinea (Hirasaka)
Hansen & Moestrup, 2000 8.93 10.71
Phalacromacuneus
Schütt, 1895 1.79 16.07
Amphisolenia bifurcata
Murray & Whitting, 1899 5.36 3.57
Phalacroma doryphorum
Stein, 1883 10.71 14.29
Amphisolenia bidentata
Schröder, 1900 3.57 3.57
Phalacroma favus Kofoid &
Michener, 1911 5.36 7.14
Amphisoleniaglobifera
Stein, 1883 - 12.5
Phalacroma hindmarchii Murray &
Whitting, 1899 - 3.57
Amphisolenia lemmermanni
Kofoid, 1907 1.79
-Phalacroma rapa
Jørgensen, 1923 19.64 16.07
Amphisolenia rectangulata
Kofoid, 1907 3.57
-Phalacroma rotundatum (Claparéde &
Lachmann) Kofoid & Michener, 1911 48.21 51.79 Amphisolenia schauinslandii
Lemmermann, 1899 1.79 - Phalacroma sp. - 7.14
Amphisolenia sp. 3.57 1.79 Podolampas bipes Stein, 1883 - 1.79
Balechina coerulea (Dogiel)
Taylor, 1976 28.57 30.36 Podolampas elegans Schütt, 1895 8.93 7.14
Centrodinium pavillardii
Taylor, 1976 - 1.79 Podolampas palmipes Stein, 1883 48.21 50
Ceratocorys armata (Schütt)
Kofoid, 1910 7.14 - Podolampas spinifera Okamura, 1912 48.21 42.86
Ceratocorys horrida Stein, 1883 19.64 16.07 Prorocentrum balticum
(Lohmann) Loeblich, 1970 48.21 50
Ceratocorys reticulata
Graham, 1942 - 1.79 Prorocentrum gracile Schütt, 1895 42.86 41.07
Ceratocorys sp. - 3.57 Prorocentrum hoffmanianum
Faust, 1990 1.79 3.57
Citharistes regius Stein, 1883 1.79 - Prorocentrum micans
Ehrenberg, 1834 41.07 46.43
Cladopyxis brachiolata
Stein, 1883 1.79 7.14
Prorocentrum rostratum
Stein, 1883 3.57 1.79
Margalefidinium flavum (Kofoid, 1931)
Gómez et al., 2017 3.57 - Prorocentrum sp. 3.57 5.36
Corythodinium belgicae (Meunier)
Taylor, 1976 3.57 5.36
Protoperidinium abei (Paulsen)
Balech, 1974 5.36
-Corythodinium constrictum (Stein)
Taylor, 1976 28.57 17.86
Protoperidinium cassum (Balech)
Balech, 1974 48.21 44.64
Corythodinium diploconus (Stein)
Taylor, 1976 - 1.79
Protoperidiniumcurtipes
Species SML SSL Species SML SSL
Corythodinium elegans (Pavillard)
Taylor, 1976 17.86 10.71 Protoperidinium sp. 3.57 1.79
Oxytoxum reticulatum (Stein)
Schütt, 1899 21.43 28.57
Pyrocystis fusiformis
Thomson, 1876 1.79 10.71
Corythodiniumtesselatum(Stein)
Loeblich & Loeblich III, 1966 46.43 19.64
Pyrocystis hamulus inaequalis
Schröder, 1900 7.14 5.36
Dinophysis argus (Stein) Abé 1.79 - Pyrocystis pseudonoctiluca
Wyville-Thompson, 1876 12.5 7.14
Dinophysis hastata Stein, 1883 12.5 8.93 Pyrocystis robusta Kofoid, 1907 42.86 44.64
Dinophysis ovata Claparéde &
Lachmann, 1859 - 1.79 Pyrocystis sp. 1.79 5.36
Dinophysis pusilla Jørgensen, 1923 26.79 21.43 Schuettiella mitra (Schütt)
Balech, 1988 1.79
-Dinophysisschuetti Murray &
Whitting, 1899 10.71 30.36
Spiraulax kofoidii
Graham, 1942 3.57 1.79
Dinophysisuracantha Stein, 1883 7.14 28.57 Tripos arietinus (Cléve)
Gómez, 2013 3.57 1.79
Dinophysis sp. 10.71 25 Tripos azoricus (Cleve)
Gómez, 2013 - 1.79
Gonyaulax birostris Stein, 1883 33.93 26.79 Triposcandelabrus (Ehrenberg)
Gómez, 2013 32.14 14.29
Gonyaulax pacifica Kofoid, 1907 23.21 17.86 Tripos concilians (Jørgensen)
Gómez, 2013 3.57
-Gonyaulaxverior Sournia, 1973 12.5 1.79 Tripos contortus (Gourret)
Gómez, 2013 3.57
-Gonyaulax sp. 48.21 51.79 Triposdeclinatus(Karsten)
Gómez, 2013 48.21 23.21
Gymnodinium catenatum
Graham, 1943 3.57 7.14
Tripos dens (Ostenfeld &
Schmidt) Gómez, 2013 1.79
-Gymnodiniumsp. 37.5 16.07 Tripos digitatus (Schütt)
Gómez, 2013 - 1.79
Heterodinium sp. - 3.57 Tripos euarcuatus (Jørgensen)
Gómez, 2013 3.57 1.79
Histioneis crateriformis
Stein, 1883 8.93 5.36
Tripos falcatiformis (Jørgensen)
Gómez, 2013 1.79 1.79
Histioneis cymbalaria
Stein, 1883 3.57 10.71
Triposfusus (Ehrenberg)
Gómez, 2013 37.5 21.43
Histioneismilneri Murray &
Whitting, 1899 48.21 10.71
Tripos geniculatus (Lemmermann)
Gómez, 2013 - 3.57
Histioneis hyalina Kofoid &
Michener, 1911 26.79 26.79
Triposgibberus(Gourret)
Gómez, 2013 23.21 12.5
Histioneis isselii Forti, 1932 3.57 - Tripos horridus (Cleve)
Gómez, 2013 10.71 12.5
Species SML SSL Species SML SSL
Histioneis panaria Kofoid &
Skogsberg, 1928 - 1.79
Tripos kofoidii (Jørgensen)
Gómez, 2013 30.36 32.14
Histioneis striata Kofoid &
Michener, 1911 3.57 10.71
Tripos lineatus (Ehrenberg)
Gómez, 2013 7.14 1.79
Histioneis sp. 7.14 7.14 Tripos limulus (Pouchet)
Gómez, 2013 1.79 1.79
Noctiluca sp. 17.86 1.79 Tripos longissimus (Schröder)
Gómez, 2013 - 1.79
Ornithocercus cristatus
Matzenauer, 1933 5.36 5.36
Tripos lunula (Schimper ex
Karsten) Gómez, 2013 1.79 1.79 Ornithocercus magnificus
Stein, 1883 30.36 28.57
Triposmacroceros (Ehrenberg)
Gómez, 2013 21.43 8.93
Ornithocercus quadratus
Schütt, 1900 25 17.86
Tripos massiliensis (Gourret)
Gómez, 2013 1.79 1.79
Ornithocercussteinii Schütt, 1900 17.86 7.14 Triposmuelleri Bory de
Saint-Vicent, 1824 21.43 3.57
Ornithocercus thumi (Schmidt)
Kofoid & Skogsberg, 1928 3.57
-Tripospentagonus (Gourret)
Gómez, 2013 48.21 28.57
Ornithocercus sp. 10.71 12.5 Tripos platycornis (Daday)
Gómez, 2013 - 1.79
Oxytoxum elongatum
Wood, 1963 21.43 19.64
Tripos praelongus (Lemmermann)
Gómez, 2013 - 1.79
Oxytoxum laticeps Schiller, 1937 - 1.79 Tripos pulchellus (Schröder)
Gómez, 2013 1.79
-Oxytoxum milneri Murray &
Whitting, 1899 25 23.21
Tripos ranipes (Cleve)
Gómez, 2013 1.79 5.36
Oxytoxum ovum Gaarder, 1954 1.79 1.79 Tripos tenuis (Ostenfeld &
Schmidt) Gómez, 2013 1.79
-Oxytoxum robustum Kofoid &
Michener, 1911 - 1.79
Triposteres(Kofoid)
Gómez, 2013 48.21 25
Oxytoxum sceptrum (Stein)
Schröder, 1906 17.86 10.71
Tripos vultur (Cleve)
Gómez, 2013 10.71 5.36
Oxytoxum scolopax Stein, 1883 46.43 50 Tripos sp. 28.57 17.86
Oxytoxum turbo Kofoid, 1907 - 5.36 Triposoleniadepressa
Kofoid, 1906 - 17.86
Oxytoxum sphaeroideum
Stein, 1883 3.57
-Tryblionella compressa (Bailey)
Poulin, 1990 46.43 46.43
Oxytoxum sp. - 3.57 Warnowia sp. 5.36 12.5
Tintinnids
Codonaria cistellula (Fol) Kofoid
& Campbell, 1929 1.79 1.79
Proplectella praelonga Kofoid
& Campbell, 1929 8.93 5.36
Codonella acuta Kofoid
& Campbell, 1929 12.5 8.93
Protorhabdonella simplex (Cleve)
Jörgensen, 1924 - 1.79
Species SML SSL Species SML SSL
Codonellaamphorella
Biedermann, 1893 - 8.93
Rhabdonellopsis apophysata (Cleve)
Kofoid & Campbell, 1929 - 1.79 Codonella apicata Kofoid &
Campbell, 1929 17.86 16.07
Steenstrupiella steenstrupii (Claparède &
Lachmann) Kofoid & Campbell, 1929 1.79
-Codonella galea Haeckel, 1873 14.29 30.36 Stenosemella avellana (Meunier)
Kofoid & Campbell, 1929 5.36 1.79
Codonella relicta Minkiewich, 1905 3.57 3.57 Stenosemella inflata Kofoid
& Campbell, 1929 1.79
-Codonella sp. 5.36 1.79 Stenosemella nivalis Meunier, 1910 - 5.36
Codonellopsis orthoceras (Haeckel)
Jörgensen, 1924 3.57 12.5 Stenosemella steinii Jörgensen, 1912 1.79 1.79
Climacocylis scalaroides Kofoid &
Campbell, 1929 1.79
-Stenosemella ventricosa (Claparède
& Lachmann) Jörgensen, 1924 7.14 5.36
Dadayiella ganymedes (Entz)
Kofoid & Campbell, 1929 1.79 1.79 Stenosemella sp. 5.36 12.5
Dictyocysta californiensis Kofoid
& Campbell, 1929 - 3.57 Tintinnopsis acuminata Daday, 1887 1.79 3.57
Dictyocysta duplex Brandt, 1906 1.79 3.57 Tintinnopsis beroidea Stein, 1867 7.14 8.93
Dictyocystalepida Ehrenberg, 1854 16.07 30.36 Tintinnopsis brasiliensis Kofoid
& Campbell, 1929 14.29 16.07
Dictyocystaentzi Jörgensen, 1924 - 14.29 Tintinnopsis rotundata Kofoid
& Campbell, 1929 16.07 17.86
Dictyocysta extensa Kofoid
& Campbell, 1929 1.79 10.71 Tintinnopsis minuta Wailes, 1925 - 1.79
Dictyocystamitra Haeckel, 1873 3.57 23.21 Tintinnopsis nana Lohmann, 1908 3.57 3.57
Dictyocysta sp. 8.93 26.79 Tintinnopsis parva Merkle, 1909 1.79
-Epiplocylis blanda (Jörgensen)
Kofoid & Campbell, 1939 1.79 - Tintinnopsis sp. 7.14 5.36
Eutintinnus fraknoi (Daday)
Kofoid & Campbell, 1939 1.79 3.57 Undella claparedei (Entz) Daday, 1887 1.79 1.79 Eutintinnus lusus-undae (Entz)
Kofoid & Campbell, 1939 1.79 - Undella hyalina Daday, 1887 - 1.79 Eutintinnus tubulosus (Ostenfeld)
Kofoid & Campbell, 1939 8.93 17.86 Undella subacuta Cleve, 1900 1.79
-Eutintinnus sp. 7.14 1.79 Undella sp. 1.79 3.57
Poroecus curtus Kofoid
& Campbell, 1929 - 5.36
Radiolarians
Acanthosphaera actinota Haeckel, 1860 1.79 7.14 Hexacontium sp. - 1.79
Acrobotrys sp. - 1.79 Hexapyle sp. 3.57 5.36
Actinomma leptodermum (Jörgensen)
Nigrini & Moore, 1979 - 1.79 Hexastylus phaenaxonius 1.79 1.79
Actinomma sp. 10.71 7.14 Hymeniastrum sp. 1.79 3.57
Species SML SSL Species SML SSL
Amphiplecta sp. 8.93 14.29 Lamprocyclas sp. 8.93 7.14
Amphispyris toxarium - 1.79 Lampromitra sp. 5.36 3.57
Amphispyris sp. 1.79 3.57 Larcopyle sp. 1.79 1.79
Amphitholus sp. 1.79 1.79 Larcospira quadrangular
Haeckel, 1887 - 3.57
Antarctissa sp. - 1.79 Lithomelissa thoracites
Haeckel, 1860 1.79 5.36
Arachnocorys sp. 1.79 3.57 Lithomelissa sp. 28.57 42.86
Botryopyle dictyocephalus Haeckel, 1887 - 1.79 Lophophaena buetschlii (Haeckel)
Petrushevskaya, 1971 - 1.79
Carpocanistrum sp. 1.79 1.79 Lophophaena hispida (Ehrenberg)
Petrushevskaya, 1971 10.71 17.86
Carpocanium sp. - 1.79 Octopyle sp. - 1.79
Ceratospyris sp. 1.79 - Peromelissa sp. 1.79 1.79
Cladoscenium tricolpium (Haeckel)
Jörgensen, 1900 - 1.79 Plegmosphaera sp. - 1.79
Corythospyris stapedius (Haeckel)
Goll, 1978 1.79 - Pseudocubus obeliscus Haeckel, 1887 1.79 1.79 Clathrocorys sp. - 1.79 Pterocanium charybdeum (Müller) - 1.79
Clathrocyclas sp. 1.79 1.79 Pterocorys minythorax (Nigrini)
Nigrini & Moore, 1979 7.14 8.93
Stichopilidium kruegeri (Popofsky)
Nishimura & Yamauchi, 1984 - 1.79
Pterocorys zancleus (Müller)
Nigrini & Moore, 1979 3.57
-Cycladophora sp. 26.79 21.43 Pteroscenium pinnatum Haeckel, 1887 - 3.57
Cyrtolagena laguncula Haeckel, 1887 - 1.79 Saccospyris sp. - 1.79
Dictyocephalus sp. - 1.79 Spirocyrtis scalaris Haeckel, 1887 1.79 5.36
Dictyocoryne truncatum (Ehrenberg)
Nigrini & Moore, 1979 5.36 3.57 Spongaster tetras Ehrenberg, 1860 5.36 5.36
Dictyocoryne sp. - 1.79 Spongotrochus sp. 8.93 3.57
Pseudodictyophimus gracilipes
Caulet, 1979 - 3.57 Tetrapyle octacantha Müller, 1858 19.64 23.21
Dictyophimus infabricatus Nigrini, 1968 - 3.57 Thecosphaera inermis (Haeckel)
Haeckel, 1887 1.79 1.79
Dictyophimus sp. 3.57 3.57 Theopilium tricostatum Haeckel, 1887 1.79
-Discopyle sp. 5.36 8.93 Tholospira cervicornis Haeckel, 1887 3.57 1.79
Euchitonia elegans-furcata (Ehrenberg)
Boltovskoy, 1998 - 1.79 Tholospyris sp. 12.5 7.14
Euchitonia sp. - 1.79 Zygocampe chrysalidium Haeckel, 1887 12.5 5.36
Eucoronis sp. 3.57 - Zygocircus productus Bütschli, 1882 8.93 5.36
Eucyrtidium acuminatum (Ehrenberg)
Ehrenberg, 1847 1.79 8.93 Zygocircus sp. - 1.79
Eucyrtidium sp. 1.79 1.79
well as radiolarians and foraminifers were present in relatively low numbers in comparison with
dinoflagellates. The tintinnid ciliates represented 3.9% of the individuals found in the SML, 6% of
the individuals found in the SSL, and a total of 45
identified species. Radiolarians represented 2.8% of the individuals found in the SML, 5% of the
individuals counted in the SSL, and a total of 65
identified species. Foraminifers represented 10.4% of the individuals in the SML, and 21.5% of the
individuals found in the SSL.
SURFACE MIXED LAYER (SML), SUBSURFACE LAYER (SSL), AND INDICATOR SPECIES
The difference among the SML and SSL was very
conspicuous in the dinoflagellate assemblage (PERMANOVA, p < 0.001; See Table III and Figure 4a) and was also observed in the tintinnid ciliates assemblage (PERMANOVA, p < 0.001; See Table III and Figure 4b). In both cases, the difference among the two layers was independent of the rainfall regime being considered. No evidence for
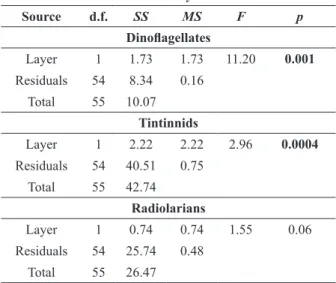
TABLE III
Results of the PERMANOVA analyses performed on the Bray-Curtis distance matrices of the dinoflagellate,
tintinnid ciliates, and radiolarian assemblages in the SML and SSL layers.
Source d.f. SS MS F p
Dinoflagellates
Layer 1 1.73 1.73 11.20 0.001
Residuals 54 8.34 0.16
Total 55 10.07
Tintinnids
Layer 1 2.22 2.22 2.96 0.0004
Residuals 54 40.51 0.75
Total 55 42.74
Radiolarians
Layer 1 0.74 0.74 1.55 0.06
Residuals 54 25.74 0.48
Total 55 26.47
Source - sources of variation; d.f. - degrees of freedom; SS - sequential sums of squares; MS - mean squares; F - F statistics;
p - p value.
differences in the radiolarian assemblage among the
two layers was found (Table III and Figure 4c) during any of the rainfall regimes. The PCoA ordination of
the dinoflagellate assemblage exhibited the clearest
distinction among the SML and SSL waters. A total
of 20 indicator species of dinoflagellates were found; 15 for the SML and five for the SSL waters (Table
IV). Five indicator species of tintinnid ciliates were found for the SSL waters (Table IV), but no tintinnid indicator of the SML was found. No radiolarian species was found to beindicator of the SML or SSL waters within the depth interval sampled. Vertical
profiles of two SML and two SSL indicator species
are presented in Figure 5.
SPECIES RICHNESS AND DIVERSITY
The influence of the thermocline in the species
richness and diversity differed among the considered
protists assemblages. In the dinoflagellate
assemblage, no difference in the species richness
(DMG) was found among both layers. Nevertheless,
the absolute number of species found in each layer
was significantly different with higher mean values
in the SML (t test, p < 0.01). Species diversity, as the Simpson index (D) was also different among both layers, with a higher mean value in the SML (t test, p < 0.001). In the tintinnid ciliates assemblage
only the absolute number of species was different
among the layers, with a higher mean value in the SSL (t test, p < 0.01). No difference in the absolute number of species, species richness (DMG), and diversity (D) among both layers was detected in the radiolarian assemblage. Table V displays mean values along with standard deviation for the absolute number of species found in each layer, species richness, and diversity of the three protists assemblages considered.
DISCUSSION
HYDROLOGY
The ASPSP is located at very low latitudes, being characterized by the presence of a permanent
TABLE IV
Indicator species determined by the Indicator Value analysis.
Surface Mixed Layer (SML) Subsurface Layer (SSL)
Species A B stat p Species A B stat p
Tripos declinatus 0.94 1 0.97 0.001 Dictyocysta lepida 0.93 0.59 0.74 0.004
Tripos teres 0.93 1 0.96 0.001 Dictyocysta sp. 0.93 0.52 0.70 0.002
Tripos pentagonus 0.90 1 0.95 0.001 Dinophysis uracantha 0.86 0.55 0.69 0.001
Histioneis milneri 0.88 1 0.94 0.001 Dinophysis schuetti 0.78 0.59 0.67 0.003
Corythodinium tesselatum 0.85 0.96 0.90 0.001 Dictyocysta mitra 0.97 0.45 0.66 0.002
Protoperidinium curtipes 0.83 0.96 0.90 0.001 Triposolenia depressa 1 0.35 0.59 0.001
Tripos fusus 0.81 0.78 0.79 0.001 Phalacroma cuneus 0.91 0.31 0.53 0.008
Tripos candelabrus 0.83 0.67 0.75 0.001 Dictyocysta entzi 1 0.28 0.53 0.004
Gymnodinium sp. 0.70 0.78 0.74 0.002 Tintinnina n.i. 0.83 0.31 0.51 0.021
Tripos muelleri 0.93 0.44 0.64 0.001 Amphisolenia globifera 1 0.24 0.49 0.010
Tripos macroceros 0.89 0.44 0.63 0.006 Codonella amphorella 1 0.17 0.41 0.045
Tripos gibberus 0.80 0.48 0.62 0.014
Noctiluca sp. 0.97 0.37 0.60 0.002
Ornithocercus steinii 0.86 0.37 0.56 0.018
Gonyaulax verior 0.88 0.26 0.48 0.021
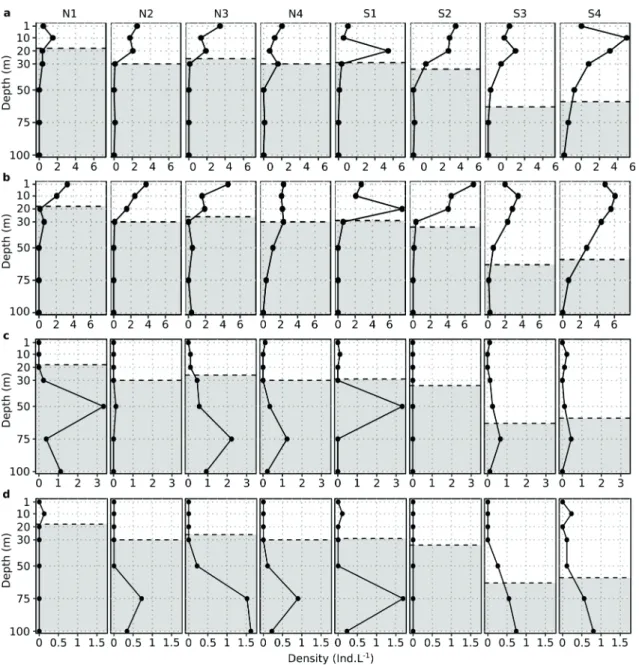
Figure 5 - Vertical profile of two indicator species of the SML, the dinoflagellate Tripos declinatus (a) and the dinoflagellate Tripos teres (b); and two indicator species of the SSL, the tintinnid ciliate Dictyocystalepida (c) and a non-identified Dictyocysta tintinnid ciliate (d). The SML was indicated exclusively by dinoflagellates, and the SSL by dinoflagellates and tintinnid ciliates.
TABLE V
Absolute number of species (n), Margalef species richness (D
MG), and Simpson diversity index (D) for the assemblages of
the dinoflagellates, tintinnid ciliates and polycystine radiolarians. Mean values ± standard deviation.
SML SSL
n DMG D n DMG D
Dinoflagellates 36 ± 7** 5.91 ± 1.1 0.92 ± 0.02*** 29 ± 10** 5.49 ± 1.4 0.85 ± 0.08*** Tintinnids 4 ± 3** 1.54 ± 0.64 0.59 ± 0.26 7 ± 3** 1.83 ± 0.84 0.64 ± 0.25
Radiolarians 6 ± 2 2.13 ± 0.68 0.75 ± 0.1 7 ± 3 2.42 ± 0.73 0.75 ± 0.1
thermocline, which inhibits the enrichment of
superficial waters by nutrient rich deeper waters.
Some authors have already investigated possible mechanisms of bottom-induced upwelling around the archipelago leading to the enrichment of the superficial waters and enhancement of the phytoplanktonic production, but such a process was never found in the area (Bröckel and Meyerhöfer 1999, Travassos etal. 1999).
Based on T-S pairs, at least two water masses were sampled during the study, the TSW and the SACW. The TSW forms the mixed layer of the tropical Atlantic Ocean and its lower limit is represented by the 20 ºC isotherm (Stramma and Schott 1999). According to the criterion of Stramma and Schott (1999), the TSW may be
identified as water with temperature higher than
20 ºC and salinity of at least 36. In both sampling periods – maximal and minimal precipitation – water of temperature above 20 ºC and salinity under 36 were observed in the upper layer of the water column. This water is out of the typical salinity of the TSW according to Stramma and Schott (1999) and was already observed in the archipelago area (Travassos etal. 1999, Medeiros etal. 2009a, b). High levels of precipitation are associated with the location of the ASPSP on very low latitudes at the Intertropical Convergence Zone, which contributes
to the slight dilution of the more superficial waters,
as already observed by Travassos etal. (1999). The inferior limit of the TSW was found around 80 meters in both periods. For the period of minimal precipitation this value is considerably shallower than the one observed by Medeiros etal. (2009a) around the ASPSP (105 meters).
VERTICAL DISTRIBUTION OF THE CONSIDERED ASSEMBLAGES
Several studies focusing on different planktonic
assemblages in the area around the ASPSP were realized (e.g. Macedo-Soares etal. 2012, Melo et al. 2012, 2014, Queiroz etal. 2015). These studies
focused mainly in phytoplanktonic and meso- and macrozooplanktonic assemblages. The ecology of microplanktonic heterotrophic protists such as ciliates, radiolarians and foraminifers remain poorly known especially in the tropical latitudes of the South Atlantic Ocean.
The low density of individuals per liter observed for the protistan assemblages considered in this study is characteristic of oligotrophic ecosystems.
The dinoflagellates were the most abundant group.
These organisms have the competitive advantage of migrating vertically in the water column so that they can access deeper waters richer in nutrients, store it within the cell, and move upward to the sunlit surface waters where photosynthesis is possible (Ji and Franks 2007). Although the determination
of the trophic mode of the identified dinoflagellate
species was not possible during the examination of the samples, we do know from the literature that
several of the identified genus are mixotrophs, e.g.
Dinophysis (Jacobson and Andersen 1994), Tripos (Smalley et al. 2003), Ornithocercus, Histioneis, Amphisolenia and Triposolenia (Tarangkoon et al. 2010), and that mixotrophy is highly important in oligotrophic regions (Tarangkoon et al. 2010, Stoecker et al. 2017). Thus, it would be expected for these organisms to present an uneven vertical distribution of abundance, which was indeed observed. The dinoflagellates exhibited higher densities at 20 meters. This depth was, in general, associated with the beginning of the thermocline and thus a density gradient. According to Blasco (1978) even a weak density gradient could lead to
a concentration of the abundance of dinoflagellates
on certain depths by limiting the maximum distance that they would be able to swim. The increase in the density from the base of the surface mixed layer at the depth of the onset of the thermocline could then be acting as a barrier to the dispersal of the
dinoflagellates in the water column.
primary producers. The foraminifers are known to be more abundant in the deep chlorophyll maximum layer (DCM), which constitutes a major food source very well exploited by the planktonic foraminifera (Fairbanks and Wiebe 1980, Fairbanks etal. 1982). Although it was not possible to measure the chlorophyll content in the water column, previous works have demonstrated that the chlorophyll content is higher in deeper waters at the base of the euphotic zone in the ASPSP (Bröckel and Meyerhöfer 1999, Souza et al. 2013). Cordeiro et al. (2013) found increasing concentrations of chlorophyll with increasing depth of the water column from ~25 meters to the DCM layers between the depths of 50 and 100 meters in the waters around oceanic islands of the Equatorial Western Atlantic Ocean. If this picture remains the same for the ASPSP, the higher abundances of the foraminifers between the depths of 20 and 100 meters could be explained by the higher concentration of chlorophyll under the surface mixed layer, increasing until a DCM at the base of the euphotic zone.
The higher density values found for tintinnid ciliates at surface is consistent with the fact that, although these organisms have a broad vertical span in the oceans – with some species occurring
below 600 m (Kršinić 1982) –, they are typically
surface-dwelling planktonic organisms, as also observed by Thompson etal. (1999). The observed density values are, however, lower than the average 25 ind.L-1 observed by Dolan (2000) in the Mediterranean Sea, and closer to the average 11.5 ind.L-1 observed in the South Atlantic by Thompson et al. (1999). In the tropical SE Pacific
Ocean, Dolan et al. (2007) observed higher mean tintinnid abundances ranging from 2-42 ind.L-1. Unfortunately we were not able to obtain cholorophyll-a estimates but available data for the NW Tropical South Atlantic suggest that the chl-a concentrations range from 0.05-0.87 µg.L-1 in the
first 100 meters of the water column (Cordeiro et
al. 2013, Jales et al. 2015), which are considerably lower than the other cited areas. This suggests that the highly oligotrophic nature of the waters around the ASPSP restrain the development of the tintinnid assemblage and keeps the abundance values low.
The radiolarians are not well studied in the Atlantic Ocean, with just a few published studies (e.g. Dworetzky and Morley 1987, Thompson et al. 1999). Our density values were close to the ones found by Thompson etal. (1999) in the South Atlantic Ocean. The slight increase in density at 100 m closely matches the depth of maximum density observed by some authors for colonial
and polycystine radiolarians in the Pacific Ocean,
around 85-100 m (Dennet et al. 2002, Zasko and Rusanov 2005).
THE PLANKTONIC ASSEMBLAGES AND THE SML AND SSL LAYERS
The stratification of the water column exerted
an important influence in the dinoflagellates and
tintinnid ciliates assemblages, as illustrated by the PCoA ordination diagrams. The differences among both layers are clear in terms of species composition, diversity, and richness.
The indicator value analysis revealed 27 indicator species for the SML and SSL. From
these, six dinoflagellate species may be considered
good indicators of the surface mixed layer, namely Tripos declinatus, T. teres, T. pentagonus, Histioneis milneri, Protoperidinium curtipes, and Corythodinium tesselatum. Half of these species belong to the genus Tripos. Species within this genus have historical importance as ecological indicators
(Frost and Wilson 1938, Graham 1941), and have
recently been suggested as a potential candidate of ecological indicator of ocean warming (Tunin-Ley and Lemée 2013), mainly because of its ubiquity
information available for the vertical distribution of these species in the ASPSP is that they occur
in the first 100 meters. T. teres was already found exclusively in surface, T. pentagonus in surface, 50 meters’ depth, and in the DCM, and Corythodinium tesselatum in surface and 50 meters’ depth in the ASPSP (Queiroz et al. 2015). It is important to highlight that these authors collected samples at a greater distance from the archipelago and thus found the thermocline deeper than the depths reported here.
In the vertical distribution of T. declinatus and T. teres presented in Figure 5 it is very clear that these species present the highest values of density within the SML, and low values (if present at all) within the SSL. The fact that we have found these species with higher density values almost exclusively within the SML does not mean, however, that they do not occur in deeper layers. Baek et al. (2009) demonstrated that different species of the genus Tripos may perform diel vertical
migration (DVM) in different degrees. The vertical distribution of a species is influenced by its DVM
pattern. Some authors have already observed that
DVM in dinoflagellates and other phytoplanktonic
organisms is associated with a circadian rhythm in which the cells usually move downwards to deeper waters with higher nutrient availability during dark periods and upwards to the sunlit surface layer during light periods (Eppley et al. 1968, Baek etal. 2009). However, as stated by Blasco (1978), a minimal density gradient is sufficient
to limit the vertical dispersion of dinoflagellates.
The shallower depth of onset of the thermocline and associated pycnocline around the ASPSP may function as a barrier to the vertical dispersion of the dinoflagellates. Hence, our observations on different dinoflagellate species being ecological indicators of the SML and SSL are valid.
The best indicators of the SSL were the tintinnid ciliates Dictyocysta lepida, D. mitra and
a non-identified Dictyocysta species. The vertical
distribution of the Dictyocysta species shows clearly that D. lepida presented higher density values between 50-75 m, while D. mitra presented peak densities between 75-100 m. The latter species was already observed as an important component of the tintinnid assemblage between the depths of 50-100 m in an oligotrophic oceanic region at
the South Adriatic Sea (Kršinić 1998, Kršinić and Grbec 2006). In the South Atlantic, Thompson etal. (1999) found mean average depth values of 45 and 27 meters for D. lepida and D. mitra, respectively. These values are shallower than the depth interval in which we found the peak densities of both species. However, hydrographical characteristics
are completely different in their area of study, with
much cooler water temperatures being found around
25-50 meters. This could explain the difference in
the depth of the peak densities for both species. The dinoflagellate assemblage was richer in species and more diverse in the SML. It was expected since photoptrophy and mixotrophy are common features among dinoflagellate species (Hansen 2011), which make these organisms more abundant in the sunlit surface waters. The higher species richness found in the SSL for the tintinnid ciliates assemblage could be related to the sinking of individuals or tintinnid loricae from the SML. This artifact was already observed by Thompson etal. (1999). However, we have found a considerable proportion of the species to be
specific for a determined layer. In the case of the tintinnids, for example, 35.6% of the 38 species were exclusively found in one layer. At least 30.6% of the dinoflagellates were exclusively found in
one of the layers and this pattern was particularly well observed in the radiolarians assemblage, since
46.2% of the identified species occurred exclusively
corroborates the validity of the diversity patterns observed around the ASPSP.
We conclude that the different assemblages were affected in different ways by the presence
of the permanent thermocline. The dinoflagellates
exhibited the most pronounced shift in the structure of the assemblage, with good ecological indicator species for the SML, as well as higher species richness and diversity in this layer. The tintinnid ciliates assemblage is richer in species in the SSL and exhibited a few good ecological indicator
species for this layer. No influence in the radiolarians
assemblage in the upper 100 meters’ depth interval was detected, although a trend towards an increase in density with depth was observed.
ACKNOWLEDGMENTS
This work was supported by the Conselho Nacional de Desenvolvimento Científico e Tecnológico (CNPq - grant number 405499/2012-4). We would like to thank the Coordenação de Aperfeiçoamento de Pessoal de Nível Superior (CAPES) for the PhD scholarship provided to AESFC, and to the CNPq for the PhD scholarship provided to JRS. We also thank the Brazilian Navy, the Comissão Interministerial para Recursos do Mar (CIRM), and
the crew of the “Transmar III” ship for the logistic
support. Special thanks to the biologists, which
cordially assisted us in the field (Aislan G. Cunha,
Renata P. S. Campelo, Patrícia S. B. Dantas, and Rafael S. Dantas) and in the logistics (Dr. Ralf Schwamborn, Dr. Manuel J. Flores-Montes, and
Dr. Felipe Gaspar).
REFERENCES
ANDERSON MJ. 2001. A new method for non-parametric multivariate analysis of variance. Austral Ecol 26: 32-46. AZAM F, FENCHEL T, FIELD JG, GRAY JS, MEYER-REIL
LA AND THINGSTAD F. 1983. The ecological role of water-column microbes in the sea. Mar Ecol Prog Ser 10: 257-263.
BAEK SH, SHIMODE S, SHIN K, HAN M-S AND KIKUCHI T. 2009. Growth of dinoflagellates, Ceratium furca and
Ceratium fusus in Sagami Bay, Japan: the role of vertical migration and cell division. HarmfulAlgae 8: 843-856. BALECH E. 1988. Los Dinoflagelados del Atlantico
Sudoccidental. Publ Espec Inst Espan Ocenogr 1: 1-310. BLASCO D. 1978. Observations on diel migration of marine
dinoflagellates off the Baja California Coast. Mar Biol 46: 41-47.
BOLTOVSKOY D. 1999. South Atlantic Zooplankton. Leiden: Backhuys Publishers 1: 1-868.
BOLTOVSKOY D, OBERHÄNSLI H AND WEFER G. 1996. Radiolarian assemblages in the eastern tropical Atlantic: patterns in the plankton and in sediment trap samples. J Mar Sist 8: 31-51.
BRÖCKEL K AND MEYERHÖFER M. 1999. Impact of the rocks of São Pedro e São Paulo upon the quantity and quality of suspended particulate organic matter. Arch Fish Mar Res 47: 223-238.
CALBET A. 2008. The trophic roles of microzooplankton in marine systems. ICES J Mar Sci 65: 325-331.
CAMPOS TFC, BEZERRA FHR, SRIVASTAVA NK, VIEIRA MM AND VITA-FINZI C. 2010. Holocene tectonic uplift of the St Peter and St Paul rocks (Equatorial Atlantic) consistent with emplacement by extrusion. Mar Geol 271: 177-186.
CORDEIRO TA, BRANDINI FP, ROSA RS AND SASSI R. 2013. Deep chlorophyll maximum in Western Equatorial Atlantic – How does it interact with island slopes and seamounts? MarineScience 3: 30-37.
CULLEN JJ. 1982. The deep chlorophyll maximum: comparing vertical profiles of chlorophyll-a. Can J Fish Aquat Sci 39: 791-803.
DENNET MR, CARON DA, MICHAELS AF, GALLAGER SM AND DAVIS CS. 2002. Video plankton recorder reveals high abundances of colonial Radiolaria in surface waters of the central North Pacific. J Plankton Res 24: 797-805.
DOLAN JR. 2000. Tintinnid ciliate diversity in the Mediterranean Sea: longitudinal patterns related to water column structure in late spring-early summer. Aquat Microb Ecol 22: 69-78.
DOLAN JR, RITCHIE ME AND RAS J. 2007. The “neutral” community structure of planktonic herbivores, tintinnid ciliates of the microzooplankton, across the SE Tropical Pacific Ocean. Biogeosciences Discuss 4: 461-593. DUFRÊNE M AND LEGENDRE P. 1997. Species assemblages
and indicator species: the need for a flexible asymmetrical approach. Ecol Monogr 67: 345-366.
EPPLEY RW, HOLM-HANSEN O AND STRICKLAND JDH. 1968. Some observations on the vertical migration of dinoflagellates. J Phycol 4: 333-340.
FAIRBANKS RG, SVERDLOVE M, FREE R, WIEBE PH AND BÉ AWH. 1982. Vertical distribution and isotopic fractionation of living planktonic foraminifera from the Panama Basin. Nature 298: 841-844.
FAIRBANKS RG AND WIEBE PH. 1980. Foraminifera and chlorophyll maximum: vertical distribution, seasonal succession, and paleoceanographic significance. Science 209: 1524-1526.
FROST N AND WILSON AM. 1938. The genus Ceratium and its use as an indicator of hydrographic conditions in the Newfoundland waters. Newfoundland Res Bull 5: 1-15. GRAHAM HW. 1941. An oceanographic consideration of the
dinoflagellate genus Ceratium. Ecol Monogr 11: 99-116. HAECKEL E. 1887. Report on the Radiolaria collected by
H.M.S. Challenger. Scientific results of the voyage of H.M.S. Challenger during the years 1873-1876. Zoology, Volume XVIII. First Part.
HANSEN PJ. 2011. The role of photosynthesis and food uptake for the growth of marine mixotrophic dinoflagellates. J Eukaryotic Microbiol 58: 203-214.
HERBLAND A, LE BOUTEILLER A AND RAIMBAULT P. 1985. Size structure of phytoplankton biomass in the equatorial Atlantic Ocean. Deep Sea Res 32 (Part I): 819-836.
HERBLAND A AND VOITURIEZ B. 1979. Hydrological structure analysis for estimating the primary production in the tropical Atlantic Ocean. J Mar Res 37: 87-101. JACOBSON DM AND ANDERSEN RA. 1994. The discovery
of mixotrophy in photosynthetic species of Dinophysis
(Dinophyceae): light and electron microscopical observations of food vacuoles in Dinophysis acuminata,
D. norvegica and two heterotrophic dinophysoid dinoflagellates. Phycologia 33: 97-110.
JALES MC, FEITOSA FAN, KOENING ML, MONTES MJF, ARAÚJO FILHO MC AND SILVA RA. 2015. Phytoplankton biomass dynamics and environmental variables around the Rocas Atoll Biological Reserve, South Atlantic. Braz J Oceanogr 63: 443-454.
JI R AND FRANKS PJS. 2007. Vertical migration of dinoflagellates: model analysis of strategies, growth, and vertical distribution patterns. Mar Ecol Prog Ser344: 49-61.
KOFOID CA AND CAMPBELL AS. 1929. A Conspectus of marine and fresh-water Ciliata belonging to the suborder Tintinnoinea, with descriptions of new species principally from the Agassiz expedition to the eastern Tropical Pacific 1904-1905. Univ Calif Publ Zool 34: 1-403.
KRŠINIĆ F.1982. On vertical distribution of tintinnines (Ciliata, Oligotrichida, Tintinnina) in the open waters of the South Adriatic. Mar Biol 68: 83-90.
KRŠINIĆ F. 1998. Vertical distribution of protozoan and microcopepod communities in the South Adriatic Pit. J Plankton Res 20: 1033-1060.
KRŠINIĆ F AND GRBEC B. 2006. Horizontal distribution of tintinnids in the open waters of the South Adriatic (Eastern Mediterranean). Sci Mar70: 77-88.
LONGHURST AR AND HARRISON WG. 1989. The biological pump: profiles of plankton production and consumption in the upper ocean. Prog Oceanogr 22: 47-123.
MACEDO-SOARES LCP, FREIRE AS AND MUELBERT JH. 2012. Small-scale spatial and temporal variability of larval fish assemblages at an isolated oceanic island. Mar Ecol Prog Ser 444: 207-222.
MAIA M ET AL. 2016. Extreme mantle uplift and exhumation along a transpressive transform fault. Nat Geosci 9: 619-623.
MARSHALL SM. 1969. Protozoa: Order Tintinnida. Counseil International pour l’Exploration de la Mer, Fiches d’Identification de Zooplancton, p. 117-127.
MEDEIROS C, ARAÚJO M, FREITAS I AND ROLLNIC M. 2009a. Massas d’água da região oeste do Atlântico tropical. In: Hazin FHV (Ed), Meteorologia e Sensoriamento Remoto, Oceanografia Física, Oceanografia Química e Oceanografia Geológica. Fortaleza: Martins e Cordeiro 1: 56-69.
MEDEIROS C, ARAÚJO M, ROLLNIC M AND FREITAS I. 2009b. Estrutura termohalina da região Oeste do Atlântico Tropical – ZEE/NE. In: Hazin FHV (Ed), Meteorologia e Sensoriamento Remoto, Oceanografia Física, Oceanografia Química e Oceanografia Geológica. Fortaleza: Martins e Cordeiro 1: 40-55.
MELO PAMC, DIAZ XFG, MACEDO SJ AND NEUMANN-LEITÃO S. 2012. Diurnal and spatial variation of the mesozooplankton community in the Saint Peter and Saint Paul Archipelago, Equatorial Atlantic. Mar Biodivers Rec 5: 1-14.
MELO PAMC, MELO JR M, MACÊDO SJ, ARAÚJO M AND NEUMANN-LEITÃO S. 2014. Copepod distribution and production in a Mid-Atlantic Ridge archipelago. An Acad Bras Cienc 86: 1678-2690.
PARTENSKY F, BLANCHOT J, LANTOINE F, NEVEUX J AND MARIE D. 1996. Vertical structure of picophytoplankton at different trophic sites of the tropical northeastern Atlantic Ocean.Deep Sea Res 43 (Part I): 1191-1213.
QUEIROZ AR, MONTES MF, MELO PAMC, SILVA RA AND KOENING ML. 2015. Vertical and horizontal distribution of phytoplankton around an oceanic archipelago of the Equatorial Atlantic. Mar Biodivers Rec 8: 1-13.
SANDERS RW AND WICKHAM SA. 1993. Planktonic protozoa and metazoa: predation, food quality and population control. Mar Microb Food Webs 7: 197-223. SHERR EB AND SHERR BF. 1994. Bacterivory and
herbivory: key roles of phagotrophic protists in pelagic food webs. Microb Ecol 28: 223-235.
SMALLEY GW, COATS DW AND STOECKER DK. 2003. Feeding in the mixotrophic dinoflagellate Ceratium furca
is influenced by intracellular nutrient concentrations. Mar Ecol Prog Ser 262: 137-151.
SOUZA CS, LUZ JAG, MACEDO S, FLORES-MONTES MJ AND MAFALDA JR P. 2013. Chlorophyll-a and nutrient distribution around seamounts and islands of the Tropical South-Western Atlantic. Mar Freshwater Res 64: 168-184. STOECKER DK, HANSEN PJ, CARON DA AND MITRA A.
2017. Mixotrophy in the marine plankton. Annu Rev Mar Sci 9: 311-335.
STRAMMA L AND SCHOTT F. 1999. The mean flow field of the tropical Atlantic Ocean. Deep Sea Res 46 (Part II): 279-303.
TARANGKOON W, HANSEN G AND HANSEN PJ. 2010. Spatial distribution of symbiont-bearing dinoflagellates
in the Indian Ocean in relation to oceanographic regimes. Aquat Microb Ecol 58: 197-213.
THOMPSON GA, ALDER VA, BOLTOVSKOY D AND BRANDINI F. 1999. Abundance and biogeography of tintinnids (Ciliophora) and associated microzooplankton in the Southwestern Atlantic Ocean. J Plankton Res 21: 1265-1298.
TRAVASSOS P, HAZIN FHV, ZAGAGLIA JR, ADVÍNCULA R AND SCHOBER J. 1999. Thermohaline structure around seamounts and islands off North-Eastern Brazil. Arch Fish Mar Res 47: 211-222.
TUNIN-LEY A AND LEMÉE R. 2013. The genus Neoceratium
(planktonic dinoflagellates) as a potential indicator of ocean warming. Microorganisms 1: 58-70.
WOOD EJF. 1963. Dinoflaglellates in the Australian region. II. Recent collections. Div Fish Oceanogr Tech Pap14: 509-563.