Estimates of phenotypic correlations between the productivity components of
upland rice
Estimativas de correlações fenotípicas entre os componentes de produção de
arroz de terras altas
DOI:10.34117/bjdv6n2-132
Recebimento dos originais: 30/12/2019 Aceitação para publicação: 13/02/2020
Douglas Goulart Castro
Doutor em Fitotecnia, Universidade Federal de Lavras. Rua Souza Costa, 65, Uberlândia, Minas Gerais
Gabriel Mendes Villela
Doutorando em Genética e Melhoramento de Plantas, Universidade Federal de Lavras. Rua Gilberto Vilela, 13, Lavras, Minas Gerais
Tácio Peres da Silva
Doutor em Fitotecnia, Universidade Federal de Lavras. Rua Alvarez Cabral, 401, Três Pontas, Minas Gerais
Antônio Rosário Neto
Doutorando em Fitotecnia, Universidade Federal de Lavras. Rua Gilberto Vilela, 13 Lavras, Minas Gerais
Marco Renan Félix
Doutorando em Genética e Melhoramento de Plantas, Universidade Estadual Paulista, Via de Acesso Prof. Paulo Donato Castellane, Jaboticabal, São Paulo
Flávia Barbosa Silva Botelho
Professora/Doutora, em Genética e Melhoramento de Plantas, Universidade Federal de Lavras. Departamento de Agricultura, Campus Universitário, Caixa Postal 3037, Lavras, Minas Gerais
ABSTRACT
This research aimed to study the phenotypic correlations, in highland rice, between the characters described as components of production (number of spikelets per panicles, percentage of filled spikelets, and number of panicles per m2) and productivity in kg/ha. The experiments were carried out in the 2014/2015 crop at two sites: in the municipality of Lavras/MG and at Lambari/MG. They were conducted in a complete block design with three replications. We evaluated 34 strains of the Preliminary Comparative Test, belonging to the Breeding Program of Highland Rice of the Embrapa Rice and Beans. Joint analysis of variance of the sites was carried out for each character. The measured variables were subjected to Pearson phenotypic correlation. The significance of the correlation coefficients was evaluated by Student’s t-test. It was concluded in this work that the
correlation between productivity (kg/ha) × percentage of filled spikelets was significant and positive, showing that sterility in highland rice is a factor that strongly affects the productivity of the crop. From frequency distribution by histograms, it is known that the percentage of filled spikelets and productivity are controlled by a large number of genes, being considered quantitative characters by the normal distribution of the data.
Keywords: Oryza sativa; plant breeding; grain yield; lines. RESUMO
Esta pesquisa teve como objetivo estudar as correlações fenotípicas, no arroz das terras altas, entre os caracteres descritos como componentes da produção (número de espiguetas por panícula, porcentagem de espiguetas recheadas e número de panículas por m2) e produtividade em kg / ha. Os experimentos foram realizados na safra 2014/2015 em dois locais: no município de Lavras / MG e em Lambari / MG. Eles foram conduzidos em um delineamento de blocos completo, com três repetições. Foram avaliadas 34 linhagens do Teste Comparativo Preliminar, pertencentes ao Programa de Melhoramento de Arroz das Terras Altas do Arroz e Feijão da Embrapa. Análise conjunta da variância dos locais foi realizada para cada personagem. As variáveis medidas foram submetidas à correlação fenotípica de Pearson. A significância dos coeficientes de correlação foi avaliada pelo teste t de Student. Concluiu-se neste trabalho que a correlação entre produtividade (kg / ha) × porcentagem de espiguetas recheadas foi significativa e positiva, mostrando que a esterilidade no arroz das terras altas é um fator que afeta fortemente a produtividade da cultura. A partir da distribuição de frequências por histogramas, sabe-se que o percentual de espiguetas preenchidas e a produtividade são controladas por um grande número de genes, sendo considerados caracteres quantitativos pela distribuição normal dos dados.
Palavras-chave: Oryza sativa, melhoramento de plantas, produtividade, linhagens 1 INTRODUCTION
Rice (Oryza sativa L.) is originally an aquatic species, but because of environmental pressures caused by evolutionary processes, it became adapted to several environmental conditions (Guimarães et al., 2006).
There are two major ecosystems for this culture: floodplain and highland. Floodplain rice is irrigated by a controlled flooding system, while highland rice is planted in a dryland system with supplemental sprinkler irrigation, making it highly dependent on rains (Guimarães et al., 2006). Currently, highland cultivars have stood out regarding morphology, which makes their field management easy and increases productivity (Pinheiro, 2010).
Rice is a globally important dietary source, being a staple food of a large part of the population, resulting in a significant economic strategy for some countries (Walter et al., 2008; Ferreira et al., 2006). The importance of rice is linked to human nutrition, in health promotion and disease prevention, and, economically, is associated with the generation of income by the use of workforce and industrial application (Bassinelo, 2006, Walter et al., 2008).
In addition, in the current global socioeconomic context, the supply of food or of any product must comply with sustainability criteria. Food production must improve people’s nutrition, not harm
the environment, and be economically viable, providing a better quality of life for producers and society. Concerning production, it must have economic competitiveness conditions, even if it is intended for local consumption (Ferreira et al., 2006).
The Asian continent has the world’s largest rice production. Since the last decade, there has been a forecast for a decrease in area and, as a result, in the average production rate, caused by several reasons and leading to problems about the relationship of supply and demand. In recent decades, South America and Africa have been experiencing an increase in production and a need to obtain productivity gains (Ferreira et al., 2006).
Brazil is recognized worldwide among the ten largest producers of rice, and the state of Rio Grande do Sul is its main producer, contributing with 71% of the Brazilian production. The 2016/2017 crop presented a decrease in the dryland rice planted area compared to the previous one, mainly related to the uncertainty of the producer in growing corn or soybeans and to the decrease in area opening. However, it showed an increase in production primarily associated with the increase in productivity of both dryland and irrigated rice. (Conab, 2017).
Genetic and/or phenotypic correlations are tools of great importance to plant breeding, since they allow studying the influence of a feature in the expression of others, measured in linear association, or the degree to which these vary together, assigned to genetic and environmental causes (Marchioro et al., 2003; Vencovsky & Barriga, 1992). The genetic correlation between characters occurs because of the effect of pleiotropy or gene linkage phenomenon, allowing the indirect selection on a character of high genetic correlation with the one of interest (Marchioro et al., 2003). Both genetic and phenotypic correlations presented a positive situation for the production of filled grains and the production components of the culture (Rangel, 1986). To estimate yield in rice, one can use variables such as the number of panicles per m2 and the amount of total and filled spikelets per panicles, and the latter has a direct and linear influence on rice productivity (Guimarães et al., 2006; Marchezan, 2005).
Thus, this research aimed to study the phenotypic correlations, in highland rice, between the characters described as components of production (number of spikelets per panicles, percentage of filled spikelets, and number of panicles per m2) and productivity in kg/ha.
2 MATERIAL AND METHODS
2.1 GENETIC TREATMENTS AND EXPERIMENTAL FEATURES
The experiments were carried out in the 2014/2015 crop at two sites: in the municipality of Lavras/MG, located at a latitude 21°14'43" S and longitude 44°59' 59"O, with an altitude of 919 m;
and at Lambari/MG, located at a latitude 21º 58' 32" S and longitude 45º 21' 01" O, with an altitude of 887 m.
They were conducted in a complete block design with three replications, and each repetition consisted of a portion of three four-meter rows spaced at 0.35 cm, over seeding of 80 seeds/m. We evaluated 34 strains of the Preliminary Comparative Test, belonging to the Improvement Program of Highland Rice of the Federal University of Lavras in partnership with Embrapa Rice and Beans and EPAMIG. Plant fertilizing was carried out with 450 kg/ha of fertilizer NPK 8-28-16, in addition to plant care regarding the physical control of weeds, but there was no application of insecticides and fungicides.
For final production, we considered the harvest of the whole plot with grain moisture close to 18%. After harvesting, the grains were dried to about 13% and weighed, to obtain the estimated productivity per plot in kg/ha. Concerning the other components of productivity, all the panicles contained within one meter of the central row were harvested. Of this sample, 10 panicles were randomized to estimate grain sterility. In each of the 10 panicles, the number of spikelets with formed and sterile grains were counted. Thus, the analyzed variables were: number of spikelets per panicle, percentage of filled spikelets, numbers of panicles per m2, and productivity (kg/ha).
3 DATA ANALYSIS
Joint analysis of variance of the sites was carried out for each character, using the adjusted means and following a linear fixed effects model (Littel et al., 1991; Littel et al., 2006) for the three components: site, strain, and strain response to the growing environment. We considered the effect of treatments (strains) and the effect of sites as fixed, according to the following model:
𝑌𝑖𝑗𝑘: 𝜇 + 𝑡𝑖 + 𝑏𝑗+ 𝑎𝑘+ 𝑡𝑎𝑖𝑘 + 𝑒𝑖𝑗𝑘, Where:
𝑌𝑖𝑗𝑘: is the value of the character for the ith treatment in the jth block and in the kth environment;
𝜇: is the overall mean;
𝑡𝑖: is the effect of the ith treatment, with i = 1, 2, ..., 34;
𝑏𝑗: is the effect of the jth block, with j = 1, 2, 3;
𝑎𝑘: is the effect of the kth environment, with k = 1, 2;
𝑡𝑎𝑖𝑘: is the interaction effect between treatments and environments;
From the analysis of variance, the experimental coefficients of variation and selective accuracy were determined and the means for each character were estimated.
The measured variables were subjected to Pearson phenotypic correlation, based on average data of the three repetitions and of the two sites from the joint analysis. The significance of the correlation coefficients was evaluated by Student’s t-test (Cruz, 1994).
The associations between the components of productivity were estimated by path analysis. Productivity (kg/ha) was evaluated as basic variable. Number of spikelets per panicles, percentage of filled spikelets, and number of panicles per m2 were evaluated as explanatory variables.
As graphic visualization of the phenotypic correlation, a principal component analysis was performed, redistributing the variation observed in original axes to obtain a set of non-correlated orthogonal axes, thus associated with the idea of reducing the dataset with the lowest possible loss of information.
The statistical analyses employed in this study were carried out with GENES – (Software for Experimental Statistics in Genetics) (Cruz, 2001).
4 RESULTS AND DISCUSSION
Table 1 shows the summary of the joint analysis of variance for panicles per m2, percentage of filled spikelets, number of spikelets per panicle, and productivity (kg/ha), obtained from preliminary comparative test of highland rice in the 2014/2015 crop in Lavras/MG and Lambari/MG. The treatments were significantly different (p<0.05) for all the characters, that is, there was no coincident behavior between the progenies.
Table 1. Summary of the analysis of variance and of the estimates of number of panicles per square meter (NPM), percentage of filled spikelets (FS), number of spikelets per panicle (NSP) and productivity (PROD) (kg/ha), obtained from the preliminary comparative test, Lavras/MG and Lambari/MG, 2014/2015.
FV GL QM NPM FS (%) NSP PROD(kg/ha) Strains 33 15968.11* 115.34** 1828.04** 1795370** Sites 1 1114.98 499.27 11307.47 25241865 Strains × Sites 33 6177.49 85.79* 1170.59** 1727450** Repetitions (Environment) 4 3276.64 29.52 677.47 75002 Error 66 4297.41 48.72 398.21 170026
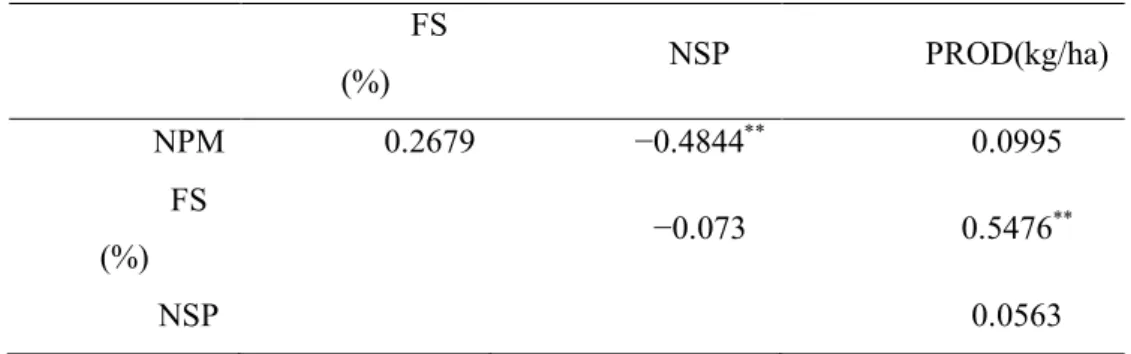
To verify the existence of association between two variables and allow indirect selection, one often estimates the correlation between characters, as this is a statistic parameter that measures the degree of association between the two variables (Ramalho et al., 2012). Among the phenotypic correlations estimated in this study, the only significant ones were between panicles per m2 × number of spikelets per panicle and between productivity (kg/ha) × percentage of filled spikelets (Table 2).
Table 2. Phenotypic correlations based on estimated average data between number of panicles per square meter (NPM), percentage of filled spikelets (FS), number of spikelets per panicle (NSP) and productivity (PROD) (kg/ha), obtained from the preliminary comparative test, Lavras/MG and Lambari/MG, 2014/2015.
FS (%) NSP PROD(kg/ha) NPM 0.2679 −0.4844** 0.0995 FS (%) −0.073 0.5476 ** NSP 0.0563 **
1% significance level by Student’s t-test.
By the path analysis of collinearity (Table 3) and its respective significances, we observed that productivity presented a positive correlation with percentage of filled spikelets (0.5476), indicating that increases in this character positively affect productivity.
Table 3. Estimates of direct and indirect effects of productivity (kg/ha) and its production components of the joint analysis of the preliminary comparative test in Lavras/MG and Lambari/MG, 2014/2015.
Characters Correlation estimate
Panicle/m2
Direct effect on productivity (kg/ha) −0.0771 Indirect effect on % of filled spikelets 0.1512
Indirect effect on number of spikelets/panicle 0.0254
𝑟𝑔^𝑔 0.86 0.76 0.88 0.95
CV (%) 17.18 9.20 14.71 11.92
Total 0.0995
Filled Spikelets (%)
Direct effect on productivity (kg/ha) 0.5644
Indirect effect on panicle/m2 −0.0206
Indirect effect on number of spikelets/panicle 0.0038
Total 0.5476
Number of spikelets/panicle
Direct effect on productivity (kg/ha) −0.0524 Indirect effect on panicle/m2 0.0373
Indirect effect on % of filled spikelets −0.0410
Total −0.0563
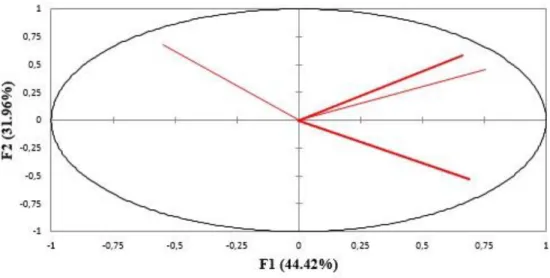
From multivariate statistics, which consists in turning a set of original variables into another set of variables of same dimension called principal components, one can graphically visualize the behavior of the correlations previously described. The number of spikelets per panicle is in the second quadrant and the number of panicles per m2 is in the fourth quadrant, graphically showing the negative correlation of −0.4844 between them. Meanwhile, productivity (kg/ha) and percentage of filled spikelets are located in the same quadrant, thus showing a positive correlation of 0.5476 (Figure 1). Each principal component is a linear combination of all the original variables, are independent of each other, and estimated for the purpose of holding, in order of estimation, as much information as possible, in terms of total variation contained in the data (Regazzi, 2000).
Figure 1. Principal component analysis based on average data of the preliminary comparative test, Lavras/MG and Lambari/MG, 2014/2015.
As a result, there was the distribution of frequencies for each estimated character. Regarding the percentage of filled spikelets, the minimum and maximum values were about 64.6% and 84.7%, respectively; for productivity (kg/ha), the respective values were 2200.95 and 4959.86 (Figure 2). In both cases, the normal distribution of the data is graphically observed.
Figure 2: Frequency distribution of the averages of the 34 strains for the characters: panicles/m2, filled
The effects of the interaction strains × sites were significant (p<0.05) for all the characters, except panicles per m2 (Table 1). This indicates that the relative behavior of the strains was distinctly affected by environmental conditions, and especially marked by differences between sites. This fact makes it difficult to recommend cultivars for the region studied (Cruz & Castoldi, 1991; Vencovsky & Barriga, 1992; Ramalho et al., 2012), because one cannot, in these circumstances, make a uniform recommendation for all sites without a considerable loss in production.
The accuracy ranged from 76% (percentage of filled spikelets) to 95% (productivity), indicating moderate to very high experimental accuracy, according to Resende & Duarte (2007). Regarding the obtained values of coefficient of variation (CV%), in general, one can affirm that the experiment has certain experimental precision, because, according to Ferreira (1991), a CV% below 20 is considered great or good experimental accuracy. In this study, CV% values below 20 were observed for all the characters analyzed (Table 1), proving the accuracy in the conduction of experiments.
For productivity, the strains showed means of 3458.97 kg/ha, which surpassed the national mean for highland rice in the 2016/2017 crop, which was about 2190 kg/ha (Conab, 2017). The considerable high mean productivity of rice obtained in this study is possibly associated with sprinkler irrigation and management of the experimental area.
Regarding the number of panicles per m2, the value of 381.51 (Table 1) was far superior to the ones observed by Crusciol et al. (2003), Meira et al. (2005), and Dalchiavon et al. (2012). It is worth highlighting that the number of panicles is defined during the period of germination, ten days after the panicle becomes visible (Machado, 1994), because of a direct relationship with the number of tillers. Therefore, there is a dependency between genetic (cultivar) and environmental factors, which in this study were not preventive in the conditions of highland with sprinkler irrigation and of good fertility soil, indicating that the cultivar presented good tillering capacity.
By analyzing the percentage of spikelet full, the mean value of 75.88% expressed a high mean of fertile spikelets (Table 1). According to Yoshida (1981a, 1981b), the total number of fertile and sterile spikelets is affected by genetic factors and external conditions prevailing during the reproductive phase, more precisely from the beginning of the reproductive phase until five days before the flowering. Thus, by the good soil fertility and water availability during the development of the culture, the preliminary comparative test had some superior genotypes concerning the selection criteria for spikelet sterility in plant breeding programs. Dalchiavon et al. (2012) obtained the man value of 81.59% of filled spikelets in highland rice grown in no-tillage and sprinkler irrigation system. However, Silva et al. (2002) found values of 71.3% for the same component of production, and Farinelli et al. (2004) described means values of 68.22%, reporting lower values compared to this
study. Nevertheless, it is worth pointing out that these studies had as causes of variation the times of application of potassium fertilizer (Silva et al., 2002) and doses of nitrogen and potassium fertilizer (Farinelli et al., 2004), which probably contributed to the differences detected, since the production components depend on biotic and/or abiotic factors, in different stages of crop development.
The significance presented a negative correlation between the characters panicles per m2 × number of spikelets per panicle (−0.4844) (Table 2), showing that, by increasing the number of panicles, there is a possible reduction in the total number of spikelets produced in each panicle. This result is possibly explained by the greater need for the photoassimilates of the plant to obtain a high load of spikelet number in each panicle with a high number of panicles on the plant. For the upcoming release of cultivars, it would be desirable that the breeding programs were able to select genotypes with good association between these two characters. This result confirms the one found by Guimarães et al. (2008), who observed a negative correlation (−0.247) between density of panicles and number of grains per panicle.
The correlation between productivity (kg/ha) and percentage of filled spikelets presented significant positive correlation (0.5476) (Table 2), showing that the sterility in highland rice is a factor that strongly affects the productivity of the crop. According to Matsushima (1962), the breaks in grain productivity are especially pronounced when the water stress occurs during flowering, since it is in this stage that the processes related to the reproductive development are affected, resulting in sterility and draining of the spikelets, thus proving the existence of a positive correlation between these two characters. Guimarães et al. (2008) found a correlation between sterility of spikelets and grain productivity of −0.938, indicating an increase in productivity compared to the reduction of spikelet sterility. Saif-ur-Rasheed et al. (2002) found that spikelet sterility contributed in 87.3% of the variability in grain productivity. Soares et al. (1990) also observed a positive and significant correlation between grain productivity and percentage of filled spikelets, and these characteristics were considered priorities in highland rice breeding programs that aim to obtain more productive cultivars. In addition, Rangel et al. (1980) also found a significant positive correlation between grain productivity and percentage of filled spikelets.
Considering the direct effects on productivity, the percentage of filled spikelets was the character that presented the greatest effect and correlation (0.5644) with this variable. Regarding the total correlation between percentage of spikelets and productivity (0.5476), much of the value is explained by direct effect. This result highlights the importance of spikelet sterility for productivity, considered a priority in rice breeding programs aimed at obtaining more productive cultivars. The same was observed for the correlation between productivity and number of spikelets per panicle, also greatly explained by the direct effect itself.
These results show the complexity of the character productivity and its direct relationship with the sum of all the yield components, and not just with the isolated effect of a component.
The coefficient of determination was 30%, indicating a low accuracy in the path analysis of the multicollinearity data. A higher coefficient of determination, of 58%, was found by Abreu et al. (2016), similar in value to that found by Marchezan et al. (2005). Thus, we recommend the evaluation of a larger number of characters in future studies.
According to Allard (1999) and Ramalho et al. (2008), quantitative characters are those that present symmetrical distribution of the data around the mean because of the large number of genes involved in genetic control, having a pronounced influence on the environment. Thus, one can infer that both characters are quantitative, being controlled by a large number of genes (Ramalho et al., 2012).
Concerning the number of spikelets per panicle, the minimum and maximum values were 108.3 and 180.45, respectively (Figure 2). Regarding frequency distribution, there was a distribution with a strong tendency to reduce the number of total grains of the panicle. Unlike what was observed for the previous characters, the distribution indicates the existence of a certain degree of dominance, allowing one to infer that it is a character controlled by a smaller number of genes and/or less affected by the environment.
5 CONCLUSIONS
Among the phenotypic correlations estimated in this study, the correlation between panicles per m2 × number of spikelets per panicle was significant and negative, showing that, by increasing the number of panicles, there is a possible reduction in the total number of spikelets produced in each panicle. There was also significant correlation, but positive, between productivity (kg/ha) × percentage of filled spikelets, showing that sterility in highland rice is a factor that strongly affects the productivity of the crop.
Considering the direct effects on productivity, the percentage of filled spikelets was the character that presented the greatest effect. The other characters presented indirect effects on productivity, illustrating the complexity of productivity and that it is the result of the sum of all the components, not just the isolated effect of a component.
From frequency distribution by histograms, it is known that the percentage of filled spikelets and productivity are controlled by a large number of genes, being considered quantitative characters by the normal distribution of the data.
AKNOWLEDGEMENTS
The authors would like to thank the funding agencies CAPES and FAPEMIG of the Brazilian government for the partial financial support for the research in this paper. We took the opportunity to inform you that there was no conflict of interest.
REFERENCES
Abreu HKA, Teodoro PE, Pantaleão ADA & Correa AM (2016) Genetic parameters, correlations and path analysis in upland rice genotypes. Bioscience Journal, v. 32, n. 2, p. 354–360.
Allard RW (1999) Principles of plant breeding. 2ªEd. New York: John Willey & Sons, 254p
Bassinello PZ & Naves, MMV (2006) Bioquímica e saúde humana. In: Santos AB, Stone LF, Vieira NRA. (Org.). A cultura do arroz no Brasil. 2ed.Santo Antônio de Goiás: Embrapa Arroz e Feijão (Embrapa CNPAF), v., p. 31-51.
CONAB. Companhia Nacional de Abastecimento. Available from: <http://www.conab.gov.br/OlalaCMS/uploads/arquivos/17_04_17_17_20_55_boletim_graos_abr_2 017.pdf>. Access on: April. 24, 2017.
Crusciol CAO, Soratto RP & Andreotti M (2003) Produtividade do arroz de terras altas sob condições de sequeiro e irrigado por aspersão em função do espaçamento entre fileiras. Agronomia, Rio de Janeiro, v. 37, n. 1, p. 10-15.
Cruz CD (2001) Programa GENES: versão Windows: aplicativo computacional em Genética e Estatística. Viçosa: UFV, 648 p.
Cruz CD & Castoldi FL (1991) Decomposição da interação genótipos x ambientes em partes simples e complexa. Revista Ceres, v.38, p.422-430.
Dalchiavon FC, De Passos M & Coletti AJ (2012) Correlação linear entre componentes da produção e produtividade do arroz de terras altas em sistema plantio direto. Ciências Agrárias, v. 33, n. 5, p. 1629–1642.
Farinelli R, Penariol FG, Fornasieri Filho D & Bordin L (2004) Características agronômicas de arroz de terras altas sob plantio direto e adubação nitrogenada e potássica. Revista Brasileira de Ciência do Solo, Viçosa, v. 28, n. 3, p. 447-454.
Ferreira CM, Rucatti EG & Villar PM (2006) Produção e aspectos econômicos. In: A. B. dos Santos; L.F. Stone & N.R.de A. Vieira. (Org.). A cultura do arroz no Brasil. 2ed.Santo Antônio de Goiás: Embrapa Arroz e Feijão, v. 2, p. 109-130.
Ferreira PV (1991) Estatística Experimental aplicada à Agronomia. EDUFAL, 437p.
Guimarães CM, Dos Santos AB, De Magalhães Júnior AM & Stone LF (2006) Sistemas de cultivo. In: Santos AB Dos, Stone LF, Vieira NRA. A cultura do arroz no Brasil. 2ª edição revista e ampliada. Santo Antônio de Goiás: Embrapa arroz e Feijão, cap. 3, p. 53-96.
Guimarães CM, Stone LF & Neves PCF (2008) Eficiência produtiva de arroz com divergência fenotípica. Revista Brasileira de Engenharia Agrícola e Ambiental, v.12, n. 5, p. 465-470.
Hallauer AR, Carena MJ & Miranda Filho JB (2010) Quantitative genetics in maize breeding. [3rd ed.]. New York, NY: London: Springer, xv, 663 p.
Little RC, Freund RJ & Spector PC (1991) SAS System for linear models. 3. ed. SAS Institute Inc.: Cary, NC, USA. 329 p.
Machado JR (1994) Desenvolvimento da planta e produtividade de grãos de populações de arroz (Oryza sativa L.) irrigado por inundação em função de épocas de cultivo. Tese de Doutorado. Faculdade de Ciências Agronômicas. Universidade Estadual Paulista, Botucatu.
Marchezan E (2017) Análise de coeficiente de trilha para os componentes de produção em arroz. Ciência. Rural, Santa Maria, v. 35, n. 5, p. 1027-1033, October. 2005.
Marchezan E, Martin TN, Santos FM & Camargo ER (2005) Análise de coeficiente de trilha para os componentes de produção em arroz. Ciência Rural, Santa Maria, v. 35, n. 5
Marchioro VS (2003) Herdabilidade e correlações para caracteres de panícula em populações segregantes de aveia. Revista Brasileira de Agrociência, v.9, n.4, p.323-328.
Meira FA, Buzetti S, Freitas JG, Arf O & Sá M (2005) E. Resposta de dois cultivares de arroz à adubação nitrogenada e tratamento foliar com fungicidas. Acta Scientiarum. Agronomy, Maringá, v. 27, n. 1, p. 91-95.
Pinheiro BS (1999) Características morfofisiológicas da planta relacionadas à produtividade. In: Viera NR, Santos AB Dos, Sant´Ana EP (Org.). A Cultura do Arroz no Brasil, p. 116-147.
Ramalho MAP, Abreu AFB, Santos JB & Nunes JAR (2012). Aplicações da genética quantitativa no melhoramento de plantas autógamas. Lavras: Universidade Federal de Lavras, 522 p.
Rangel PHN, Galvão JD, Silva JC & Cardoso AA (1986) Coeficientes de trilha, em cultivares de arroz (Oryza sativa L.). In: Reunião Nacional de Pesquisa de Arroz, 2., 1980, Goiânia. Resumos... Goiânia: EMBRAPA-CNPAF, p 154-158.
Regazzi AJ (2000) Análise multivariada, notas de aula INF 766, Departamento de Informática da Universidade Federal de Viçosa, v.2.
Resende MDV & Duarte JB (2007) Precisão e controle de qualidade em experimentos de avaliação de cultivares. Pesquisa Agropecuária Tropical. 37:182-194.
Saif-Ur-Rasheed M, Sadaqat HA & Babar M (2002) Correlation and path co-efficient analysis for yield and its components in rice (Oryza sativa L.). Asian Journal of Plant Sciences, v.1, n.3, p.241-244.
Silva EA, Soratto RP, Ozeki M & Arf O (2002) Manejo da época de aplicação da adubação potássica em arroz de terras altas irrigado por aspersão em solo de cerrado. Acta Scientiarum: Agronomy, Maringá, v. 24, n. 5, p. 1455-1460.
Vencovsky R & Barriga P (1992) Genética biométrica no fitomelhoramento. Ribeirão Preto: Sociedade Brasileira de Genética, 496p.