Selection and genetic gains for juvenile traits in progenies of
Hevea
in São Paulo State, Brazil
Paulo de Souza Gonçalves
1, Antonio Lúcio Mello Martins
2, Nelson Bortoletto
3and Luis Alberto Saes
4 1APTA Instituto Agronômico, Programa Seringueira, Campinas, SP, Brazil.
2
APTA Regional Centro Norte, Pindorama, SP, Brazil.
3APTA Regional Noroeste Paulista, Votuporanga, SP, Brazil.
4APTA Regional Vale do Ribeira , Pariquera-Açú, SP, Brazil.
Abstract
Five yield traits were investigated in three-year-old progenies from open-pollinated rubber trees [Hevea brasiliensis (Willd. ex Adr. de Juss) Muell.-Arg.]. Twenty progenies were evaluated in a randomized, complete block design replicated three times using 10 plants per linear plot at the North Central Experimental Station in Pindorama, São Paulo State, Brazil. The characters evaluated included the average yield of rubber, growth vigor, bark thickness, total number of latex vessel rings and latex vessel size. Highly significant (p < 0.01) genetic differences were observed among progenies for most traits. The genotypic variance components accounted for 13.2%, 12.3%, 9.4%, 3.4% and 0.23% of the phenotypic variance for yield, growth vigor, bark thickness, total number of latex vessel rings and latex vessel size, respectively. Heritabilities, as well as genotypic and phenotypic correlations among traits, were estimated. Heritabilities for the above traits at the individual plant level (hi
2
) were 37%, 35%, 69%, 10% and 16%, respectively. Significant positive genotypic and phenotypic correlations were found between the yield of rubber and growth vigor (rg= 0.73, rp= 0.70), bark thickness (rg= 0.70**, rp= 0.75**) and the total number of latex vessel rings (rg= 0.64, rp= 0.80). There was no relationship between yield and latex vessel size, growth vigor or total number of latex vessel rings. Based on these data, selecting the best two out of 20 progenies would result in a genetic gain of 12.3% and 6.8% for yield of rubber and growth vigor, respectively. The two best individual ortets within each progeny would result in a genetic gain of 27.7% and 9.1%, with a total gain of 40% and 16% for these two traits, respectively.
Key words: Hevea brasiliensis,rubber tree, heritability, genetic parameters.
Received: October 16, 2002; Accepted: November 14, 2003.
Introduction
The success of a rubber tree [Hevea brasiliensis
(Willd. ex Adr. de Juss) Muell.-Arg.] breeding program de-pends, to a large extent, on knowledge of the genetic as-pects involved and on the recognition of traits considered important for plant selection. Information on the genetic variability or heritability of traits that are to be improved is extremely important and of vital importance for prediction of the final outcome.
The rubber tree is a tree crop with a long generative and testing cycle. A single generative cycle requires 4-5 years (excluding 7-10 years for the evaluation of parental performance) and about 20-30 years for one testing cycle from the time of pollination. Thus, one of the most desir-able innovations in tree breeding is a technique for
predict-ing the breedpredict-ing value of the trees at the juvenile stage (Varghese, 1999).
Studies on genetic variation have been done in Ma-laysia (Nga and Subramanian, 1974; Tanet al., 1975; Tan and Subramanian, 1976; Tan, 1977, 1978a,b) and Nigeria (Alika and Onokpise, 1982; Alika, 1985). In Brazil, studies on the genetic variation of various traits have been done by Siqueira (1978), Valoiset al. (1978), Paivaet al.(1982, 1983), Gonçalveset al.(1990, 1992, 1996), Moretiet al.
(1994), Boocket al.(1995) and Costa (1999).
The aim of this work was to estimate the genetic vari-ability, heritability coefficients, and the relative genetic gains for the yield traits of rubber tree progenies in order to obtain information necessary for choosing the most appro-priate methods of breeding selection.
Materials and Methods
The material for this experiment consisted of seeds from 20 open-pollinated progenies randomly selected from
www.sbg.org.br
Send correspondence to Paulo de Souza Gonçalves. Instituto Agronômico de Campinas (IAC), Programa Seringueira, Caixa Postal 28, Av. Barão de Itapura 1481, 13001-970 São Paulo, SP, Brazil. E-mail: [email protected].
a population base of 100 Asiatic clones. The seeds were sown in the autumn of 1998 in individual polyethylene bags (12 cm x 18 cm x 18 cm) filled with a mixture of 70% hu-mus and 30% sand. The seedlings remained in these pots during the first six months of the growing season and were subsequently planted out at the Pindorama Experimental Station (21°13’S, 48°56’W). The space between rows and between trees within rows was 1.5 m. This region has a hu-mid, tropical climate with a mean yearly temperature of 21 °C and a red yellow podzolic type soil (Lepsch and Valadares, 1976).
The experiments were done using a randomized block design with three replications and 10 plants per plot. A clone trial consisting of a randomized block design with 25 clones, three replications and six plants per plot along with the prog-enies trial. The dates and procedures were similar to those of the progenies trial. The clone trial was designed to provide an estimate of the environmental variance among plants within plots (σ$ew
2
) (Vencosvsky and Barriga, 1992).
Measurements
The yield of rubber was determined using the princi-ple of the Hamker-Morris-Mann test (HMM) (Tan and Subramanian, 1976), as follows: 30 tappings were made with a half-spiral, alternative daily (1/2S d/3) tapping sys-tem 20 cm from the ground. The yield was recorded by cup coagulation. The “coagula” were air-dried for two months until a constant weight was achieved. The yield from each plant was expressed in grams per tapping.
Growth vigor was determined as the girth of the seed-ling measured once a year. The first measurement at 12 months was of the diameter because the plants were too small to measure growth vigor. Plant diameter was mea-sured 0.50 m from the ground level with a slide clipper. This measurement was converted to growth vigor by as-suming that the stem was cylindrical. Another measure-ment was taken at 24 months at 50 cm above the ground using a measuring tape.
For latex vessel counts, virgin bark samples were re-moved from the trunk as plugs 20 cm from the ground on the opposite side of the tapping panel. Bark thickness was measured using samples from each seedling.
The total number of latex vessel rings was determined by examining the radial longitudinal sections of the same bark samples. Latex vessel size was expressed as the diam-eter of latex vessels observed in transverse sections of the same bark samples. Complete details of the procedure are described by Gonçalveset al.(1995).
Analysis of variance (ANOVA)
The analysis using the statistical model below consid-ered all variables (except mean) as random effects.
yijk=µ+pi+bj+eij+dijk
whereyijk= observed value of thekth plant in thejth
replica-tion within theith progeny,µ= general mean,pi= effect of
theith progeny (p= 1, 2,...20),bj= effect of thejth
replica-tion (j= 1, 2, 3),eij= experimental error associated with the
ijth plot anddijk= effect of thekth plant within theijth plot.
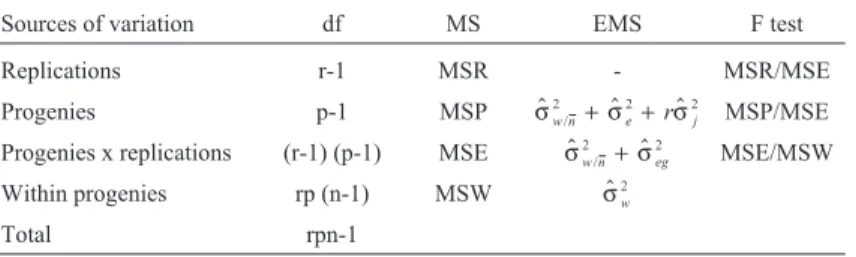
Estimates of the components of genotypic and pheno-typic variances were obtained by the mathematical ex-pected mean squares from the analyses of variance (Table 1), according to Vencovsky and Barriga (1992). Thus, the phenotypic variance due to differences among plants within plots was:
$
σw2 =MSW
whereσ$w2 =σ$gw2 +σ$ew2 , which can be separated into genetic (σ$gw2 ) and environmental (σ$ew2 ) variances among plants within plots.
Partitioning the componentσ$w2 intoσ$gw2 andσ$ew2 sug-gested that it would be possible to use information from the mean square within plots of the clones trial (Table 2) to pro-vide estimates of the environmental variance within plots (σ$ew2 ). Thus, the environmental and genetic variances among plants within plots were obtained by the mean squares (Tables 3 and 4).
$
σew2 =MSWC
$
σgw2 =MSW – MSWC
Estimates of the environmental variance among plots (σ$e
2
) and of genotypic variance due to differences among
Table 1- Degrees of freedom (df), mean square (MS) and expected mean square (EMS) for estimating the variance due to differences among plants
within plots in a clonal trial of rubber trees.
Sources of variation df MS EMS F test
Replications r-1 MSR - MSR/MSE
Progenies p-1 MSP σ$w n/ σ$e rσ$j
2 2 2
+ + MSP/MSE
Progenies x replications (r-1) (p-1) MSE σ$w n/ σ$eg
2 2
+ MSE/MSW
Within progenies rp (n-1) MSW σ$w
2
Total rpn-1
$ σw
2
= variance due to differences among plants within plots,σ$e 2
= environmental variance among plots,σeg= genotypic variance due to differences among
progenies (σ$g2) were obtained through the expected mean
square, as shown in Table 1.
The total genotypic variance (σ$G2), phenotypic
vari-ance based on progeny means (σ$p2), and phenotypic
vari-ance based on individual plants (σ$p2) were obtained using
the expressions:
$ $ $
σG2 =σg2+σgw2
$ $ $ $
σp σg σe σw
r rn
2 2
2 2
= + +
$ $ $ $
σp σg σe σw
2 2 2 2
= + +
Heritabilities and gain estimates
The heritability coefficients at the individual plant level (h$i
2
), for selection within progeny (h$w 2
), and for the among progenies mean (h$g
2
), were estimated using the ex-pressions (Vencovsky and Barriga, 1992):
$ $ /$
hi G P
2 2 2
= σ σ
$ $ / $
hw gw w
2 2 2
= σ σ
$ $ /$
hg g P
2 2 2
= σ σ
Table 2- Degrees of freedom (df), mean square (MS) and expected mean square (EMS) for estimating the variance due to differences among plants
within plots in a clone trial of rubber trees.
Sources of variation df MS EMS F test
Replications r-1 MSRC - MSRC/MSEC
Clones c-1 MSC - MSC/MSEC
Clones x replications (r-1) (c-1) MSEC - MSEC/MSWC
Within clones rc (n-1) MSWC σew2
Total rcn-1
σew
2
= variance due to differences among plants within plots, r = number of replications, c = number of clones, n = number of plants per plot.
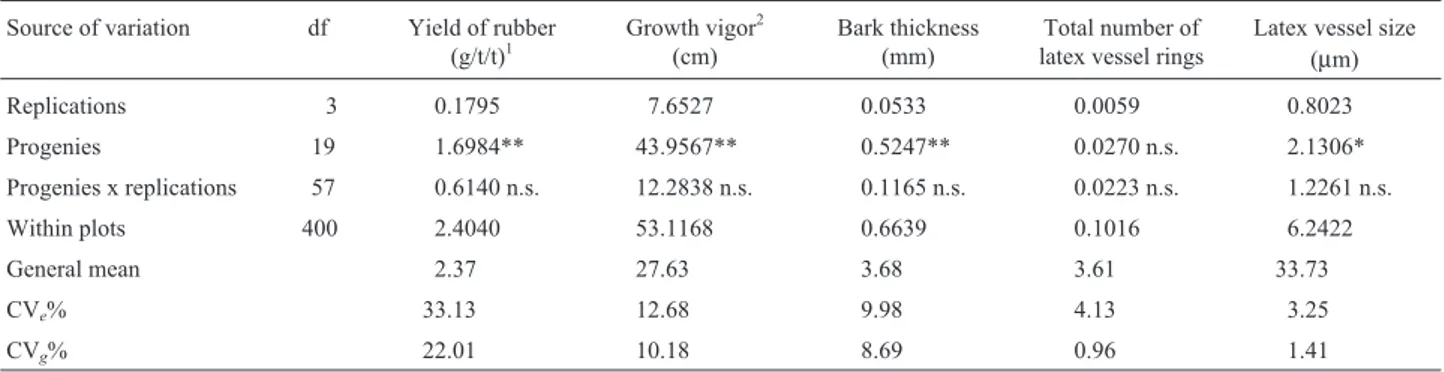
Table 3- Degrees of freedom (df) and mean squares from ANOVA, general mean, and experimental (CVe%) and genotypic (CVg%) coefficients of
variation for five traits in 20 open pollinated rubber tree progenies.
Source of variation df Yield of rubber
(g/t/t)1
Growth vigor2
(cm)
Bark thickness (mm)
Total number of latex vessel rings
Latex vessel size (µm)
Replications 3 0.1795 7.6527 0.0533 0.0059 0.8023
Progenies 19 1.6984** 43.9567** 0.5247** 0.0270 n.s. 2.1306*
Progenies x replications 57 0.6140 n.s. 12.2838 n.s. 0.1165 n.s. 0.0223 n.s. 1.2261 n.s.
Within plots 400 2.4040 53.1168 0.6639 0.1016 6.2422
General mean 2.37 27.63 3.68 3.61 33.73
CVe% 33.13 12.68 9.98 4.13 3.25
CVg% 22.01 10.18 8.69 0.96 1.41
*p < 0.05, **p < 0.01, n.s. = not significant.1g/t/t – grams per tree per tapping. 2
Expressed as the girth of the progenies measured 20 cm from the ground.
Table 4- Degrees of freedom (df) and mean squares from ANOVA, general mean, and experimental (CVg%) and genotypic (CVg%) coefficients of
variation for five traits in 25 rubber tree clones.
Sources of variation df Yield of rubber
(g/t/t)1
Growth vigor2 (cm)
Bark thickness (mm)
Total number of latex vessel rings
Latex vessel size (µm)
Replications 2 6.5860 6.0771 0.1078 0.0466 0.1231
Clones 24 4.0961** 1.8780** 0.1160** 0.0243** 0.2556n.s.
Clones x replications 48 0.2344 n.s. 0.3096** 0.0246n.s. 0.0067 n.s. 0.4817n.s.
Within clones 900 1.6030 0.0449 0.2240 0.0148 5.4080
General mean 3.30 25.00 2.80 4.20 25.00
CVe% 23.88 11.21 9.30 6.10 16.92
CVg% 15.77 11.25 11.41 0.70 1.90
*p < 0.05, **p < 0.01, n.s. = not significant.1g/t/t – grams/tree/tapping.
The coefficients of genotypic variation (CV$g%) were
estimated using the formula described by Vencovsky (1983):
CV$g% $
.
= σg
x
2
100
Genetic gain from selection among progenies (Gg)
and within progenies (Gw) was also computed using
Fal-coner and Mackay’s (1996) formula:
Gg =k1 Phg 2 $ $ σ
Gw =k2 whw 2 $ $ σ
wherek= the selection differential in a standard measure,
$
σP = the phenotypic standard deviation of the progeny means, andσ$w= the phenotypic standard deviation among plants within plots.
The genetic gain expressed as a percent of the mean obtained from among and within progenies was estimated using the formula:
G G
x
g g
%= .100 or G G
x
w w
%= .100
wherexis the general mean.
Correlations coefficients
To examine the relationship among the yield traits of rubber trees, genotypic (rg(xy)) and phenotypic (rp(xy))
corre-lation coefficients were calculated according to Kempthone (1966), as follows:
rg xy Cov g xy
gx gy ( )
( )
.
=
σ2 σ2
rp xy Cov p xy
px py ( )
( )
.
=
σ2 σ2
whereCovg(xy)andCovp(xy)= the genotypic and phenotypic
covariances for traits x and y respectively, σgx2 and σpx2= genotypic and phenotypic variances for traitx,and σgy2andσpy2= genotypic and phenotypic variances for trait
y.
The significance of these correlations was tested us-ing the table in Fisher and Yates (1971) for simple correla-tions for 5% and 1% probabilities. The genotypic and phenotypic correlation coefficients were tested using the degrees of freedom of the error.
Results and Discussion
Genotypic variation
Except for the total number of latex vessel rings, highly significant among-progeny differences were
de-tected by the F test (Table 3). This variability is an essential condition for establishing a genetic breeding program and could be effectively exploited to increase rubber tree pro-duction.
The experimental coefficients of variation (CVe%)
obtained for yield of rubber (33.1%), growth vigor (12.7%) and bark thickness (10%) indicated that these traits were subject to considerable experimental error. However, these values agreed with similar estimates by Gonçalveset al.
(1998), Moretiet al.(1994), Boocket al.(1995) and Costa
et al.(2000a).
The genotypic variation coefficient, which expresses the amount of existing genetic variation as a percentage of the general mean, was higher for the yield of rubber (22%) than for growth vigor (10.2%), bark thickness (8.7%), latex vessel size (1.4%) and total number of vessel rings (0.96%). These results confirmed the F test results for progeny dif-ferences and characterized the yield of rubber as a more suitable trait expressing the genetic variability in this popu-lation. These results also agreed with those reported by Gonçalves et al. (1998) and Boock et al. (1995) for the same traits.
Table 4 shows the clone trial analysis of variance. Ex-cept for latex vessel size, significant among-clone differ-ences were detected by the F test for all traits. These results reinforce the variability observed in the progeny trial, an es-sential condition for establishing a genetic breeding pro-gram. The main purpose of the clone analysis of variance was to supply an estimate of the environmental variance among plants within plots.
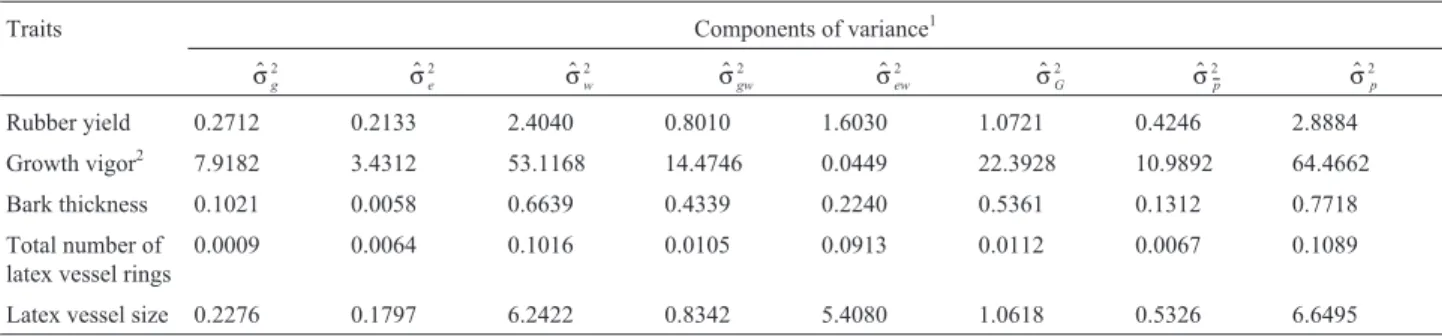
Progeny variance components
The genotypic variance components among proge-nies accounted for 13.2%, 12.2%, 9.4%, 3.4% and 0.83% of the phenotypic variance based on individual plants for bark thickness, growth vigor, yield of rubber, latex vessel size and latex vessel rings, respectively (Table 5). The contribu-tion of genotypic variance among progenies accounted for
$
σ2g = 13.7% for bark thickness of the total genotypic vari-ance and was substantially smaller than that for growth vigor (σ$2g= 35.4%). In addition, the estimates of the growth vigor were substantially greater than for the other traits.
Heritabilities
The mean heritability among progenies for the yield of rubber and growth vigor at the individual plant level (hi2)
were relatively low, with values of 0.37 and 0.34, respec-tively (Table 6). These data agreed with the results of Costa
et al.(2000a,b), Gonçalveset al.(1998, 1999), Boocket al.
(1995) and Moretiet al.(1994). Gonçalves et al.(1998, 1999) reported individual plant heritabilities ofhi2= 0.37
andhi2= 0.51 for the yield of rubber, whereas Costaet al.
(2000a) and Boock et al. (1995) reported values of
addition, Costaet al.(2000b) obtained a value ofhi2= 0.11
at Jaú. For growth vigor, values ofhi2= 0.48 (Gonçalveset
al., 1999) andhi2= 0.31 (Moretiet al., 1994) were obtained
at Pindorama andhi2= 0.47 (Boocket al., 1995) at
Votupo-ranga. These results indicate that these two traits have mod-erately low heritability estimates and imply that there is a need to increase the genetic variability for yield and growth vigor in the population studied here.
The mean heritability among progenies (hg2) for yield
of rubber and growth vigor werehg2= 0.63 andhg2= 0.72,
respectively. Costaet al.(2000a) and Boocket al.(1995) reported values ofhg2= 0.80 andhg2= 0.73, respectively,
for yield of rubber at Votuporanga, and Costa et al.
(2000b), Gonçalveset al. (1999) and Moretiet al.(1994) reported values ofhg2= 0.90,hg2= 0.91 andhg2= 0.89,
re-spectively, at Pindorama.
Values of hg2 = 0.89 (Costa et al., 2000a) and
hg2= 0.81 (Gonçalveset al.,1999) were reported for growth
vigor at Votuporanga and Pindorama, respectively. These highly significant heritability estimates for progeny means (hg2), together with the extensive variation seen within the
rubber tree population, suggest that an effort to increase yield, growth vigor, total number of latex vessel rings and
latex vessel size through progeny selection would be re-warding, as also indicated by Gonçalveset al.(1999).
The mean heritability among progenies for other traits, such as the total number of vessel rings and latex ves-sel size, were low,i.e., 10% and 16% at the individual plant level (hi2), 10% and 13% within progenies (hw2) and 13%
and 42% among the progeny means (hg2), respectively.
Expected genetic gains
The expected genetic gains for the traits studied at different levels of selection intensity are shown in Table 7. If the best six progenies were selected and planted at sites similar to that used in the experimental trial, a genetic gain among progenies for yield and growth vigor of 8.3% and 4.6%, respectively, could be achieved. When only the two best progenies (i.e., two out of 20 progenies) were selected for yield and growth vigor with a selection intensity of 10%, the gain in production would be 29.1 g and 188.6 mm, which is 12.3% and 6.8% greater than the overall progeny means. Even smaller increases than these would result in appreciable improvement if the plantings were large enough.
On the other hand, if the two best individuals were se-lected within progenies and then asexually multiplied and planted at the same site, the genetic gain for yield and growth vigor would be about 27.7% and 9.1%, respec-tively. For yield, growth vigor and bark thickness, the gains would be 27.7%, 9.1% and 18.4%, respectively. Con-sidering combined selection among and within progenies, the total genetic gains would be 40%, 16% and 29.5% for yield, growth vigor and bark thickness, respectively.
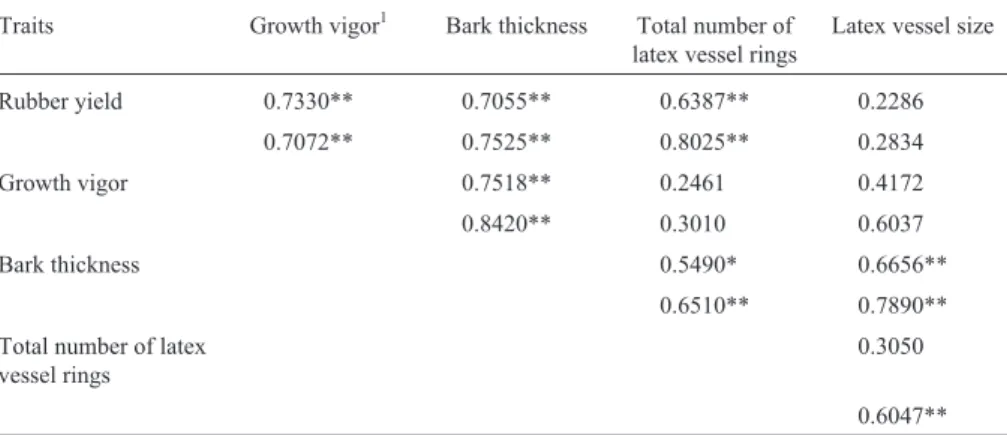
Correlations
Genotypic and phenotypic correlations between yield and other characters, such as growth vigor and bark thick-ness, were generally significant (Table 8). Progenies with high yield and high growth vigor often showed a highly sig-nificant positive correlation with bark thickness.
The influence of bark thickness on yield and growth vigor was not immediately evident in the field. High growth
Table 5- Estimates of genotypic and phenotypic components of variance for five traits in 20 open-pollinated rubber tree progenies.
Traits Components of variance1
$ σg
2 $
σe
2 $
σw
2 $
σgw
2 $
σew
2 $
σG
2 $
σp
2 $
σp 2
Rubber yield 0.2712 0.2133 2.4040 0.8010 1.6030 1.0721 0.4246 2.8884
Growth vigor2 7.9182 3.4312 53.1168 14.4746 0.0449 22.3928 10.9892 64.4662
Bark thickness 0.1021 0.0058 0.6639 0.4339 0.2240 0.5361 0.1312 0.7718
Total number of latex vessel rings
0.0009 0.0064 0.1016 0.0105 0.0913 0.0112 0.0067 0.1089
Latex vessel size 0.2276 0.1797 6.2422 0.8342 5.4080 1.0618 0.5326 6.6495
1$ σg
2
= genotypic variance due to differences among progenies,σ$e 2
= environmental variance among plots,σ$w 2
= phenotypic variance due to differences among plants within plots,σ$gw
2
= genetic variance among plants within plots,σ$ew 2
= environmental variance among plants within plots,σ$G 2
= total genotypic variance,σ$p
2= phenotypic variance based on progenies means,$
σp
2= phenotypic variance based on individual plants.
2
Expressed as the girth of the progenies measured 20 cm from the ground.
Table 6- Heritability coefficients for five traits in 20 open-pollinated rubber tree progenies.
Traits Heritabilities1
hi2 hw2 hg2
Rubber yield 0.3712 0.3332 0.6385
Growth vigor2 0.3473 0.2725 0.7205
Bark thickness 0.6945 0.6536 0.7782
Total number of latex vessel rings 0.1028 0.1013 0.1343
Latex vessel size 0.1597 0.1336 0.4273
1h
i2= individual plants,hw2= within progenies,hg2= among progenies
mean.
2
Table 7- Expected gains from different levels of selection and percentage of the mean, among (Gg) and within (Gw) progenies, and selection total (Gg+w)
for five traits in 20 open-pollinated rubber-tree progenies.
Traits Selection level1 From selection In percent of the mean
N K1 K2 Gg Gw Gg + w2 Gg Gw Gg + w2
Rubber yield
2 1.638 1.270 0.2909 0.6561 0.9470 12.27 27.68 39.95
4 1.332 0.893 0.2366 0.4613 0.6979 9.98 19.46 29.44
6 1.110 0.595 0.1972 0.3074 0.5046 8.32 12.97 21.29
8 0.928 0.318 0.1648 0.1643 0.3291 6.95 6.93 13.88
10 0.767 - 0.1362 - 0.1362 5.75 - 5.75
Growth vigor3
2 1.638 1.270 1.8858 2.5222 4.4080 6.83 9.13 15.96
4 1.332 0.893 1.5335 1.7735 3.3070 5.55 6.42 11.97
6 1.110 0.595 1.2779 1.1816 2.4595 4.63 4.28 8.91
8 0.928 0.318 1.0684 0.6316 1.7000 3.87 2.29 6.16
10 0.767 - 0.8830 - 0.8830 3.20 - 3.20
Bark thickness
2 1.638 1.270 0.4120 0.6763 1.0883 11.20 18.38 29.58
4 1.332 0.893 0.3351 0.4756 0.8107 9.11 12.92 22.03
6 1.110 0.595 0.2792 0.3169 0.5961 7.59 8.61 16.20
8 0.928 0.318 0.2334 0.1694 0.4028 6.34 4.60 10.94
10 0.767 - 0.1929 - 0.1929 5.24 - 5.24
Total number of latex vessel rings
2 1.638 1.270 0.0138 0.0410 0.0548 1.14 1.52 2.66
4 1.332 0.893 0.0112 0.0288 0.0400 0.80 1.11 1.91
6 1.110 0.595 0.0093 0.0102 0.0285 0.53 0.79 1.32
8 0.928 0.318 0.0078 0.0103 0.0181 0.29 0.50 0.78
10 0.767 - 0.0065 - 0.0065 - 0.18 0.18
Latex vessel size
2 1.638 1.270 0.1909 0.4239 0.6148 1.26 1.82 3.08
4 1.332 0.893 0.1552 0.2981 0.4533 0.88 1.34 2.22
6 1.110 0.595 0.1294 0.1986 0.3280 0.59 0.97 1.56
8 0.928 0.318 0.1082 0.1061 0.2143 0.31 0.64 0.95
10 0.767 - 0.0894 - 0.0894 - 0.27 0.27
1
N = number of progenies/individuals within progenies.
K1, K2= selection differential in standard measure (after Becker, 1984).
2
+w= Total genetic gain (Gg+Gw).
3Expressed as the girth of the progenies measured 20 cm from the ground.
Table 8- Estimates of genotypic (rg) and phenotypic (rp) correlation coefficients based on individual plants among five in 20 open-pollinated rubber tree
progenies.
Traits Growth vigor1 Bark thickness Total number of
latex vessel rings
Latex vessel size
Rubber yield 0.7330** 0.7055** 0.6387** 0.2286
0.7072** 0.7525** 0.8025** 0.2834
Growth vigor 0.7518** 0.2461 0.4172
0.8420** 0.3010 0.6037
Bark thickness 0.5490* 0.6656**
0.6510** 0.7890**
Total number of latex vessel rings
0.3050
0.6047**
*p < 0.05, **p < 0.01.
1
vigor and increased bark thickness correlated with yield to varying degrees. A positive genotypic and phenotypic asso-ciation between the average yield and the number of latex vessel rings was not evident.
The lack of a significant genotypic and phenotypic correlation between growth vigor and the total number of latex vessel rings and between yield and latex vessel size indicated that there would be a low genetic gain for all of these traits, even if selection were undertaken for only one trait.
Breeding strategy
The results of this study provide a basis for develop-ing a program to improve rubber tree selection. The “prog-eny plus within–prog“prog-eny selection” method is currently the predominant form of selection used in most advanced tree improvement programs (Zobel and Talbert, 1984). This method consists of selecting the best progenies and the best individuals among these progenies. We intend to adopt this method to improve the yield of rubber, growth vigor and to-tal number of latex vessel rings. Since there is significant genetic correlation among the three characters, direct selec-tion can be used in this case. For this purpose, “massal se-lection” will be used,i.e., growth vigor will be selected first. When a desired level of growth vigor has been ob-tained, breeding efforts will be concentrated on yield. How-ever, if a simultaneous improvement in yield and growth vigor were desired, then an independent culling method would be recommended.
Acknowledgments
The authors thank Ligia Regina Lima Gouvêa, Graziela dos Santos Lima and Andréa Cardoso Guerreiro of theHeveabreeding program at the Instituto Agronômico de Campinas (IAC) for their help during this study. P.S.G. and A.L.M.M. are recipients of CNPq fellowships. This work and its publication were supported by FAPESP.
References
Alika JE (1985) Heritability and genotypic gain from selection rubber (Hevea brasiliensis). Silvae Genet 34:1-4.
Alika JE and Onokpise OV (1982) Estimation of heritability pa-rameter for yield, growth vigour and bark thickness in rub-ber (Hevea brasiliensis) from a single pair mating (S.P.M) design. J Plan Crops 10:102-108.
Becker WA (1984) Manual of Quantitative Genetics. Washington State University Press, Pullman, 195 pp.
Boock MV, Gonçalves PS, Bortoletto N and Martins ALM (1995) Herdabilidade, variabilidade genética e ganhos genéticos para produção e caracteres morfológicos em progênies jo-vens de seringueira. Pesq Agrop Bras 30:673-681. Costa RB (1999) Métodos de seleção, interação genótipo x
am-biente e ganho genético para o melhoramento da seringueira no Estado de São Paulo. PhD Thesis, Universidade Federal do Paraná, Curitiba, 185 pp.
Costa RB, Resende MDV, Araújo AJ, Gonçalves PS and Higa AR (2000a) Selection and genetic gain in rubber tree (Hevea) populations using a mixed mating. Genet Mol Biol 23:671-679.
Costa RB, Resende MDV, Araujo AJ, Gonçalves OS and Borto-letto N (2000b) Seleção combinada univariada e multiva-riada aplicada ao melhoramento genético de seringueira Pesq Agrop Bras 35:381-388.
Falconer DS and Mackay TFC (1996) Introduction to Quantita-tive Genetics. New York, Longman, 320 pp.
Fisher RA and Yates F (1971) Statistical Methods for Research Workers. Oliver and Boyd, Edinburgh, 245 pp.
Gonçalves PS, Bortoletto N, Santos WR, Ortolani AA, Gottardi MVC and Martins ALM (1998) Avaliação genética de pro-gênies em meios-irmãos de seringueira em diferentes regiões do Estado de São Paulo. Pesq Agrop Bras 33:1085-1095.
Gonçalves PS, Cardoso M, Colombo CA, Ortolani AA, Martins ALM and Santos ICI (1990) Variabilidade genética da pro-dução anual de seringueira: estimativas de parâmetros gené-ticos e estudo da interação genótipo x ambiente. Bragantia 49:305-320.
Gonçalves PS, Furtado EL, Bataglia OCB, Ortolani AA, May A and Beletti GO (1999) Genetics of anthracnose panel canker disease resistance and its relationship with yield and growth character in half progenies of rubber tree (Hevea brasiliensis). Genet Mol Biol 22:583-589.
Gonçalves PS, Martins ALM, Bortoletto N and Carvalho AZ (1995) Relationship among yield girth and some structural characters of the laticiferous system in young seedling of rubber tree (Hevea). Braz J Genet 18:421-428.
Gonçalves PS, Martins ALM, Bortoletto N and Tanzini MR (1996) Estimates of genetics parameters and correlations of juvenile characters based on open pollinated progenies of
Hevea. Braz J Genet 19:105-111.
Gonçalves PS, Martins ALM, Gorgulho EP, Bortoletto N, Cardo-so M and Bermond G (1992) Variação genética dos compo-nentes de crescimento em progênies jovens de uma população de clones deHevea.Bragantia 51:161-171. Kempthone O (1966). An Introduction to Genetic Statistics. John
Wiley & Sons, New York, 455 pp.
Lepsch LF and Valadares JMS (1976) Levantamento pedológico detalhado da Estação Experimental de Pindorama, SP. Bragantia 35:13-40.
Moreti D, Gonçalves PS, Gorgulho EP, Martins ALM and Borto-letto N (1994) Estimativas de parâmetros genéticos e ganhos esperados com a seleção de caracteres juvenis em progênies de seringueira. Pesq Agrop Bras 29:1099-1109.
Nga BH and Subramanian S (1974) Variation in Hevea brasiliensis, I. Yield and growth vigour data of the 1937 hand pollinated seedlings. J Rubber Res Inst Malays 24: 69-74.
Paiva JR, Gonçalves PS and Valois ACC (1983) Avaliação preli-minar de comportamento de novos clones de seringueira em Manaus. Pesq Agrop Bras 18:147-158.
Siqueira GR (1978) Estimativas de parâmetros genéticos de serin-gueira (Heveaspp.) em condições de viveiro. MSc Thesis, Universidade Federal de Viçosa, Viçosa, 76 pp.
Tan H (1977) Estimates of general combining ability inHevea
breeding at the Rubber Research Institute of Malaysia. 1. Phase II and III a. Theor Appl Genet 50:29-34.
Tan H (1978a) Assessment of parental performance of yield in
Heveabreeding. Euphytica 27:511-512.
Tan H (1978b) Estimates of parental combining abilities in rubber (Hevea brasiliensis) based on young seedlings progeny. Euphytica 27:817-823.
Tan H and Subramanian S (1976) A five-parent diallel cross anal-ysis for certain characters of youngHeveaseedlings. In: Pro-ceedings of International Rubber Conference, 1975, RRIM, Kuala Lumpur, pp 13-16.
Tan H, Mukherjee TK and Subramniam S (1975) Estimates of ge-netic parameters of certain characters inHevea brasiliensis. Theor Appl Genet 46:181-190.
Valois ACC, Pinheiro E, Conceição HEO and Silva MNC (1978) Competição de porta-enxertos de seringueira e estimativas de parâmetros genéticos. Pesq Agrop Bras 13:49-59. Varghese YA (1999) Germoplasm resources and genetic
im-provement. In: Sethuraj MR and Mathew NM (eds) Natural Rubber: Biology, Cultivation and Technology. Elsevier Sci-ence Publishers, Amsterdam, pp 88-115.
Vencovsky R (1983) Herança quantitativa. In: Paterniani EC and Viegas GP (eds) Melhoramento e Produção do Milho. 2nd ed. Fundação Cargill, Campinas, pp 137-214.
Vencovsky R and Barriga P (1992) Genetica Biometrica no Fito-melhoramento. Sociedade Brasileira de Genética, Riberião Preto, 486 pp.