Universidade Nova de Lisboa
Faculdade de Ciências e Tecnologia
Departamento de Conservação e Restauro
Archaeological Roman Glasses
Comparative characterisation by non-destructive
analytical techniques
Paula Alexandra Pinto Rodrigues
Dissertation presented in fulfilment of the requirements for the
Master’s degree in Conservation and Restoration
Supervisor
Professor Doctor Rui C. da Silva
Instituto Tecnológico e Nuclear
Co-Supervisors
Doctor Luís C. Alves
Instituto Tecnológico e Nuclear
Professor Doctor Márcia Vilarigues
Universidade Nova de Lisboa
Examiner
Doctor M. Fátima Araújo
Instituto Tecnológico e Nuclear
President of the Jury
Professor Doctor Ana Maria Ramos
Universidade Nova de Lisboa
ii
Archaeological Roman Glasses
Comparative characterisation by non-destructive analytical techniques
Copyright © 2011
Paula Alexandra Pinto Rodrigues
Faculdade de Ciências e Tecnologia – Universidade Nova de Lisboa
Universidade Nova de Lisboa
Direitos de cópia
A Faculdade de Ciências e Tecnologia e a Universidade Nova de Lisboa têm o direito, perpétuo e sem limites geográficos, de arquivar e publicar esta dissertação através de exemplares impressos reproduzidos em papel ou de forma digital, ou por qualquer outro meio conhecido ou que venha a ser inventado, e de a divulgar através de repositórios científicos e de admitir a sua cópia e distribuição com objectivos educacionais ou de investigação, não comerciais, desde que seja dado crédito ao autor e editor.
Copyright
iii
Acknowledgements
v
Sumário
As campanhas arqueológicas no sítio da villa Romana da Quinta da Bolacha na Amadora,
Portugal, resultaram na recolha de vários tipos de materiais e objectos diferentes. Estes
apontam para duas ocupações diferentes do espaço, entre os séculos III e IV d.C. De modo a
definir-se materialmente esses momentos, fragmentos de vidro recolhidos em contextos
associados a ambas as ocupações foram analisados não destrutivamente por técnicas de feixes
de iões, nomeadamente a emissão de raios X induzida por partículas (PIXE –Particle Induced X
ray Emission) em combinação com a emissão de raios γ induzida por partículas (PIGE –Particle Induced Gamma Emission) e fluorescência de raios-X (XRF –X ray Fluorescence). Devido ao seu deficiente estado de preservação, nomeadamente a delaminação das superfícies do vidro, os
objectos museológicos não puderam sofrer amostragem ou ser analisados em vácuo, fazendo
da análise em ambiente normal uma melhor opção para o seu estudo. Foram utilizados a nova
linha de feixe externo, MicroFEx, acoplada ao acelerador de partículas do ITN, e o espectrómetro
de micro-fluorescência de raios X, ArtTAX, pertencente ao DCR-FCT-UNL, para a produção de
conjuntos satisfatórios de resultados.
A combinação das técnicas provou ser adequada no estudo deste tipo de materiais, apesar
da necessidade de se efectuar alguns ajustes. Adicionalmente, a combinação das técnicas
espectrométricas PIXE/PIGE versus XRF permitiutambém estabelecer as bases para a utilização
das mesmas como sendo verdadeiramente complementares, tomando partido e assentando
no carácter específico de cada técnica.
O estudo permitiu determinar a ausência de correlação entre a composição dos fragmentos
e os seus contextos arqueológicos de origem. Tal, por sua vez, indica que os vidros
correspondentes têm uma composição comum, transversal aos diferentes períodos de
ocupação. Esta conclusão encontra-se em conformidade com o que é conhecido sobre vidro
Romano, cujas composições se revelaram muito uniformes entre países e ao longo dos séculos
(desde o primeiro milénio até ao séc. IX d.C.). Como consequência e à luz destas descobertas,
seria expectável que poucas ou nenhumas diferenças significativas fossem encontradas entre
vidros de dois períodos de ocupação tão próximos na História (cerca de um século de
diferença).
vii
Summary
The archaeological campaigns in the site of the Roman villa of Quinta da Bolacha at
Amadora, Portugal, provided a recollection of many different types of materials and objects.
These indicate two different occupations of the space, between III and IV centuries AD. In order
to materially define those moments, fragments of glass from contexts belonging to both
occupations were analysed non-destructively by ion beam techniques namely Particle Induced
X ray Emission (PIXE) in combination with Particle Induced Gamma Emission (PIGE) and X ray
Fluorescence (XRF). Because of their poor state of conservation, namely the delamination of
the glass surfaces, the museological objects could not be sampled nor analysed in vacuum,
making in air analysis a better option for their study. The new external microbeam line,
MicroFEx, at ITN particle accelerator, and micro-XRF spectrometer ArtTAX, at DCR-FCT-UNL,
were used in order to produce satisfactory data sets.
The combination of the techniques proved to be adequate to study this kind of materials,
although some adjustments need to be made. Additionally, combining the related
spectrometry techniques PIXE/PIGE versus XRF allowed establishing the starting grounds for
usage of these as truly complimentary, taking advantage of and building on the specific
character of each technique.
The study allowed establishing that no correlation exists between the composition of the
fragments and their contexts of origin. This in turn implies that the corresponding glasses have
a common composition, crossing the different occupation periods. This is in agreement with
what is known of Roman glasses which compositions were found to be fairly uniform across
countries and across centuries (during the first millennium, to the ninth century AD). As a
consequence and on the light of these findings, it is not unexpected that little or no significant
differences were found between glasses from two occupation periods so close in historical
time (roughly one century apart).
ix
Contents
Acknowledgements
………
iii
Sumário ………
.. v
Summary .
………
..
………...
vii
1.
Introduction ………..……….
1
2. Archaeological background
………
.
………
3
2.1.
Roman glass ………
3
2.2. The villa
……….
4
2.3. The glass fragments
………....
4
3. Experimental details ..
………..
7
3.1. Ion Beam Analyses
…….……….
7
3.2.
Energy Dispersive X Ray Fluorescence Spectrometry ………
...
8
4. Results and Discussion
………..………....
9
5. Conclusions
……..………...
25
xi
Index of Figures
Figure 2.1: glass fragments used in the present work ...
5
Figure 4.1: distribution of experimental results/ nominal reference
compositions ratios for Corning Glass Standards (CGS) B and D. ...
9
Figure 4.2: distribution of the sum of analysed elements and total of all
concentrations, calculated by WinFund. ...
13
Figure 4.3: K2O vs Na2O concentrations determined by IBA techniques for
each of the fragments; the legend indicates the fragments’ order numbers
preceded by each respective context. ...
20
Figure 4.4: elemental distribution maps of Si, Ca and Mn on glass fragment
195. ...
22
Figure 4.5: XRF spectra of fragment 195
–
superimposition of data from a
xiii
Index of Tables
Table 2.1: typical average composition of Roman glass (expressed as weight
percentages)...
3
Table 2.2: description of the fragments used in the present work ...
5
Table 4.1: results obtained by IBA and reference values for CGS B (wt %) ...
10
Table 4.2: results obtained by XRF and reference values for CGS B (wt %) ...
11
Table 4.3: results obtained by IBA and XRF and reference values for CGS D
(wt %) ...
12
Table 4.4: compositions obtained by IBA for fragments from context 19
(µg/g except where % is indicated) ...
14
Table 4.5: compositions obtained by IBA for fragments from context 17
(µg/g except where % is indicated) ...
15
Table 4.6: compositions obtained by IBA for fragments from context 15
(µg/g except where % is indicated) ...
16
Table 4.7: compositions obtained by XRF for fragments from context 19
(µg/g except where % is indicated) ...
17
Table 4.8: compositions obtained by XRF for fragments from context
17(µg/g except where % is indicated) ...
18
1
1.
Introduction
The glass fragments studied here belong to 3 three different archaeological contexts, at the
Roman villa of Quinta da Bolacha: two of well determined chronology and a third one, a
revolved context of unknown chronology. This study aims are twofold: i) it intends to
contribute to the material characterisation of the occupation periods by analysing and
comparing the compositions of glass fragments recovered from the different contexts. It also
intends to associate the fragments of the revolved context with those of the other contexts,
trying this way to determine its possible chronological attribution; ii) it intends to compare
measurements made on the same set of samples by different but related spectrometry
techniques, PIXE, PIXE/PIGE and XRF, laying the starting grounds for their usage as
complimentary, taking advantage of and building on the specific character of each technique.
As such, a closely related goal of this work is to ascertain a dependable process which can
provide qualitative and quantitative analysis and be applicable to this particular type of objects,
the archaeological/museological glass.
The unearthed glasses were in a poor state of conservation showing clear delamination of
the glass surfaces, implying that these objects could not be analysed in vacuum. Given this and
the museological nature of the objects analysed, sampling was also not indicated. The use of
non-destructive analytical techniques was thus absolutely imperative.
The new external microbeam line in the Ion Beam Laboratory at Instituto Tecnológico e
Nuclear now in use, MicroFEx, allows non-destructive and quantitative analysis in air, resorting
to PIXE, PIGE and Rutherford Backscattering Spectrometry (RBS), without requiring any
sampling or otherwise special preparation. The analysis by PIGE is, in this case, of vital
importance since Roman glasses are normally characterised by having significant
concentrations of Na which is not detected properly in normal in-air operating conditions by
other non-destructive techniques.
The results of Ion Beam Analysis (IBA) should then be confronted with other existing
techniques, in order to allow a critical comparison. Because IBA techniques are limited
regarding the depth of penetration of the particles used as exciting radiation, XRF technique
was also used for elemental analysis since primary X rays can penetrate deeper in materials
making this technique less dependent on the state of the sample surface [1]. ArtTAX set-up in
the Department of Conservation and Restoration (DCR) at Faculdade de Ciências e Tecnologia,
Universidade Nova de Lisboa (FCT-UNL), has been in use since 2003 providing very useful and
3
2.
Archaeological background
2.1.
Roman glass
During Roman Empire and also through part of Middle Age, glass production was divided in
two phases: primary and secondary. Primary production refers to glass production based on
the fusion of its base components, the raw materials, these being, fundamentally, sand and
natron. Sand would provide the network former – silica – as well as the stabiliser – lime –
together with some contaminants. Natron would provide soda which acted as flux allowing the
decrease of melting temperatures. Primary production of glass is now believed to have happened
mainly in the Syro-Palestine region and in Egypt, where the prime matters were easier to reach
and the technique of glass production had been found and perfected [5]. Some authors defend
the existence of factories of raw glass also in Italy and Gallic and Spanish provinces confirming
Pliny’s writings [6]. The result of this first stage of glass production was then sold and distributed as ingots or chunks throughout the Empire to local workshops where secondary
production took place i.e. the transformation of the ingots or chunks to finished artefacts [5].
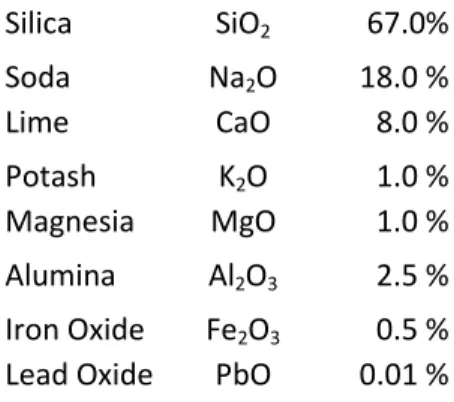
Roman glass was, in its majority, soda-silica-lime glass. Table 2.1 shows the typical average
composition of this historical material [7].
Table 2.1. Typical average composition of Roman glass (expressed as weight percentages)
Silica SiO2 67.0%
Soda Na2O 18.0 %
Lime CaO 8.0 %
Potash K2O 1.0 %
Magnesia MgO 1.0 %
Alumina Al2O3 2.5 %
Iron Oxide Fe2O3 0.5 %
Lead Oxide PbO 0.01 %
Characteristically, Roman glass is considered a low magnesia type when it presents contents
below 1.5 % of MgO and K2O which indicate the use of natron as source of flux. Glasses with
higher contents of magnesia and potash would indicate the use of plant ashes as flux sources
[8]. Prior to the beginning or middle of the I millennium BC, plant ash was the main source of
flux, especially in Egypt and Mesopotamia. At this point, the use of natron became regular
around the Mediterranean and in Europe, until the IX century AD, when it was replaced by
4
2.2.
The villa
The Roman villa of Quinta da Bolacha in Amadora, Portugal, was discovered in 1979 during
prospection of a Roman aqueduct that had already been identified. The archaeological works,
centred in Sectors I and III [9] where structures had been identified, made possible identifying
sealed contexts, which are attributed to III and IV centuries AD, together with revolved
contexts of uncertain dating. The excavation campaigns recovered numerous objects among
which the glass fragments of the present study, which belonged to different contexts. In
general, the objects unearthed from the sealed contexts and the available historical
information consistently point to III and IV centuries AD as the main occupation periods of the
villa. There is the possibility, still under study, of an earlier occupation period too, possibly
dating back to I/II centuries AD. This is as yet subjected to confirmation.
The fragments analysed during this study belong to contexts identified as 19, 17 and 15,
which are briefly described below.
Context 19, attributed to a 1st occupation during 2nd half of the III century/1st half of IV
century, corresponds to a burnt level, where there was a fire. During this occupation, the
structure corresponded to a large room of a habitation. The walls were covered with painted
stuccoes and the room had a central stuccoed pillar and a drain next to the wall.
Context 17 is attributed to a 2nd occupation, after the fire, during the second half of the IV
century. At this time, the room was remodelled, a wall having been built to divide it. The
central pillar was destroyed and 3 more drains and a fireplace were built in that space. These
new structures and the objects collected, such as anforae, common ceramics and terra sigillata
recipients, indicate that the new space was used as a kitchen. The context is mainly composed
of fragmented ceramic shingles, suggesting a sudden event, corresponding to the ruin phase of
the space, which is ascribed to the end of the IV century.
In context 15, very fragmented archaeological materials of diverse chronologies, including
Roman, were gathered. This context was formed recently and is situated exactly above the
sealed Roman contexts [9].
2.3.
The glass fragments
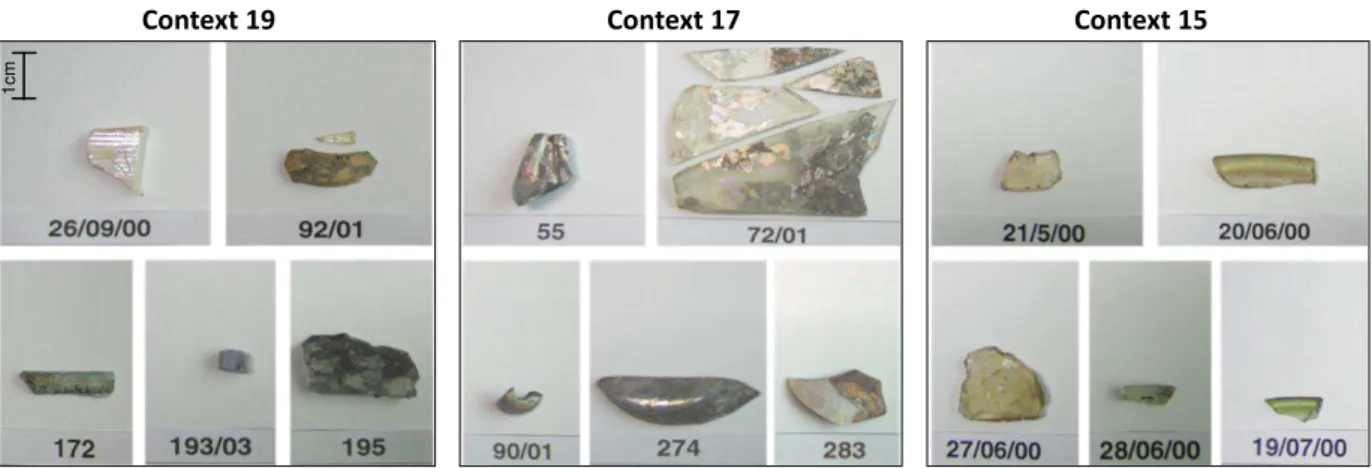
The fragments studied here were chosen as the most representative of each context. Figure
2.1 displays pictures of the glass fragments where they appear identified and grouped by
5
Context 19 Context 17 Context 15
Figure 2.1: glass fragments used in the present work
Most of the fragments are of undermined typology, with exception of the blue tesserae–
id.193/03 – and a bead fragment – id.90/01. All the fragments of undetermined typology are
concave, except fragment 195 which is completely flat.
Table 2.2 resumes the objects' description.
Table 2.2: description of the fragments used in the present work
Order number Context
Fragment
Typology
Details
1
19
26-09-00
Undetermined
Border with cannelures
2 and 3*
19
92/01
Undetermined
-
4
19
172
Undetermined
Border
5
19
193/03
Tesserae
Blue
6
19
195
Undetermined
Flat
7
17
55
Undetermined
Handle (possibly)
8
17
72/01
Undetermined
-
9
17
90/01
Bead
-
10
17
274
Undetermined
Bottom
11
17
283
Undetermined
-
12
15
21-05-00
Undetermined
-
13
15
20-06-00
Undetermined
Border
14
15
27-06-00
Undetermined
-
15
15
28-06-00
Undetermined
Border
16
15
19-07-00
Undetermined
Border
* Larger and smaller, respectively.
1
7
3.
Experimental details
As the recovered glass fragments displayed areas with distinctive corrosion features, care
had to be taken when selecting representative zones. For bulk analysis, all the areas were
chosen in order to be able to get a good flat surface with no apparent major alterations.
The objects were analysed resorting to the IBA (Ion Beam Analysis) techniques referred to
above, PIXE and PIGE, and XRF.
3.1.
Ion Beam Analyses
Particle Induced X ray Emission (PIXE) combined with Particle Induced Gamma Emission
(PIGE), were simultaneously used to determine the elemental compositions of the Roman glass
pieces. Excitation of both target atomic and nuclear levels yielding characteristic X and gamma
rays was provided by a 2 MeV proton beam from a 2.5 MV Van de Graaff accelerator, focused
by a OM50 triplet quadrupole system onto the target, 3 mm away from a 100 nm thick Si3N4
vacuum extraction window. The 1 nA beam focused on target illuminated a spot measuring
60 × 65 µm2. Helium gas was made to flood the analysis region with a flow of 4.5 L/min, at
normal atmospheric pressure, in order to i) reduce energy losses of the incoming beam and
attenuation of the emitted X rays, and ii) remove Ar, thus eliminating it as a source of spectral
interference. The OM-DAQ beam steering control allowed scanning up to 1 × 1 mm2 target area
in synchronism with spectral data acquisition. Accurate target positioning was assured by two
converging laser beams intersecting each other at the beam spot, 3 mm distant from the beam
exit nozzle. A mini-video camera assists the whole procedure.
The PIXE and PIGE spectra were simultaneously collected using one 30 mm2 Bruker AXS
Xflash SDD (silicon drift) X rays detector of 145 eV energy resolution at 5.9 keV, and one large
volume HPGe detector with 45% efficiency and 1.9 keV energy resolution (at 1.3325 MeV). The
SDD detector was placed at 45º to the incoming beam direction and HPGe detector was placed
at 90º.
The PIXE spectra were analysed with the AXIL [10] program for line deconvolution and
DATTPIXE [11] for quantification. Although He was sprayed into the volume in front of the
beam exit nozzle and SDD detector, aiming at reducing the energy losses of beam protons and
attenuation of X rays, the quantification of Na was only possible through PIGE, by measuring
the yield of the 440 keV gamma emission line resulting from the 23Na (p, p´γ) 23Na reaction. A
rotating metallic vane was used for normalising charge collection, by measuring the X rays
produced when intercepting the proton beam. Placed inside the microprobe vacuum chamber,
8
were compared for each sample with those obtained with Corning glass standards, allowing
assessment of the quality of the detection system calibration, and control of experimental
parameters.
3.2.
Energy Dispersive X Ray Fluorescence Spectrometry
The energy dispersive XRF was performed with ArtTAX, a portable spectrometer equipped
with a SDD detector and a CCD camera and laser light diode for sample positioning. The
primary X rays are produced by a Mo anode and the beam spot size is c.a. 100 µm across. This
device also allows He flooding for lower Z elements detection enhancement [12].
Spectra were collected at 40 kV voltage and 600 µA current with typically 360 s acquisition
time and normalised to the compositions of Corning Glass standards [13]. The XRF spectra
were analysed resorting to WinAxil© software package, allowing spectra display, manipulation,
deconvolution and, with WinFund© module, quantification based on fundamental parameters
9
4.
Results and Discussion
Both IBA and XRF results were analysed by resorting to the comparison with the Corning
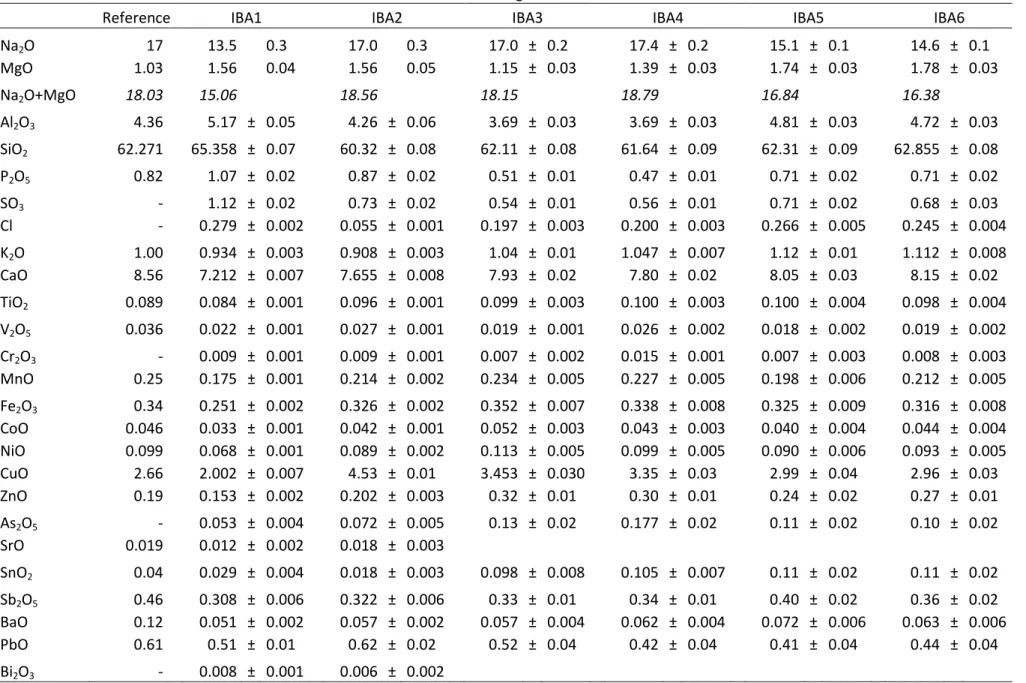
glass standards, following the same procedure as Wobrauschek et al. [15]. Tables 4.1 to 4.3
(next pages) show the quantitative results for these standards, obtained by both techniques.
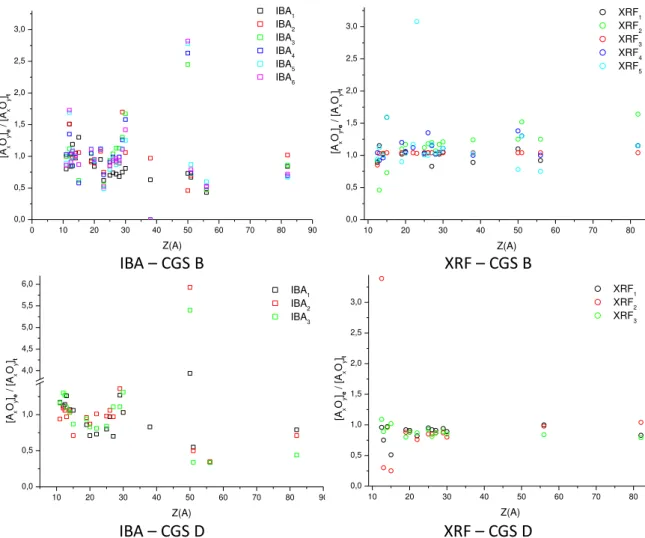
The plots in Fig. 4.1 display the distribution of the ratios of the experimental results to the
nominal reference compositions for each of the oxides identified by the atomic number of the
cation [13], allowing the quality of the analytical procedure and solutions to be evaluated.
IBA
–
CGS B
XRF
–
CGS B
IBA
–
CGS D
XRF
–
CGS D
Figure 4.1: distribution of experimental results/ nominal reference compositions ratios for Corning Glass Standards (CGS) B and D.
Clearly, for both CGS B and CGS D, the scattering of the ratios is significantly higher with IBA
techniques than with XRF, especially for the oxides of elements present in concentrations of
the order of µg/g. As the distributions do not follow systematic patterns, these results may
indicate fluctuations related to the experimental conditions, e.g. the state of the analysed
surfaces, presenting areas free from corrosion, together with areas partially affected by
corrosion to various degrees. Also the high concentrations of some metal oxides, such as tin
and copper or zinc and tin/antimonyseen on the IBA plots, as well as the presence of some
0 10 20 30 40 50 60 70 80 90
0,0 0,5 1,0 1,5 2,0 2,5 3,0 [Ax Oy ]e / [A x Oy ]t Z(A) IBA1 IBA2 IBA3 IBA4 IBA5 IBA6
10 20 30 40 50 60 70 80
0,0 0,5 1,0 1,5 2,0 2,5 3,0 [A x Oy ]e / [A x Oy ]t Z(A) XRF1 XRF2 XRF3 XRF4 XRF5
10 20 30 40 50 60 70 80 90
0,0 0,5 1,0 4,0 4,5 5,0 5,5 6,0 [A x Oy ]e / [A x Oy ]t Z(A) IBA1 IBA2 IBA3
10 20 30 40 50 60 70 80
10
Table 4.1: results obtained by IBA and reference values for CGS B (wt %) Corning B
Reference IBA1 IBA2 IBA3 IBA4 IBA5 IBA6
Na2O 17 13.5 0.3 17.0 0.3 17.0 ± 0.2 17.4 ± 0.2 15.1 ± 0.1 14.6 ± 0.1
MgO 1.03 1.56 0.04 1.56 0.05 1.15 ± 0.03 1.39 ± 0.03 1.74 ± 0.03 1.78 ± 0.03
Na2O+MgO 18.03 15.06
18.56
18.15
18.79
16.84
16.38
Al2O3 4.36 5.17 ± 0.05 4.26 ± 0.06 3.69 ± 0.03 3.69 ± 0.03 4.81 ± 0.03 4.72 ± 0.03
SiO2 62.271 65.358 ± 0.07 60.32 ± 0.08 62.11 ± 0.08 61.64 ± 0.09 62.31 ± 0.09 62.855 ± 0.08
P2O5 0.82 1.07 ± 0.02 0.87 ± 0.02 0.51 ± 0.01 0.47 ± 0.01 0.71 ± 0.02 0.71 ± 0.02
SO3 - 1.12 ± 0.02 0.73 ± 0.02 0.54 ± 0.01 0.56 ± 0.01 0.71 ± 0.02 0.68 ± 0.03
Cl - 0.279 ± 0.002 0.055 ± 0.001 0.197 ± 0.003 0.200 ± 0.003 0.266 ± 0.005 0.245 ± 0.004
K2O 1.00 0.934 ± 0.003 0.908 ± 0.003 1.04 ± 0.01 1.047 ± 0.007 1.12 ± 0.01 1.112 ± 0.008
CaO 8.56 7.212 ± 0.007 7.655 ± 0.008 7.93 ± 0.02 7.80 ± 0.02 8.05 ± 0.03 8.15 ± 0.02
TiO2 0.089 0.084 ± 0.001 0.096 ± 0.001 0.099 ± 0.003 0.100 ± 0.003 0.100 ± 0.004 0.098 ± 0.004
V2O5 0.036 0.022 ± 0.001 0.027 ± 0.001 0.019 ± 0.001 0.026 ± 0.002 0.018 ± 0.002 0.019 ± 0.002
Cr2O3 - 0.009 ± 0.001 0.009 ± 0.001 0.007 ± 0.002 0.015 ± 0.001 0.007 ± 0.003 0.008 ± 0.003
MnO 0.25 0.175 ± 0.001 0.214 ± 0.002 0.234 ± 0.005 0.227 ± 0.005 0.198 ± 0.006 0.212 ± 0.005
Fe2O3 0.34 0.251 ± 0.002 0.326 ± 0.002 0.352 ± 0.007 0.338 ± 0.008 0.325 ± 0.009 0.316 ± 0.008
CoO 0.046 0.033 ± 0.001 0.042 ± 0.001 0.052 ± 0.003 0.043 ± 0.003 0.040 ± 0.004 0.044 ± 0.004
NiO 0.099 0.068 ± 0.001 0.089 ± 0.002 0.113 ± 0.005 0.099 ± 0.005 0.090 ± 0.006 0.093 ± 0.005
CuO 2.66 2.002 ± 0.007 4.53 ± 0.01 3.453 ± 0.030 3.35 ± 0.03 2.99 ± 0.04 2.96 ± 0.03
ZnO 0.19 0.153 ± 0.002 0.202 ± 0.003 0.32 ± 0.01 0.30 ± 0.01 0.24 ± 0.02 0.27 ± 0.01
As2O5 - 0.053 ± 0.004 0.072 ± 0.005 0.13 ± 0.02 0.177 ± 0.02 0.11 ± 0.02 0.10 ± 0.02
SrO 0.019 0.012 ± 0.002 0.018 ± 0.003
SnO2 0.04 0.029 ± 0.004 0.018 ± 0.003 0.098 ± 0.008 0.105 ± 0.007 0.11 ± 0.02 0.11 ± 0.02
Sb2O5 0.46 0.308 ± 0.006 0.322 ± 0.006 0.33 ± 0.01 0.34 ± 0.01 0.40 ± 0.02 0.36 ± 0.02
BaO 0.12 0.051 ± 0.002 0.057 ± 0.002 0.057 ± 0.004 0.062 ± 0.004 0.072 ± 0.006 0.063 ± 0.006
PbO 0.61 0.51 ± 0.01 0.62 ± 0.02 0.52 ± 0.04 0.42 ± 0.04 0.41 ± 0.04 0.44 ± 0.04
11
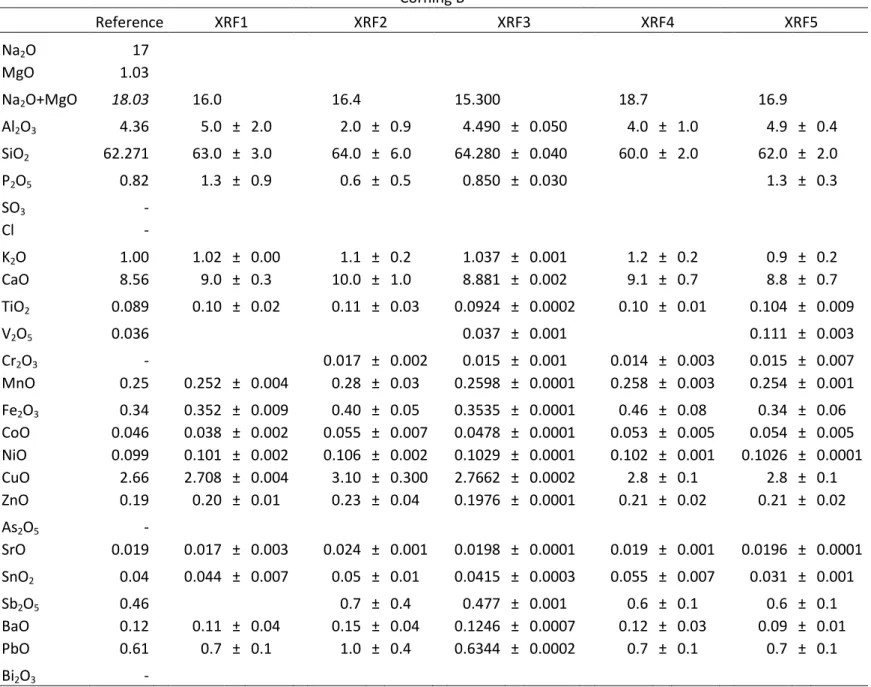
Table 4.2: results obtained by XRF and reference values for CGS B (wt %) Corning B
Reference XRF1 XRF2 XRF3 XRF4 XRF5
Na2O 17
MgO 1.03
Na2O+MgO 18.03 16.0
16.4 15.300 18.7 16.9
Al2O3 4.36 5.0 ± 2.0 2.0 ± 0.9 4.490 ± 0.050 4.0 ± 1.0 4.9 ± 0.4
SiO2 62.271 63.0 ± 3.0 64.0 ± 6.0 64.280 ± 0.040 60.0 ± 2.0 62.0 ± 2.0
P2O5 0.82 1.3 ± 0.9 0.6 ± 0.5 0.850 ± 0.030 1.3 ± 0.3
SO3 -
Cl -
K2O 1.00 1.02 ± 0.00 1.1 ± 0.2 1.037 ± 0.001 1.2 ± 0.2 0.9 ± 0.2
CaO 8.56 9.0 ± 0.3 10.0 ± 1.0 8.881 ± 0.002 9.1 ± 0.7 8.8 ± 0.7
TiO2 0.089 0.10 ± 0.02 0.11 ± 0.03 0.0924 ± 0.0002 0.10 ± 0.01 0.104 ± 0.009
V2O5 0.036
0.037 ± 0.001 0.111 ± 0.003
Cr2O3 -
0.017 ± 0.002 0.015 ± 0.001 0.014 ± 0.003 0.015 ± 0.007
MnO 0.25 0.252 ± 0.004 0.28 ± 0.03 0.2598 ± 0.0001 0.258 ± 0.003 0.254 ± 0.001
Fe2O3 0.34 0.352 ± 0.009 0.40 ± 0.05 0.3535 ± 0.0001 0.46 ± 0.08 0.34 ± 0.06
CoO 0.046 0.038 ± 0.002 0.055 ± 0.007 0.0478 ± 0.0001 0.053 ± 0.005 0.054 ± 0.005
NiO 0.099 0.101 ± 0.002 0.106 ± 0.002 0.1029 ± 0.0001 0.102 ± 0.001 0.1026 ± 0.0001
CuO 2.66 2.708 ± 0.004 3.10 ± 0.300 2.7662 ± 0.0002 2.8 ± 0.1 2.8 ± 0.1
ZnO 0.19 0.20 ± 0.01 0.23 ± 0.04 0.1976 ± 0.0001 0.21 ± 0.02 0.21 ± 0.02
As2O5 -
SrO 0.019 0.017 ± 0.003 0.024 ± 0.001 0.0198 ± 0.0001 0.019 ± 0.001 0.0196 ± 0.0001
SnO2 0.04 0.044 ± 0.007 0.05 ± 0.01 0.0415 ± 0.0003 0.055 ± 0.007 0.031 ± 0.001
Sb2O5 0.46
0.7 ± 0.4 0.477 ± 0.001 0.6 ± 0.1 0.6 ± 0.1
BaO 0.12 0.11 ± 0.04 0.15 ± 0.04 0.1246 ± 0.0007 0.12 ± 0.03 0.09 ± 0.01
PbO 0.61 0.7 ± 0.1 1.0 ± 0.4 0.6344 ± 0.0002 0.7 ± 0.1 0.7 ± 0.1
12
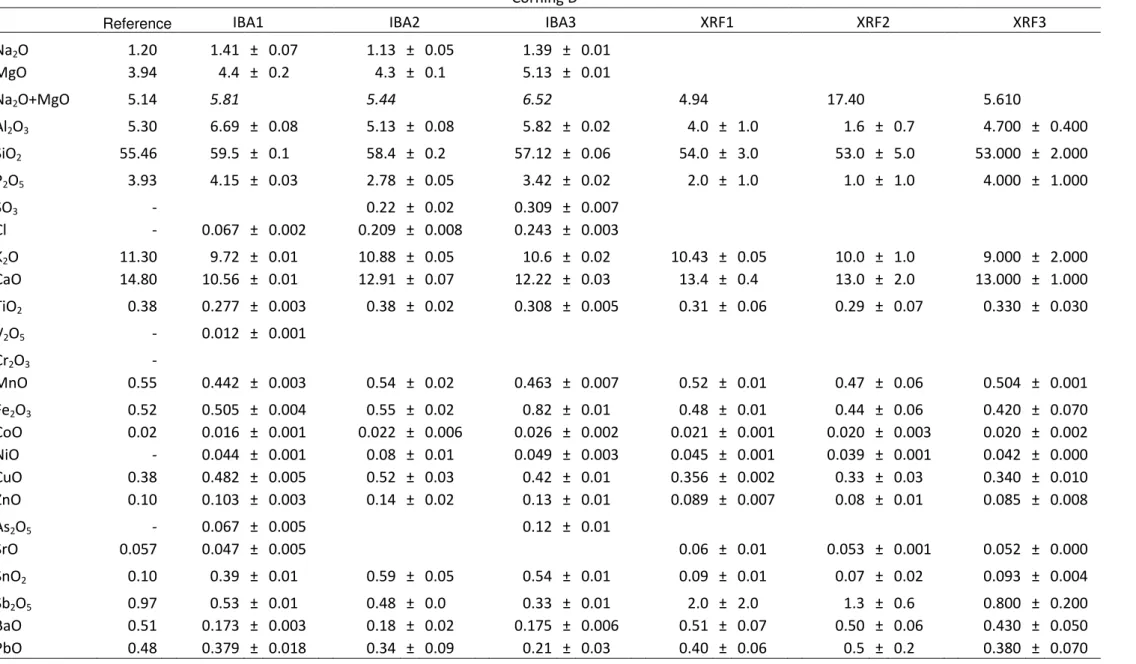
Table 4.3: results obtained by IBA and XRF and reference values for CGS D (wt %) Corning D
Reference IBA1 IBA2 IBA3 XRF1 XRF2 XRF3
Na2O 1.20 1.41 ± 0.07 1.13 ± 0.05 1.39 ± 0.01
MgO 3.94 4.4 ± 0.2 4.3 ± 0.1 5.13 ± 0.01
Na2O+MgO 5.14 5.81
5.44 6.52
4.94
17.40
5.610
Al2O3 5.30 6.69 ± 0.08 5.13 ± 0.08 5.82 ± 0.02 4.0 ± 1.0 1.6 ± 0.7 4.700 ± 0.400
SiO2 55.46 59.5 ± 0.1 58.4 ± 0.2 57.12 ± 0.06 54.0 ± 3.0 53.0 ± 5.0 53.000 ± 2.000
P2O5 3.93 4.15 ± 0.03 2.78 ± 0.05 3.42 ± 0.02 2.0 ± 1.0 1.0 ± 1.0 4.000 ± 1.000
SO3 - 0.22 ± 0.02 0.309 ± 0.007
Cl - 0.067 ± 0.002 0.209 ± 0.008 0.243 ± 0.003
K2O 11.30 9.72 ± 0.01 10.88 ± 0.05 10.6 ± 0.02 10.43 ± 0.05 10.0 ± 1.0 9.000 ± 2.000
CaO 14.80 10.56 ± 0.01 12.91 ± 0.07 12.22 ± 0.03 13.4 ± 0.4 13.0 ± 2.0 13.000 ± 1.000
TiO2 0.38 0.277 ± 0.003 0.38 ± 0.02 0.308 ± 0.005 0.31 ± 0.06 0.29 ± 0.07 0.330 ± 0.030
V2O5 - 0.012 ± 0.001
Cr2O3 -
MnO 0.55 0.442 ± 0.003 0.54 ± 0.02 0.463 ± 0.007 0.52 ± 0.01 0.47 ± 0.06 0.504 ± 0.001
Fe2O3 0.52 0.505 ± 0.004 0.55 ± 0.02 0.82 ± 0.01 0.48 ± 0.01 0.44 ± 0.06 0.420 ± 0.070
CoO 0.02 0.016 ± 0.001 0.022 ± 0.006 0.026 ± 0.002 0.021 ± 0.001 0.020 ± 0.003 0.020 ± 0.002
NiO - 0.044 ± 0.001 0.08 ± 0.01 0.049 ± 0.003 0.045 ± 0.001 0.039 ± 0.001 0.042 ± 0.000
CuO 0.38 0.482 ± 0.005 0.52 ± 0.03 0.42 ± 0.01 0.356 ± 0.002 0.33 ± 0.03 0.340 ± 0.010
ZnO 0.10 0.103 ± 0.003 0.14 ± 0.02 0.13 ± 0.01 0.089 ± 0.007 0.08 ± 0.01 0.085 ± 0.008
As2O5 - 0.067 ± 0.005 0.12 ± 0.01
SrO 0.057 0.047 ± 0.005
0.06 ± 0.01 0.053 ± 0.001 0.052 ± 0.000
SnO2 0.10 0.39 ± 0.01 0.59 ± 0.05 0.54 ± 0.01 0.09 ± 0.01 0.07 ± 0.02 0.093 ± 0.004
Sb2O5 0.97 0.53 ± 0.01 0.48 ± 0.0 0.33 ± 0.01 2.0 ± 2.0 1.3 ± 0.6 0.800 ± 0.200
BaO 0.51 0.173 ± 0.003 0.18 ± 0.02 0.175 ± 0.006 0.51 ± 0.07 0.50 ± 0.06 0.430 ± 0.050
13
elements which are not specified in the reference compositions, may indicate contamination
from laboratory tools used to handle the standards or the sample positioning system.
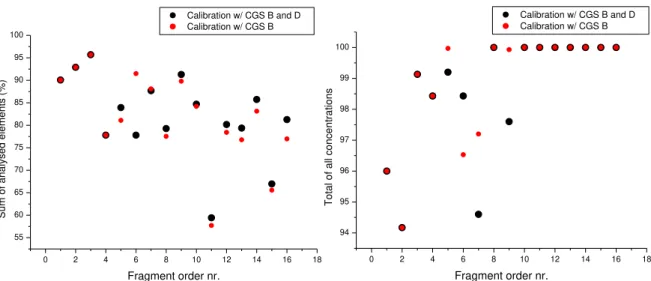
Regarding the calibration used with XRF spectra and the WinFund© software, it is possible
to see in Fig. 4.2 that, by calibrating with two glass standards instead of one – even if this one is
more similar in composition to the analysed samples – the sum of analysed elements comes
closer to 100% for the majority of the samples. This means that the lack of a second standard,
in this case, affects the values calculated by difference for the oxides of light elements, Na2O
and MgO (given as Na2MgO2), as well as those of oxides not present in the standard’s
composition.
Figure 4.2: distribution of the sum of analysed elements and total of all concentrations, calculated by WinFund.
Tables 4.4 to 4.9 (next pages) summarise the compositions of the glass fragments from the different contexts, as obtained by both techniques.
0 2 4 6 8 10 12 14 16 18
55 60 65 70 75 80 85 90 95 100 Su m o f a n a lys e d e le m e n ts ( % )
Fragment order nr.
Calibration w/ CGS B and D Calibration w/ CGS B
0 2 4 6 8 10 12 14 16 18
94 95 96 97 98 99 100 T o ta l o f a ll co n ce n tr a tio n s
Fragment order nr.
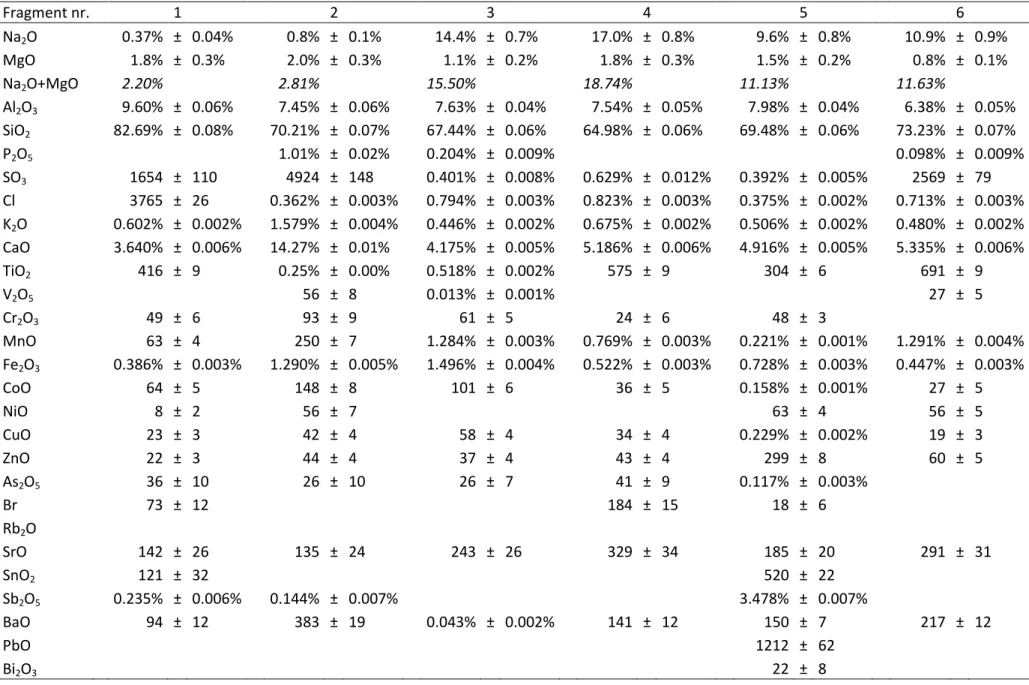
14
Table 4.4: compositions obtained by IBA for fragments from context 19 (µg/g except where % is indicated)
Fragment nr. 1 2 3 4 5 6
Na2O 0.37% ± 0.04% 0.8% ± 0.1% 14.4% ± 0.7% 17.0% ± 0.8% 9.6% ± 0.8% 10.9% ± 0.9%
MgO 1.8% ± 0.3% 2.0% ± 0.3% 1.1% ± 0.2% 1.8% ± 0.3% 1.5% ± 0.2% 0.8% ± 0.1%
Na2O+MgO 2.20%
2.81% 15.50% 18.74% 11.13% 11.63%
Al2O3 9.60% ± 0.06% 7.45% ± 0.06% 7.63% ± 0.04% 7.54% ± 0.05% 7.98% ± 0.04% 6.38% ± 0.05%
SiO2 82.69% ± 0.08% 70.21% ± 0.07% 67.44% ± 0.06% 64.98% ± 0.06% 69.48% ± 0.06% 73.23% ± 0.07%
P2O5
1.01% ± 0.02% 0.204% ± 0.009%
0.098% ± 0.009%
SO3 1654 ± 110 4924 ± 148 0.401% ± 0.008% 0.629% ± 0.012% 0.392% ± 0.005% 2569 ± 79
Cl 3765 ± 26 0.362% ± 0.003% 0.794% ± 0.003% 0.823% ± 0.003% 0.375% ± 0.002% 0.713% ± 0.003%
K2O 0.602% ± 0.002% 1.579% ± 0.004% 0.446% ± 0.002% 0.675% ± 0.002% 0.506% ± 0.002% 0.480% ± 0.002%
CaO 3.640% ± 0.006% 14.27% ± 0.01% 4.175% ± 0.005% 5.186% ± 0.006% 4.916% ± 0.005% 5.335% ± 0.006%
TiO2 416 ± 9 0.25% ± 0.00% 0.518% ± 0.002% 575 ± 9 304 ± 6 691 ± 9
V2O5
56 ± 8 0.013% ± 0.001%
27 ± 5
Cr2O3 49 ± 6 93 ± 9 61 ± 5 24 ± 6 48 ± 3
MnO 63 ± 4 250 ± 7 1.284% ± 0.003% 0.769% ± 0.003% 0.221% ± 0.001% 1.291% ± 0.004%
Fe2O3 0.386% ± 0.003% 1.290% ± 0.005% 1.496% ± 0.004% 0.522% ± 0.003% 0.728% ± 0.003% 0.447% ± 0.003%
CoO 64 ± 5 148 ± 8 101 ± 6 36 ± 5 0.158% ± 0.001% 27 ± 5
NiO 8 ± 2 56 ± 7
63 ± 4 56 ± 5
CuO 23 ± 3 42 ± 4 58 ± 4 34 ± 4 0.229% ± 0.002% 19 ± 3
ZnO 22 ± 3 44 ± 4 37 ± 4 43 ± 4 299 ± 8 60 ± 5
As2O5 36 ± 10 26 ± 10 26 ± 7 41 ± 9 0.117% ± 0.003%
Br 73 ± 12
184 ± 15 18 ± 6
Rb2O
SrO 142 ± 26 135 ± 24 243 ± 26 329 ± 34 185 ± 20 291 ± 31
SnO2 121 ± 32
520 ± 22
Sb2O5 0.235% ± 0.006% 0.144% ± 0.007%
3.478% ± 0.007%
BaO 94 ± 12 383 ± 19 0.043% ± 0.002% 141 ± 12 150 ± 7 217 ± 12
PbO
1212 ± 62
Bi2O3
22 ± 8
15
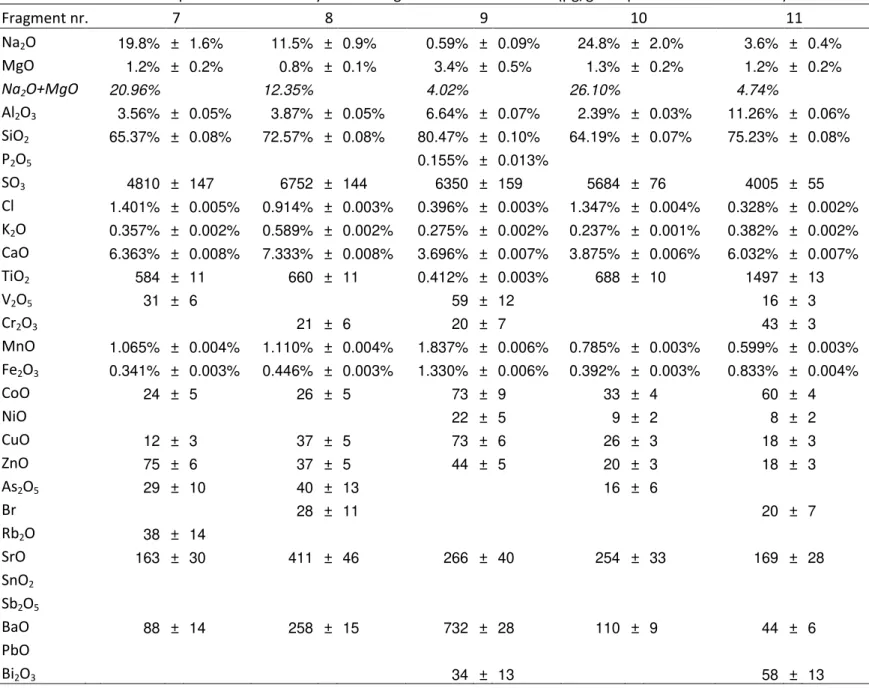
Table 4.5: compositions obtained by IBA for fragments from context 17 (µg/g except where % is indicated)
Fragment nr. 7 8 9 10 11
Na2O 19.8% ± 1.6% 11.5% ± 0.9% 0.59% ± 0.09% 24.8% ± 2.0% 3.6% ± 0.4%
MgO 1.2% ± 0.2% 0.8% ± 0.1% 3.4% ± 0.5% 1.3% ± 0.2% 1.2% ± 0.2%
Na2O+MgO 20.96% 12.35%
4.02% 26.10% 4.74%
Al2O3 3.56% ± 0.05% 3.87% ± 0.05% 6.64% ± 0.07% 2.39% ± 0.03% 11.26% ± 0.06%
SiO2 65.37% ± 0.08% 72.57% ± 0.08% 80.47% ± 0.10% 64.19% ± 0.07% 75.23% ± 0.08%
P2O5
0.155% ± 0.013%
SO3 4810 ± 147 6752 ± 144 6350 ± 159 5684 ± 76 4005 ± 55
Cl 1.401% ± 0.005% 0.914% ± 0.003% 0.396% ± 0.003% 1.347% ± 0.004% 0.328% ± 0.002%
K2O 0.357% ± 0.002% 0.589% ± 0.002% 0.275% ± 0.002% 0.237% ± 0.001% 0.382% ± 0.002%
CaO 6.363% ± 0.008% 7.333% ± 0.008% 3.696% ± 0.007% 3.875% ± 0.006% 6.032% ± 0.007%
TiO2 584 ± 11 660 ± 11 0.412% ± 0.003% 688 ± 10 1497 ± 13
V2O5 31 ± 6
59 ± 12
16 ± 3
Cr2O3
21 ± 6 20 ± 7
43 ± 3
MnO 1.065% ± 0.004% 1.110% ± 0.004% 1.837% ± 0.006% 0.785% ± 0.003% 0.599% ± 0.003%
Fe2O3 0.341% ± 0.003% 0.446% ± 0.003% 1.330% ± 0.006% 0.392% ± 0.003% 0.833% ± 0.004%
CoO 24 ± 5 26 ± 5 73 ± 9 33 ± 4 60 ± 4
NiO
22 ± 5 9 ± 2 8 ± 2
CuO 12 ± 3 37 ± 5 73 ± 6 26 ± 3 18 ± 3
ZnO 75 ± 6 37 ± 5 44 ± 5 20 ± 3 18 ± 3
As2O5 29 ± 10 40 ± 13
16 ± 6
Br
28 ± 11
20 ± 7
Rb2O 38 ± 14
SrO 163 ± 30 411 ± 46 266 ± 40 254 ± 33 169 ± 28
SnO2
Sb2O5
BaO 88 ± 14 258 ± 15 732 ± 28 110 ± 9 44 ± 6
PbO
Bi2O3
34 ± 13
16
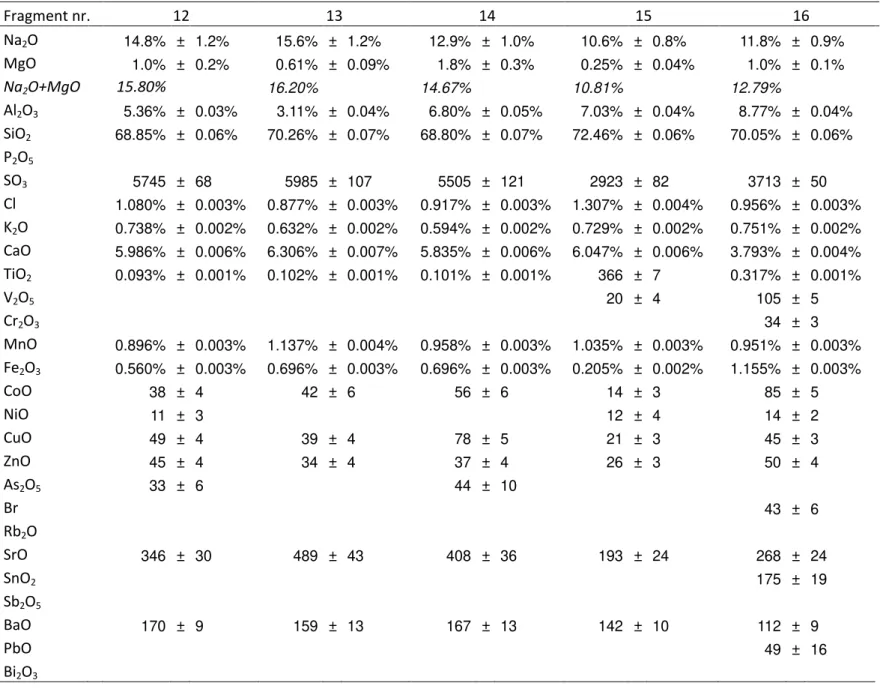
Table 4.6: compositions obtained by IBA for fragments from context 15 (µg/g except where % is indicated)
Fragment nr. 12 13 14 15 16
Na2O 14.8% ± 1.2% 15.6% ± 1.2% 12.9% ± 1.0% 10.6% ± 0.8% 11.8% ± 0.9%
MgO 1.0% ± 0.2% 0.61% ± 0.09% 1.8% ± 0.3% 0.25% ± 0.04% 1.0% ± 0.1%
Na2O+MgO 15.80%
16.20%
14.67%
10.81%
12.79%
Al2O3 5.36% ± 0.03% 3.11% ± 0.04% 6.80% ± 0.05% 7.03% ± 0.04% 8.77% ± 0.04%
SiO2 68.85% ± 0.06% 70.26% ± 0.07% 68.80% ± 0.07% 72.46% ± 0.06% 70.05% ± 0.06%
P2O5
SO3 5745 ± 68 5985 ± 107 5505 ± 121 2923 ± 82 3713 ± 50
Cl 1.080% ± 0.003% 0.877% ± 0.003% 0.917% ± 0.003% 1.307% ± 0.004% 0.956% ± 0.003%
K2O 0.738% ± 0.002% 0.632% ± 0.002% 0.594% ± 0.002% 0.729% ± 0.002% 0.751% ± 0.002%
CaO 5.986% ± 0.006% 6.306% ± 0.007% 5.835% ± 0.006% 6.047% ± 0.006% 3.793% ± 0.004%
TiO2 0.093% ± 0.001% 0.102% ± 0.001% 0.101% ± 0.001% 366 ± 7 0.317% ± 0.001%
V2O5 20 ± 4 105 ± 5
Cr2O3 34 ± 3
MnO 0.896% ± 0.003% 1.137% ± 0.004% 0.958% ± 0.003% 1.035% ± 0.003% 0.951% ± 0.003%
Fe2O3 0.560% ± 0.003% 0.696% ± 0.003% 0.696% ± 0.003% 0.205% ± 0.002% 1.155% ± 0.003%
CoO 38 ± 4 42 ± 6 56 ± 6 14 ± 3 85 ± 5
NiO 11 ± 3 12 ± 4 14 ± 2
CuO 49 ± 4 39 ± 4 78 ± 5 21 ± 3 45 ± 3
ZnO 45 ± 4 34 ± 4 37 ± 4 26 ± 3 50 ± 4
As2O5 33 ± 6 44 ± 10
Br 43 ± 6
Rb2O
SrO 346 ± 30 489 ± 43 408 ± 36 193 ± 24 268 ± 24
SnO2 175 ± 19
Sb2O5
BaO 170 ± 9 159 ± 13 167 ± 13 142 ± 10 112 ± 9
PbO 49 ± 16
17
Table 4.7: compositions obtained by XRF for fragments from context 19 (µg/g except where % is indicated)
Fragment nr. 1 2 3 4 5 6
Na2O+MgO 5.93%
1.25%
3.47%
20.63%
15.23%
20.63%
Al2O3 11.4% ± 1.0% 6.3% ± 0.6% 7.8% ± 0.7% 9.8% ± 0.8% 5.3% ± 0.6% 5.3% ± 0.4%
SiO2 72.3% ± 2.3% 62.0% ± 2.0% 72.7% ± 2.7% 59.0% ± 2.0% 62.0% ± 2.0% 73.3% ± 3.0%
P2O5 0.32% ± 0.08% 0.29% ± 0.07% 1.0% ± 0.3% 0.33% ± 0.09% 0.32% ± 0.09% 0.5% ± 0.1%
SO3 70 ± 15 475 ± 30 0.25% ± 0.01% 0.43% ± 0.02% 0.18% ± 0.01% 393 ± 23
Cl 245 ± 12 0.11% ± 0.01% 0.67% ± 0.03% 0.23% ± 0.01% 0.24% ± 0.02% 0.61% ± 0.03%
K2O 1.1% ± 0.2% 1.4% ± 0.2% 0.50% ± 0.08% 1.0% ± 0.2% 0.47% ± 0.08% 0.7% ± 0.1%
CaO 4.2% ± 0.3% 20.0% ± 1.3% 6.9% ± 0.5% 5.6% ± 0.4% 6.6% ± 0.5% 8.6% ± 0.6%
TiO2 467 ± 40 0.23% ± 0.02% 0.90% ± 0.08% 600 ± 53 900 ± 87 667 ± 57
V2O5 160 ± 10 0.30% ± 0.01% 590 ± 15 770 ± 20 0.163% ± 0.005%
Cr2O3 113 ± 5 49 ± 3 231 ± 9 14 ± 1 19 ± 1 30 ± 2
MnO 114 ± 1 488 ± 2 2.63% ± 0.01% 0.705% ± 0.002% 0.401% ± 0.002% 1.66% ± 0.01%
Fe2O3 0.49% ± 0.08% 1.7% ± 0.3% 2.43% ± 0.40% 0.50% ± 0.08% 1.1% ± 0.2% 0.41% ± 0.07%
CoO 41 ± 4 117 ± 10 163 ± 17 31 ± 3 0.29% ± 0.03% 40 ± 4
NiO 4.1 ± 0.2 12.9 ± 0.2 18.7 ± 0.2 98 ± 3
CuO 28 ± 1 48 ± 2 103 ± 4 35 ± 1 0.36% ± 0.01% 20 ± 1
ZnO 54 ± 5 79 ± 8 85 ± 8 52 ± 5 433 ± 40 50 ± 5
As2O5 39 ± 2 75 ± 3 22 ± 1 0.15% ± 0.01%
Br 51 ± 3 40 ± 2 36 ± 2 124 ± 6 34 ± 4 27 ± 1
SrO 447 ± 2 756 ± 4 734 ± 4 498 ± 3 428 ± 5 573 ± 3
SnO2 158 ± 5 0.1% ± 0.4% 220 ± 8 262 ± 8 263 ± 9 377 ± 10
Sb2O5 0.24% ± 0.05% 0.26% ± 0.05% 6.7% ± 1.0%
BaO 613 ± 73 420 ± 50 0.18% ± 0.02% 333 ± 40 620 ± 77
PbO 124 ± 20 45 ± 8 137 ± 23 120 ± 20 967 ± 233 453 ± 77
Sum of analysed elements 90.07% 92.90% 95.70% 77.80% 83.93% 77.80%
18
Table 4.8: compositions obtained by XRF for fragments from context 17(µg/g except where % is indicated)
Fragment nr. 7 8 9 10 11
Na2O+MgO 6.92% 20.70%
6.28%
15.30%
40.57%
Al2O3 4.8% ± 0.4% 4.7% ± 0.4% 7.7% ± 0.7% 3.8% ± 0.3% 3.7% ± 0.3%
SiO2 68.7% ± 2.3% 62.3% ± 2.0% 71.7% ± 2.3% 72.0% ± 3.0% 43.3% ± 1.7%
P2O5 500 ± 200 0.5% ± 0.1% 0.9% ± 0.2% 600 ± 200 0.5% ± 0.1%
SO3 937 ± 47 710 ± 40 0.14% ± 0.01% 0.11% ± 0.01% 343 ± 27
Cl 0.90% ± 0.04% 0.45% ± 0.02% 0.23% ± 0.01% 0.92% ± 0.04% 0.47% ± 0.02%
K2O 0.44% ± 0.08% 0.6% ± 0.1% 0.32% ± 0.05% 0.28% ± 0.05% 0.28% ± 0.05%
CaO 9.3% ± 0.7% 8.5% ± 0.7% 5.4% ± 0.4% 5.7% ± 0.4% 7.3% ± 0.5%
TiO2 837 ± 67 613 ± 50 0.53% ± 0.04% 880 ± 70 0.27% ± 0.02%
V2O5 3853 ± 97 3487 ± 90 2825 ± 70 2810 ± 80 2323 ± 70
Cr2O3 39 ± 2 4 ± 1 136 ± 6
108
MnO 1.90% ± 0.01% 1.332% ± 0.004% 2.54% ± 0.01% 1.169% ± 0.004% 1.69% ± 0.01%
Fe2O3 0.49% ± 0.08% 0.43% ± 0.07% 1.5% ± 0.2% 0.48% ± 0.08% 1.2% ± 0.2%
CoO 41 ± 4 40 ± 4 98 ± 9 32 ± 3 67 ± 6
NiO
28.3 ± 0.2
CuO 28 ± 1 38 ± 1 81 ± 3 23 ± 1 44 ± 2
ZnO 71 ± 7 51 ± 5 83 ± 8 47 ± 4 56 ± 5
As2O5
Br 28 ± 1 32 ± 1 30 ± 1 37 ± 2 31 ± 2
SrO 582 ± 3 595 ± 3 513 ± 3 506 ± 3 597 ± 3
SnO2 437 ± 13 377 ± 13 218 ± 8 219 ± 7 298 ± 9
Sb2O5 145 ± 30 390 ± 80
BaO 490 ± 60 603 ± 77 0.23% ± 0.03% 730 ± 90 293 ± 40
PbO 513 ± 87 537 ± 83 467 ± 80 450 ± 80 120 ± 23
Sum of analysed elements 87,70% 79,27% 91,30% 84,70% 59,43%
19
Table 4.9: compositions obtained by XRF for fragments from context 15 (µg/g except where % is indicated)
Fragment nr. 12 13 14 15 16
Na2O+MgO 19.83%
20.63%
14.23%
33.03%
18.70%
Al2O3 4.77% ± 0.40% 5.13% ± 0.43% 5.53% ± 0.50% 4.10% ± 0.40% 7.3% ± 0.6%
SiO2 64.00% ± 2.00% 63.00% ± 2.00% 66.67% ± 2.00% 54.00% ± 2.00% 64.3% ± 2.0%
P2O5 800 ± 300 1.07% ± 0.27% 0.70% ± 0.20% 0.70% ± 0.20% 0.26% ± 0.07%
SO3 845 ± 40 1760 ± 85 995 ± 50 337 ± 23 880 ± 50
Cl 0.53% ± 0.03% 0.42% ± 0.02% 0.61% ± 0.03% 0.50% ± 0.02% 0.55% ± 0.03%
K2O 0.52% ± 0.09% 0.57% ± 0.09% 0.67% ± 0.10% 0.39% ± 0.07% 0.46% ± 0.08%
CaO 7.23% ± 0.50% 6.87% ± 0.53% 8.60% ± 0.63% 5.27% ± 0.40% 4.5% ± 0.3%
TiO2 0.10% ± 0.01% 0.11% ± 0.01% 0.14% ± 0.01% 297 ± 23 0.40% ± 0.03%
V2O5 0.46% ± 0.01% 0.25% ± 0.01% 0.35% ± 0.01% 0.23% ± 0.01% 720 ± 20
Cr2O3 14 ± 1 30 ± 2 19 ± 1 120 ± 6
MnO 1.38% ± 0.00% 1.21% ± 0.00% 1.55% ± 0.01% 1.12% ± 0.00% 1.512% ± 0.005%
Fe2O3 0.70% ± 0.10% 0.67% ± 0.10% 0.90% ± 0.17% 0.18% ± 0.03% 1.5% ± 0.2%
CoO 51 ± 5 46 ± 4 68 ± 7 24 ± 3 102 ± 9
NiO 7.2 ± 0.2 6.7 ± 0.2 8.2 ± 0.2 22.2 ± 0.2
CuO 71 ± 3 42 ± 2 107 ± 4 18 ± 1 49 ± 2
ZnO 52 ± 5 47 ± 4 58 ± 5 28 ± 2 60 ± 5
As2O5 9 ± 1 10 ± 1
Br 32 ± 2 26 ± 1 32 ± 2 18 ± 1 29 ± 1
SrO
833 ± 4
490 ± 3
SnO2 353 ± 10 315 ± 10 387 ± 10 258 ± 8 184 ± 6
Sb2O5 327 ± 67 180 ± 40 430 ± 80
BaO 563 ± 67 317 ± 40 550 ± 70 340 ± 43 637 ± 70
PbO 490 ± 83 337 ± 60 397 ± 67 327 ± 57 71 ± 13
Sum of analysed elements 80.17% 79.37% 85.73% 66.97% 81.27%
20
From simple observation of the results presented, several remarks can be made: in what
concerns the K2O and Na2O contents, K2O is generally below 1%, with few exceptions which
probably correspond to more corroded glass fragments, and this is consistently seen by both
techniques, IBA and XRF. On the contrary, although Na2O concentrations obtained by IBA
present variations from 0.37% up to 24.8% (cf. Fig. 2.3; XRF was totally unable to provide any
values for these concentrations) the overall values – obtained by IBA and calculated by
differences in XRF for the joint Na2O+MgO concentrations – scatter equally through large
intervals, namely 2.20-26.1% as seen by IBA vs 1.26-40.6% by XRF.
0 5 10 15 20 25 30
0,0 0,2 0,4 0,6 0,8 1,0 1,2 1,4 1,6 1,8 2,0
[K
2O
]/
wt%
[Na
2O]/ wt%
19-1 19-2 19-3 19-4 19-5 19-6 17-7 17-8 17-9 17-10 17-11 15-12 15-13 15-14 15-15 15-16
Figure 4.3: K2O vs Na2O concentrations determined by IBA techniques for each of the fragments; the
legend indicates the fragments’ order numbers preceded by each respective context.
Furthermore, [CaO] values vary from 3.64% to 14.27% while [MgO] stays below 2%. At this
point – given the relatively low content of MgO which as such has no significant influence in
the overall variation imposed by Na2O – what is surprising is the comparatively much larger
scatter of results that may be inferred from XRF for Na2O. This means that, as expected from
Roman glasses [16], the analysed fragments are soda-lime-silica glasses showing different
extents of surface corrosion, which is responsible for the removal of Na and Ca. Figure 4.3,
together with the low contents of MgO presented in the presented tables, further indicate that
these glasses were produced by resorting to natron as a flux [8].
It is to be noticed from inspection of the tables that all the glass fragments analysed by XRF –
21
– show a consistently high content of Sr (expressed as SrO), between 400 µg/g and 800 µg/g,
across contexts. Even the IBA results (that probe more shallow layers of the glasses) show
consistently high contents of Sr, in the range 130 µg/g to 500 µg/g. Such results clearly indicate
that Sr cannot be used as a distinctive fingerprint that might allow associating particular
fragments with definite contexts in this case. They point, however, to a common source, most
probably of coastal nature, either local or imported, especially if their low MgO content and
noticeable absence of Zr is taken into account. In fact, according to Paynter [17], and also to
Freestone [18], higher Sr concentrations, around 400 µg/g, associated with low contents of Zr
60 µg/g [17] or low MgO contents, below 2% [18], indicate use of Mediterranean coastal
sands to produce the glasses, while lower Sr values, closer to 150 µg/g, and higher
concentrations of Zr, ca. 160 µg/g [17] or MgO contents above 2% [18], would suggest the use
of inland sands.
Although at an earlier stage of results processing it seemed possible that grouping by
similarity of composition would emerge allowing an unambiguous association between samples
and contexts of origin, this proved not to be so. In spite of the apparent scattering of the results,
very much influenced by the strong variation in Na contents most probably due to varying
degrees and extent of glass surface corrosion, the results are fairly homogeneous in that they
do not characteristically associate with any context. This is very interesting as it indicates that
essentially no significant distinction exists – from the point of view of chemical/elemental
composition – between samples from different contexts. As such, the reasonable conclusion
that presents is that the analysed glass fragments are common to the different occupations of
the archaeological site.
Fragment 193/03 from context 19 showed significant concentrations of Sb and Pb,
indicating usage of opacifying agents (mixed oxides as Ca2Sb2O7, Ca2Sb2O6 and Pb2Sb2O7), which
are known to have been used until IV century AD [19], in agreement with the time interval of
the villa’s occupation.
Fragment 92/01-Larger is abnormally rich in K, comparing to other samples, while low in Na
contrarily to 92/01-Smaller from the same context. Therefore these two fragments should not
be considered as belonging to the same original object (as opposed to what was initially
accepted).
Performing beam scanning and elemental distribution mapping with IBA techniques further
helped in identifying the most corroded areas of the samples.
This possibility is demonstrated for glass fragment 195 in Fig. 4.4, showing the elemental
distribution maps of Si, Ca and Mn. Clearly corroded versus clean, non-attacked areas can be
22
Si and Ca in correlation with corresponding regions displaying enhanced Mn contents. This is
also seen by XRF in the spectra of a corroded area versus non-corroded area as seen in Fig. 4.5.
The Mn rich regions in the PIXE maps correlate to a visible dark brown thin layer on the glass
surface, probably corresponding to MnO2, as the result of redeposition of Mn on the glass
surface, after oxidation by atmospheric O2, which in turn is subsequent to the leaching of Mn
from the glass matrix [20].
Figure 4.4: elemental distribution maps of Si, Ca and Mn on glass fragment 195.
Figure 4.5: XRF spectra of fragment 195 – superimposition of data from a corroded and non corroded area.
Contact of glass with water leads to leaching of alkali and alkaline earth ions and their
substitution by hydronium ions in the glass structure. This creates a hydrated layer at the
1 mm
23
surface, causing more leaching and silica dissolution in the presence of water [21]. This
mechanism may explain the low contents of both Na and K found in some of the fragments.
As expected, XRF results generally present higher contents of SiO2, CaO and K2O and lower
concentrations of Mn and Cl in apparent opposition to the IBA results. This can be explained by
the deeper penetration of the X rays beams in the glass, and thus larger volumes of probed
material.
Finally a word about processing and analysing large volumes of data as was the case of the
present work and all works of similar nature.
The presently available XRF spectra processing software, although adequate for processing
individual spectra or small numbers of spectra, is much less fit or adequate to handle a large
number of spectra. In such cases, its use becomes difficult, even cumbersome, without proper
planning and adequate knowledge of the package full possibilities. At present this is not yet an
optimised process at DCR, most probably due to the fact that the necessity has not posed itself
so far. Fully exploring the package’s capabilities became an understandably important aim of
this work, one that has also been successfully achieved. With this purpose in mind, the focus
was first set in understanding the formats used for information storage and retrieval, both
spectral and operational, concerning the data acquisition and analysis software. Inspecting and
understanding these formats lead to realising that all pertinent experimental data is stored in
block structured XML format – an ASCII format that is easily and readily machine readable and
user readable – in the form of SPX files. Secondly, and equally important due to its practical
implications, was the realisation that – since WinAXIL does not provide any means to directly
read or accept the SPX files from the ArTAX acquisition system (or otherwise XML formatted
data) – the best working format to use for conveying spectra and relevant data to WinAXIL is
the SPE format. This is a well-documented block structured ASCII format, sponsored by the
International Atomic Energy Agency (IAEA) and also used with previous versions of the AXIL
code. Contrary to the plain ASCII format TXT commonly used at DCR, SPE formatted files store
and convey relevant data to WinAXIL, in particular system times – live and real (clock) times –
necessary for e.g. dead time calculations, not just the spectral data. Using these SPE format not
only eliminates the need of manually entering the system times for each individual spectrum
but also enables large number batch processing by means of WinAXILBatch: spectral line
deconvolution and background correction can be performed unattended, automatically, for any
number of spectra. Furthermore, automatic data handling also minimizes the chance for error.
In order to make this possible and practical, creation of the SPE data files from the original SPX
24
imposed by this work and the understanding gained about the data formats and usage, an
existing batch format conversion program was implemented to accommodate batch conversion
of SPX (XML) to IAEA/AXIL complying SPE format. In all, the combined use of the format
conversion program and the SPE files with WinAXILBatch, allow a reduction of the overall
processing time to less than 6 minutes per 60 spectra.
After the spectra have been processed – deconvoluted and background corrected – by
WinAXIL or WinAXILBatch, calculations must be performed by WinFund. Here, and very much
unfortunately some shortcomings of the present form of the program prevent practical fully
automatic calculations on a set of spectra. Parameters’ setting is totally inadequate for batch
calculations. However, after an initial painstaking stage of cumbersome, individual spectrum,
parameter setting, automatic calculations can finally be performed on the set. The results have
to be manually copied to a worksheet and then sorted or organised in a useful form. Due to the
peculiar way in which WinFund outputs the results of its calculations, a routine was developed
as an Excel VBA coded macro to automatically sort and organise the WinFund output data,
transforming it in numerical values that can be used for further calculations. As a final remark,
in spite of all enhancements WinFund is still the bottleneck since it only allows “one file loading at a time” including the specification of the oxides that are to associate to each element present in the sample, element by element, one element at a time. This is a very time
consuming task, one that also increases the chance for error enormously.
As a result of the time invested in understanding the software operation, a description of
the procedures to be followed, as well as the file format conversion program and the Excel
macro enabled worksheet for WinFund data transformation will be made available for the
25
5.
Conclusions
Considering the comparison of the two types of techniques used in this study, IBA and XRF,
it is possible to state that, despite the results obtained with each technique for the
archaeological samples showed significant differences between themselves, these differences
are consistent with the physical principles of the techniques and to the conservation state of
the objects. Although apparently obvious, it is nonetheless worth mentioning that these
techniques do not replace each other, except of course in the unlikely case of pristine unaltered
homogeneous objects. Instead they do complement, allowing a more complete and
encompassing characterisation of the objects under analysis. Stated otherwise the techniques
compare well, taking into account their specific probing depths and sensitivity to the state of
the surface region of the artefacts and, as such, both are needed, either individually or in
combination to the greatest advantage of the analyst.
Nevertheless, there is room for improvements and these may be considered. The geometry
and intensity of He flow used in MicroFEx external beam end station should be better defined
in order to systematically guarantee a relatively stable Ar free He atmosphere. This is an
improvement of major importance since setting the proper He atmosphere enables detection
of Na X rays, as recent experiments have shown. And that is by all means a notable achievement,
especially in external, non-vacuum environment.
Also, improvement in beam charge monitoring will make the system less sensitive to beam
intensity fluctuations contributing to better precision and reliability of the quantification of
spectral data.
In what concerns XRF, one major improvement would focus as well on setting a better He
atmosphere, one that may also potentiate Na X rays collection (provided that the detector
window is not too thick to absorb almost entirely those X rays). Another suggestion is to
correctly determine the sample-to-detector real distance and state it to the analysis software,
since attenuation of X rays in air is of importance, particularly for the lighter elements, and can
significantly affect the results (this is less of a problem in a He pure atmosphere).
In line with the general conclusions stated above, the use of nuclear microprobe based PIXE
and PIGE techniques in external analysis, complemented by in air micro-XRF, allowed
characterising Roman glasses from different occupation periods of the same settlement, the
one of Quinta da Bolacha in the centuries IV to II AD, establishing:
– The elemental compositions and conservation state. Although XRF and IBA techniques
produce apparently different sets of results particularly in glasses with significant surface
26
characterised by the low contents of Na and K and the high contents of Mn in clearly
identifiable corroded regions – these are, however, glasses with essentially moderate to high
Na contents, low in K and Mg, consistent with the general soda-lime-silica compositions known
to Roman glasses.
– Natron was used as a source of flux for the production of these glasses.
– Significant levels of Sb and Pb found on one fragment indicate that the opacifying
agents used were those characteristic of historical periods until the IV century AD, confirming
the time interval of the villa’s occupation. No specific elements were found that could be used
as fingerprints for attributing a chronology to the objects from revolved contexts. Instead, no
distinction between the two sealed contexts could be made based on the bulk composition of
the glass fragments collected therefrom, leading to state that most probably manufacture
27
References
[1] A Comparison of the Depth of Analysis of Three Experimental Techniques, SEM-EDS, PIXE
and XRF, http://ion.asu.edu/depth/depth2.htm, 2010.
[2] FERNANDES, P, VILARIGUES, M., ALVES, L. C., SILVA, R. C. da, “Stained glasses from
Monastery of Batalha: Non-destructive characterisation”, Journal of Cultural Heritage, 9,
(2008), 5–9.
[3] LOPES, F., Uranium Glass in Museum Collections– Dissertação de Mestrado, DCR,
FCT-UNL, 2008.
[4] RUIVO, A., GOMES, C., LIMA, A., BOTELHO, M. L., MELO, R., BELCHIOR, A., MATOS, A. P.
de, “Gold nanoparticles in ancient and contemporary ruby glass”, Journal of Cultural
Heritage, 9, (2008), 134–137.
[5] CRUZ, Mário, O Vidro Romano no Noroeste Peninsular, Um olhar a partir de Bracara
Au-gusta, Volume I, O Vidro Romano no Noroeste Peninsular– Tese de Doutoramento,
Insti-tuto de Ciências Sociais, Universidade do Minho, 2009.
[6] DEGRYSE, P., SCHNEIDER, J., “Pliny the Elder and Sr-Nd isotopes: tracing the provenance
of raw materials for Roman glass production”, Journal of Archaeological Science 35 (2008)
1993–2000.
[7] Chemistry of Glass, http://www.cmog.org/dynamic.aspx?id=5664&terms=composition%20roman,
Corning Museum of Glass, 2011.
[8] SHORTLAND, Andrew, SCHACHNER, Lukas, FREESTONE, Ian, TITE, Michael, “Natron as a
flux in the early vitreous materials industry: sources, beginnings and reasons for decline”,
Journal of Archaeological Science 33 (2006) 521–530.
[9] MIRANDA, J. A., ENCARNAÇÃO, G., Villa Romana da Quinta da Bolacha, Campanha de
Abril/Maio de 1997, Relatórios-4, Gabinete de Arqueologia Urbana, Associação de
Arqueologia da Amadora, 1998.
[10] VAN ESPEN, P., NULENS, H., ADAMS, F., Nucl. Instr. And Meth. 145 (1977) 579.
[11] REIS, M. A., ALVES, L.C., “DATTPIXE, A Computer Package for TTPIXE Data Analysis”, Nucl.
Instr. and Meth. B68 1-4, (1992), 300–304.
[12] BRONK H, RÖHRS S, BJEOUMIKHOV A, LANGHOFF N, SCHMALZ J, WEDELL R, GORNY HE,
HEROLD A, WALDSCHLÄGER U. “ArtTAX – a new mobile spectrometer for
energy-dispersive micro X ray fluorescence spectrometry on art and archaeological objects”,
Fresenius J Anal Chem. 2001 Oct 371(3):307–16.
[13] BRILL, Robert H., Chemical Analysis of Early Glass – Table of Analysis, Volume 2, The
Corning Museum of Glass, New York; 1999.
[14] Model S-5005 WinAxil X ray Analysis Software, http://www.canberra.com/be/pdf/Cpbsp2m6-WinAxil.pdf,
[15] WOBRAUSCHEK, P., HALMETSCHLAGER, G., ZAMINI, S., JOKUBONIS, C., TRNKA, G.,
KAR-WOWSKI, M., “Energy-Dispersive X ray Fluorescence Analysis of Celtic Glasses”, X ray
Spectrom. 29, (2000), 25–33.
[16] REHREN, Thilo, “Rationales in Old World Base Glass Compositions”, Journal of Archaeo-
logical Science 27, (2000), 1225–1234.
[17] PAYNTER, S., “Analyses of colourless Roman glass from Binchester, County Durham”,
28
[18] FREESTONE, I. C. “The Provenance of Ancient Glass through CompositionalAnalysis”, Mater. Res. Soc. Symp. Proc. Vol. 852 © 2005.
[19] DAVISON, Sandra, Conservation and Restoration of Glass, Butterworth-Heinemann,
Elsevier Science, Oxford, 2003, ISBN-0-7506-4341-2.
[20] SCHALM, O., PROOST, K., DE VIS, K., CAGNO, S., JANSSENS, K., MEES, F., JACOBS, P., CAEN,
J., “Manganese staining of archaeological glass: The characterization of Mn-rich inclusions
in leached layers and a hypothesis of its formation”, Archaeometry53, 1 (2011) 103–122.
[21] VILARIGUES, M., SILVA, R. C. da, "Characterization of potash-glass corrosion in aqueous solution by Ion Beam and IR Spectroscopy", Journal of Non-crystalline Solids, 352, (2006),