Article
Printed in Brazil - ©2017 Sociedade Brasileira de Química0103 - 5053 $6.00+0.00
*e-mail: [email protected]
An Environmental Friendly Flow-Injection Procedure for On Line Extraction and
Spectrophotometric Determination of Gossypol in Cottonseed Meal
Bianca Daminato, Marcos Y. Kamogawa* and Wanessa R. Melchert
Escola Superior de Agricultura “Luiz de Queiroz”, Universidade de São Paulo, PO Box 9, 13418-970 Piracicaba-SP, Brazil
A fast, simple and inexpensive procedure is described for the determination of gossypol in cottonseed meal. The procedure is based on a flow injection analysis system and a complexation reaction with spectrophotometric detection at 620 nm. A fluidized bed column was used to implement the on line that was coupled to the extraction flow system in order to analyze the solid samples directly. A linear response was observed from 0.96 to 3.85 mmol L-1, and the detection limit, the coefficient of variation and the sampling rate were estimated at 100 µmol L-1 (99.7% confidence level), 1.90% (n = 20) and 30 h-1, respectively. The reagent consumption was 1.08 mg of Fe(NO3)3, with a volume of 20 mL of effluent per determination. Analyses of the results of commercial samples were consistent with through the official procedure of detoxification of cottonseed meal as described by American Oil Chemists’ Society (AOCS) at the 95% confidence level.
Keywords: gossypol, flow analysis, spectrophotometric detection
Introduction
Cottonseed meal is obtained in the oil extraction process. It is high in protein, fiber and minerals and can be used as a fertilizer and animal feed. However, its use is limited by the presence of the polyphenolic
yellow compound known as gossypol.1 Gossypol
(2,2’-bis(8-formyl-1,6,7-trihydroxy-5-isopropyl-3-methylnaphthalene) is a toxic pigment that occurs
in various parts of cotton plants.2 It is undesirable for
different animal species, especially for poultry and swine.3
Several procedures have been described in the literature for the analysis of gossypol, including procedures based
on high performance liquid chromatography (HPLC),4,5
enzyme-linked immunosorbent assay6 and Fourier transform
infrared spectroscopy (FTIR).7 The spectrophotometric
determination of gossypol can be performed using 3-amino-1-propanol and its subsequent complexation with iron(III), forming a green-colored complex with maximum absorption at 620 nm. To extract the analyte from the cottonseeds, 80 mL of hexane-isopropyl alcohol is used
per determination.2 Another procedure is based on
second-derivative ultraviolet spectrophotometry and it involves the extraction of free gossypol using aqueous acetone,
hydrolysis of the soluble-bound forms with hydrochloric acid and the partitioning of the pure compound into chloroform. The proposed method showed good precision (4.0%), but a large amount of organic solvents was used (50 mL acetone and 50 mL chloroform) and a lot of time
was spent (2 h) on each sample.8 These drawbacks hinder
the use of these procedures for routine analysis.
Flow-injection systems (FIA) have been employed especially for the mechanization of analytical procedures in order to minimize the analyst intervention and enhance the number of samples processed by time and improving precision. In the preparation of samples, FIA can be used to minimize risks of sample contamination and amounts of organic solvents, as well as reduce costs of analysis. These systems also show great potential for the development of greener analytical procedures, with the replacement of toxic
reagents,9-11 the minimization of reagent consumption with
multicommutation systems12,13 and standstill reagents,14,15
the reuse of waste generated,16,17 and the treatment of
waste.18-20
A flow procedure based on chemiluminescence1
under a nitrogen stream. Hydrochloric acid (0.01 mol L-1)
was directly added to the residue, and the amount of analyte was then determined.
In this work, a simple spectrophotometric flow system for the extraction of gossypol and the determination of cottonseeds is proposed. The extraction was conducted with a fluidized bed column and diluted on line.
Experimental
Apparatus
The flow system was constructed with a sliding-bar commutator, 0.7 mm i.d. polyethylene tubing and Perspex joint points. An Ismatec peristaltic pump (Ismatec, Wertheim, Germany, model REGLO Digital) equipped with Tygon® tubes was used to propel fluid. Spectrophotometric measurements were carried out with a multichannel CCD spectrophotometer (Ocean Optics, Dunedin, FL, USA; model USB2000) with a tungsten-halogen light source (Ocean Optics, Dunedin, FL, USA; model LS-1). Optical fibers (100 or 600 µm) were employed to transport the radiation. A 1 cm optical path (80 µL internal volume, 0.3 cm i.d.) quartz flow cell (Hellma, Plainview, NY, USA) was also employed. The software furnished by the fabricant of the multichannel spectrophotometer was employed for data acquisition.
The fluidized bed column was made from acrylic and was 5 cm long and 0.4 cm i.d. Cotton was added to the bottom of the column to hold the seed, and a filter support (Millipore Swinnex) containing 0.45 µm cellulose acetate membrane was placed at the top to retain the particulate material. Each sample was milled in Wiley mill with 1 mm screen sieve, homogenized and added (25 mg) in its own column being discarded after use.
The debubbler (Ismatec) consisted of a cylindrical tube with holes on one side where was placed a Teflon tape permeable to gases.
Flow diagram and procedure
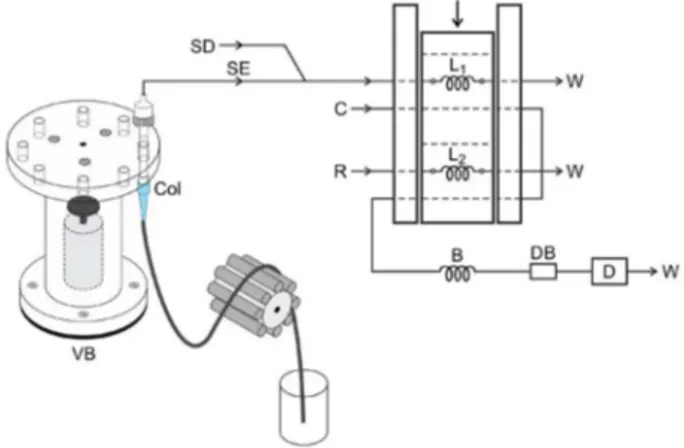
The fluidized bed column and flow manifold are shown in Figure 1. The column was positioned in the sample inset of
the flow diagram, and an extraction solution (1.1 mL min-1)
was inserted into the diluent solution (8.7 mL min-1) at
the Perspex joint point. After extraction and dilution, the solution containing gossypol was inserted into the sample
loop (L1), as shown in the diagram in Figure 1. The extraction
diluent solution and the reagent (R) were then aspirated
simultaneously to fill the loops (L1: 30 cm and L2: 20 cm). In
the alternative injector position, the solutions were inserted
into the carrier stream, and the sample zone was transported through the 100 cm long coil heading to the flow cell, where the spectrophotometric measurements (620 nm) took place. A debubbler was employed between the reactor coil and the flow cell to prevent bubbles from forming in the ethanol solutions.
The fluidized bed column was under constant stirring using a homemade vibratory shaker (DC motor with eccentric axis) for a better interaction between the extraction solution and the cottonseed meal. The spectrophotometer software was employed for data acquisition, and measurements were based on peak height and carried out in triplicate.
For accuracy assessment, the procedure described
by the American Oil Chemist’s Society21 was adopted
as a reference for comparing the results of the analyses. It consists of extracting gossypol with 50 mL acetone,
shaking for 60 min and react with p-anisidine in isopropyl
alcohol. The compound formed had maximum absorption at 447 nm.
Reagents and solutions
All solutions were prepared with analytical-grade chemicals and distilled-deionized water. The reference
solutions were prepared in the range 0.96-3.85 mmol L-1
gossypol (Sigma-Aldrich) by dilution of a 3.85 mmol L-1
stock solution prepared in ethanol (55% v/v). The reagent
was a solution containing 1.8 mmol L-1 Fe(NO
3)3 (dissolving
appropriate amounts of these reagents in ethanol (55% v/v))
and 0.16 mol L-1 hydrochloric acid. An ethanol 55% (v/v)
solution was employed as a carrier, extraction and diluent solution.
Figure 1. Flow analyses system diagram. VB: vibratory shaker; Col: fluidized bed column; SE: extraction solution, 1.1 mL min-1;
SD: diluent solution, 8.7 mL min-1; R: reagent, 1.8 mmol L-1 Fe(NO 3)3
in 0.16 mol L-1 HCl; C: carrier stream, 1.7 mL min-1; B: 100 cm coiled
reactor; L1: sample loop, 150 µL; L2: reagent loop, 100 µL; DB: debubbler;
Results and Discussion
The spectrophotometric determination was based in the generation of the green complex by gossypol (Figure 2) and iron(III) with maximum absorption at 620 nm.
In previous work that used the same complexation
reaction,2 a solution containing 3-amino-1-propanol,
acetic acid and dimethylformamide was used to assist in stabilizing the complex. However, in the proposed procedure, non-significant differences were observed in the analytical signals due to the stability of the complex. Furthermore, the use of this stabilizer solution would cause disturbances resulting in spectrophotometric measurements
of the Schlieren22 effect. In the on line extraction, acetone
was replaced by ethanol 55% (v/v) because it is a more environmentally friendly solvent. To avoid problems with bubbles (Figure 3), a debubbler was inserted between the reactor and the flow cell (Figure 1).
System optimization
The optimizations of the hydrodynamic parameters, loops length (sample and reagent) and reactor coil length were performed using the univariate method in triplicate and considering precision, reagent consumption and the magnitude of the analytical signal. A summary of the ranges studied and the selected values is presented in Table 1.
The loops length 300 µmol L-1 gossypol in ethanol
(55% v/v) and 1.8 mmol L-1 Fe(NO
3)3 in 0.16 mol L-1 HCl
were evaluated individually within a range of 5-100 cm (25-500 µL). As expected, the analytical signal gradually increased with the increasing sample loop length, and the blank signal showed no significant difference. The reagent loop length up to 350 µL did not have a great effect on the analytical signal because the reagent was in excess of the analyte (> 50-fold). Above 350 µL (70 cm), the interpenetration of the sample and reagent zones was low, disfavoring the chemical reaction. However, the best ratio between analytical signal and blank signal was when the 30 and 20 cm (150 and 100 µL) loops were used for the sample and the reagent, respectively.
The effects of the carrier stream flow rates (0.6 and
2.9 mL min-1) and the reactor coil lengths (50 and 150 cm)
were evaluated individually. Higher analytical signals were obtained with smaller reactor lengths and higher flow rates. This is because larger reactor coil lengths and smaller flow rates affect the sample zone residence
time, favoring of the dispersion effect. The 1.7 mL min-1
flow rate and the 100 cm reactor coil length presented an adequate response and good reproducibility, and they were selected for these reasons.
Figure 2. Molecular structure of gossypol.
Figure 3. Transient analytical signals for reference solutions in the range 0.03-0.3 mmol L-1 gossypol (a) without and (b) with debubbler.
Table 1. Ranges studied and optimized conditions for gossypol extraction and determination
Parameter Range
studied
Selected value
Sample loop (L1) / µL 25-500 150
Reagent loop (L2) / µL 25-500 100
Reactor coil (B) / cm 50-150 100
Cottonseed meal mass / mg 25-150 25
Extraction solution flow rate / (mL min-1) 0.6-2.9 1.1
For the extraction of gossypol from the cottonseed meal, a solution of ethanol 55% (v/v) was evaluated; it was already being used in the FIA system as the carrier stream in optimization studies. The experiments were carried out in batch mode, and quantitative extractions (97.0 ± 0.0210% for replicates) were obtained, demonstrating the viability of using ethanol 55% (v/v) as the extraction solution.
In order to decrease the amount of solvent and increase the sampling rate, fluidized bed columns were employed for the gossypol extraction (Figure 1). The extraction was performed in triplicate, and the recovery was estimated at 66.5 ± 0.430%. Thus, to improve the extraction, a vibrating apparatus was employed in the fluidized bed column. The gossypol recovery was estimated at 92.7 ± 0.280% for triplicate, demonstrating the viability of using the fluidized bed column with mechanical vibratory stirring.
The flow rate of the extraction solution (0.6-2.9 mL min-1)
and the cottonseed meal mass (25-125 mg) in the fluidized bed column were optimized in order to improve contact between the two and to avoid preferential pathways. The recovery in the flow rate studies were estimated at 98.3 ± 0.410; 97.8 ± 0.302; 94.1 ± 0.468 and 93.9 ± 0.561%
for 0.6, 1.1, 1.7 and 2.6 mL min-1, respectively. It was
possible that, for smaller flow rates, the recovery was higher due to the higher contact time between the extraction solution and the cottonseed meal, thus favoring gossypol extraction. However, the effect of the cottonseed meal mass on the column did not significantly affect the recovery of
gossypol (values estimated above 98%). Thus, 1.1 mL min-1
and 25 mg were employed for the flow rate of the extraction solution and the cottonseed meal mass, respectively.
According to the literature,23 the average level of total
gossypol present in cottonseed meal is approximately 1.0% (m/m), which was the value adopted for the studies with the addition of 0.25 mg of gossypol in 25 mg of meal
which resulted in a final concentration of 2.41 mmol L-1
gossypol. This concentration would be 10-fold the linear response of the calibration curve. Then, to perform the on line extraction a confluence point in the FIA system was inserted with a diluent solution of ethanol (55% v/v) at a
flow rate of 8.7 mL min-1. After extraction and dilution, the
solution containing the gossypol was inserted into the L1
loop (Figure 1) with a flow rate of 9.8 mL min-1.
Analytical features and application
A linear response was observed from 0.96 to
3.85 mmol L-1 gossypol, as described by the equation
A = 0.0599 + 0.202C; (r = 0.994), in which A is the
absorbance and C the gossypol concentration in mmol L-1.
The analytical features of the proposed procedure with
on line extraction in a fluidized bed were evaluated, and summary values are shown in Table 2. The detection limit (99.7% confidence level), the coefficient of variation
(n = 20; 2.41 mmol L-1), and the sampling rate (obtained
from the time interval required for 20 measurements) were
estimated at 100 µmol L-1, 1.90% and 30 determinations h-1,
respectively. Reagent consumption per determination was
estimated at 1.08 mg of Fe(NO3)3, generating 20 mL of
waste.
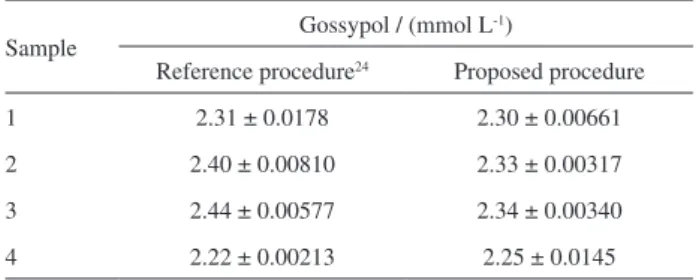
Four cottonseed meal samples were spiked with 1.0% (m/m) gossypol and then analyzed using the optimal operational conditions selected for the proposed procedure. The accuracy of the measurements (Table 3) was assessed by comparing the results using a reference method based
on the spectrophotometric method with p-anisidine and
isopropyl alcohol (80% v/v) after extraction with acetone.23
The results agreed with those obtained by the reference procedure at the 95% confidence level.
The analytical features of the proposed procedure were better than those obtained by other procedures for gossypol extraction and determination using cottonseed meal (Table 4). The coefficient of variation was 2-fold lower than that observed in spectrophotometric determination
with second-derivative8 and slightly higher than the
observed in the HPLC5 and spectrophotometric detection
with complexing.2 However, the gossypol extraction in
the proposed procedure was carried out on line, which
Table 2. Analytical features for gossypol extraction and determination
Analytical feature Value
Linear response / (mmol L-1) 0.960-3.85
Detection limit / (mmol L-1) 0.107
Coefficient of variation (n = 20) / % 1.90
Sampling rate / (determinations h-1) 30.0
Reagent consumption / (mg per determination) 1.00
Effluent generation / (mL per determination) 20.0
Table 3. Main values and uncertainties for gossypol determination in spiked cottonseed meal (2.45 mmol L-1)
Sample
Gossypol / (mmol L-1)
Reference procedure24 Proposed procedure
1 2.31 ± 0.0178 2.30 ± 0.00661
2 2.40 ± 0.00810 2.33 ± 0.00317
3 2.44 ± 0.00577 2.34 ± 0.00340
did not occur in any other procedures. The sampling rate was better than all of the procedures listed in Table 4. The more significant increase was in comparison to the batch that used spectrophotometric determination with
aniline,24 in which a sampling rate that was 60-fold higher
was observed. For the HPLC with UV detection4 and
spectrophotometric determination with complexing,2 the
sampling rate was, respectively, 20 and 2.5 times higher for the proposed procedure. The reagent consumption decreased considerably in comparison with the other evaluated procedures. Furthermore, the use of highly toxic solvents such as hexane, acetone, dimethylformamide and chloroform was avoided. Thus, the proposed procedure was inherently greener than those previously reported and can therefore have a highly beneficial effect through the reduction of both cost and waste.
Conclusions
The proposed procedure is a simple, fast, green and inexpensive solution for the detoxification and determination of gossypol in cottonseed meal. The analytical features of the proposed system with spectrophotometric detection and flow-injection analysis with on line extraction and fluidized bed columns were superior to those obtained by other procedures. It is a viable alternative that increases the sampling rate, and it can also be considered a greener procedure when compared to other procedures reported in the literature, reducing the amount of reagents employed and, therefore, the amount of waste generated. The on line extraction and dilution of gossypol can be implemented by the FIA, aiming to process the cottonseed meal directly.
Acknowledgments
The authors acknowledge fellowships and financial support from the Brazilian agencies Fundação de Amparo à Pesquisa do Estado de São Paulo (FAPESP, Process No. 2011/14071-1 and 2011/23498-9).
References
1. Bingchun, X.; Tao, W.; Erbao, L.; J. Anal. Chem. 2008, 63, 1078.
2. Admasu, A.; Chandravanshi, B. S.; Anal. Chem. 1984, 56, 30. 3. Abou-Donia, M. B.; Residue Rev. 1976, 16, 125.
4. Hron, R. J.; Kuk, M. S.; Abraham, G.; J. Am. Oil Chem. Soc. 1990, 67, 182.
5. Wang, M. Z.; J. Ethnopharmacol. 1987, 20, 1.
6. Wang, J.; Wang, X.; Chen, F.; Wan, P. J.; He, G.; Li, Z.; J. Agric. Food Chem. 2005, 53, 5513.
7. Mirghani, M. E. S.; Che Man, Y. B.; J. Am. Oil Chem. Soc. 2003, 80, 625.
8. Botsoglou, N. A.; J. Agric. Food Chem. 1991, 39, 478. 9. Krug, F. J.; Ruzicka, J.; Hansen, E. H.; Analyst 1979, 104, 47. 10. Krug, F. J.; Reis, B. F.; Giné, M. F.; Zagatto, E. A. G.; Anal.
Chim. Acta 1983, 151, 39.
11. Nóbrega, J. A.; Mozeto, A. A.; Alberici, R. M.; Guimarães, J. L.; J. Braz. Chem. Soc. 1995, 6, 327.
12. Rocha, F. R. P.; Reis, B. F.; Zagatto, E. A. G.; Lima, J. L. F. C.; Lapa, R. A. S.; Santos, J. L. M.; Anal. Chim. Acta 2002, 468, 119. 13. Reis, B. F.; Morales-Rubio, A.; de la Guardia, M.; Anal. Chim.
Acta 1999, 392, 265.
14. Zamora, L. L.; Calatayud, J. M.; Talanta 1993, 40, 1067. 15. Teixeira, L. S. G.; Rocha, F. R. P.; Korn, M.; Reis, B. F.; Ferreira,
S. L. C.; Costa, A. C. S.; Anal. Chim. Acta 1999, 383, 309. Table 4. Analytical features of some spectrophotometric procedures for gossypol determination in cottonseed meal
Procedure Linear response / (mmol L-1)
Coefficient of variation / %
Sampling rate /
(determinations h-1) Solvent extraction Solvent determination Reference
Spectrophotometric with iron(III) and complexant
7.71 × 10⁻³-1.54 × 10⁻¹ 0.70 12 hexane
isopropyl alcohol
hexane
isopropyl alcohol 2
HPLC-UV 1.92 × 10⁻³-1.92
× 10-1
− 1.5 glacial acetic acid
dimethylformamide
methanol:water in
0.1% phosphoric acid 4
HPLC-UV − 1.10 6.0
acetone chloroform acetic acid
methanol
chloroform 5
Spectrophotometric with second-derivative
1.34 × 10⁻³-7.71 × 10⁻³ 4.00 2.7
acetone chloroform hydrochloric acid
ethanol diethyl ether
acetic acid
8
Spectrophotometric
with aniline 1.54 × 10⁻³-1.54 × 10⁻² − 0.5 hexane hexane 24
16. Sánchez-Dasi, M. J.; Garrigues, S.; Cervera, M. L.; de la Guardia, M.; Anal. Chim. Acta 1998, 361, 253.
17. Bouhsain, Z.; Garrigues, S.; de la Guardia, M.; Analyst 1997, 122, 441.
18. de la Guardia, M.; Khalaf, K. D.; Carbonell, V.; Morales-Rubio, A.; Anal. Chim. Acta 1995, 308, 462.
19. Peris-Cardells, E.; Terol, J.; Mauri, A.; de la Guardia, M.; Pramauro, E.; J. Environ. Sci. Health B 1993, 28, 431. 20. de la Guardia, M.; Khalaf, K. D.; Hansan, B. A.; Morales-Rubio,
A.; Carbonell, V.; Analyst 1995, 120, 231.
21. AOCS; Official Method Ba 8-58 in Official and Tentative Methods of Analysis, 3rd ed.; American Oil Chemists’ Society: Chicago, IL, 1985b.
22. Zagatto, E. A. G.; Arruda, M. A. Z.; Jacintho, A. O.; Mattos, I. L.; Anal. Chim. Acta 1990, 234, 153.
23. http://cottonseed.org/publications/Calhoun%20Nutrition%20 Values.pdf, accessed in November 2016.
24. Smith, F. H.; Ind. Eng. Chem., Anal. Ed. 1946, 18, 41.
Submitted: February 1, 2017