July 2014
Frederico Brízido Caldas de Oliveira
Thermo-Hydro-Mechanical analysis of
CO
2
injection into deep aquifers
Dissertation to obtain the degree of Master in Civil Engineering
Supervisor: Professor Dr. Lyesse Laloui, École
Polytechnique Fédérale de Lausanne
Co-Supervisor: Professor Dr. Armando Antão, Universidade
Nova de Lisboa
Frederico Brízido Caldas de Oliveira
Thermo-Hydro-Mechanical analysis of
CO
2
injection into deep aquifers
Supervisor: Professor Dr. Lyesse Laloui, École
Polytechnique Fédérale de Lausanne
Co-Supervisor: Professor Dr. Armando Antão, Universidade
Nova de Lisboa
Thermo-Hydro-Mechanical analysis of CO
2
injection into deep aquifers
“Copyright” Frederico Brízido Caldas de Oliveira, of FCT/UNL and of UNL.
A
CKNOWLEDGEMENTS
First, I would like to express my deepest gratitude to my supervisor Professor Lyesse Laloui for giving me the opportunity to work in his group. Furthermore, I would like to express my sincere gratitude to Li Chao for his supervision and guidance during my period at LMS-EPFL. It has been a privilege and a pleasure to work under their guidance.
I would like to express my gratitude to all my colleagues at LMS-EPFL more in particular to, Alice, Alessandro, Athanasia, Francesco, Nicolas and Timur for helping me during my stay and for all their advices.
I would also like to express my utmost gratitude to all my family, especially to my brother, father and mother, who always supported me during my life and for making this challenge possible. I would also like to express my greatest gratitude to my co-supervisor, Prof. Armando Antão that despite being distant from the development of this study has always showed his support. I also would like to thanks for his guidance and advices during my academic journey. In addition, I greatly appreciate my Professor Nuno Guerra, who helped me during the whole process of developing my master dissertation abroad and for transmitting his wisdom during my academic journey. I take this opportunity, to demonstrate my acknowledgement to all my Professors from the Civil Engineering department of the Faculdade de Ciências e Tecnologias of Universidade Nova de Lisboa, for facilitating this entire apprenticeship and for helping me to improve as a person and as a professional.
i
A
BSTRACT
One of the biggest challenges for humanity is global warming and consequently, climate changes. Even though there has been increasing public awareness and investments from numerous countries concerning renewable energies, fossil fuels are and will continue to be in the near future, the main source of energy. Carbon capture and storage (CCS) is believed to be a serious measure to mitigate CO2 concentration. CCS briefly consists of capturing CO2 from the atmosphere or stationary emission
sources and transporting and storing it via mineral carbonation, in oceans or geological media. The latter is referred to as carbon capture and geological storage (CCGS) and is considered to be the most promising of all solutions. Generally it consists of a storage (e.g. depleted oil reservoirs and deep saline aquifers) and sealing (commonly termed caprock in the oil industry) formations. The present study concerns the injection of CO2 into deep aquifers and regardless injection conditions, temperature
gradients between carbon dioxide and the storage formation are likely to occur. Should the CO2
temperature be lower than the storage formation, a contractive behaviour of the reservoir and caprock is expected. The latter can result in the opening of new paths or re-opening of fractures, favouring leakage and compromising the CCGS project. During CO2 injection, coupled thermo-hydro-mechanical
phenomena occur, which due to their complexity, hamper the assessment of each relative influence. For this purpose, several analyses were carried out in order to evaluate their influences but focusing on the thermal contractive behaviour. It was finally concluded that depending on mechanical and thermal properties of the pair aquifer-seal, the sealing caprock can undergo significant decreases in effective stress.
iii
R
ESUMO
Um dos maiores desafios para a humanidade é o aquecimento global e consequentemente as mudanças climáticas. Apesar da preocupação pública e dos investimentos por parte de inúmeros países terem vindo a aumentar, relativamente a energias renováveis, os combustíveis fósseis são e continuarão a ser, num futuro próximo, a principal fonte de energia. Acredita-se que a captação e armazenamento de CO2 (CAC) seja uma séria medida para mitigar a concentração de CO2.
Resumidamente, o CAC, consiste na captação de CO2 da atmosfera ou de fontes emissoras
estacionárias, transporte e armazenamento via carbonatação mineral, em oceanos ou em formações geológicas. Este último é referido como captação e armazenamento geológico de carbono (CAGC) e é considerado a solução mais promissora. Em geral, consiste numa formação de armazenamento (e.g. reservatórios de petróleo já explorados e aquíferos salinos profundos) e uma formação de selagem (frequentemente denominada de caprock na indústria do petróleo). O estudo em questão diz respeito à injecção de CO2 em aquíferos profundos e independentemente das condições em que o CO2 é
injectado, diferenças de temperatura entre o dióxido de carbono e a formação de armazenamento podem facilmente ocorrer. No caso em que a temperatura de injecção é menor que a da formação de armazenamento, um comportamento contráctivo é esperado. Isto pode resultar na abertura de novas passagens ou re-abertura de fracturas, comprometendo o projecto de CAGC. Durante a injecção de CO2, fenómenos interligados térmo-hidro-mecânicos ocorrem, os quais devido à sua complexidade
dificultam a sua avaliação. Para este fim, várias análises foram realizadas de modo a avaliar as suas influências mas tendo como principal foco o comportamento contráctil térmico. Finalmente concluiu-se que a dependendo das propriedades mecânicas e térmicas do par aquífero-selagem, a rocha de selagem pode sofrer decréscimos significativos de tensão efectiva.
Palavras-chave: CAC, armazenamento de CO2, analise não isotérmica, aquíferos profundos, CO2
v
T
ABLE OF
C
ONTENTS
1. Introduction ... 1
1.1. General Context ... 1
1.2. Objectives ... 2
1.3. Outline of the work ... 2
2. General Concepts of Carbon Dioxide Capture and Storage (CCS) ... 5
2.1. Role of CCS ... 5
2.2. Process of Carbon Dioxide Capture and Storage ... 5
2.2.1. Capture ... 6
2.2.2. Transport ... 6
2.2.3. Storage ... 6
2.3. Current Status and Alternative Approaches ... 9
2.4. CCGS Trapping Mechanisms and Suitable Geological Media ... 10
2.5. Risks and Monitoring ... 13
2.6. Challenges and Barriers for Deployment of CCGS ... 14
3. CO2 Storage in Deep Aquifers ... 17
3.1. Coupled Thermo-Hydro-Mechanical Behaviour ... 17
3.2. Unsaturated Geomaterial ... 18
3.3. Theoretical Framework and Field Equations ... 21
3.3.1. Mass Conservation Equations ... 22
3.3.1.1. Solid ... 22
3.3.1.2. Water Species ... 23
3.3.1.3. CO2 Species ... 23
3.3.2. Momentum Conservation ... 26
3.3.3. Energy Conservation Equation ... 26
3.3.4. Constitutive Equations ... 27
3.3.4.1. CO2 Properties ... 27
3.3.4.2. Hydraulic Properties ... 30
vi
4. Model Characteristics ... 33
4.1. Geometry and Boundary Conditions ... 33
4.2. Material Characteristics ... 34
4.3. Simulation Characteristics ... 36
5. Simulation Results ... 37
5.1. Hydraulic Analysis: Influence of the Retention Parameters ... 40
5.2. Hydro-Mechanical Analysis ... 41
5.3. Thermo-Hydraulic Analysis ... 44
5.3.1. Influence of the Thermal Conductivity Formulation ... 44
5.3.2. Influence of the Convective Term ... 45
5.3.3. Influence of the Injection Temperature ... 46
5.4. Thermo-Hydro-Mechanical Analysis ... 49
6. Conclusions and Future Developments ... 59
6.1. Conclusions ... 59
6.2. Future Developments ... 60
References ... 63
Appendix A ... 67
vii
L
IST OF
T
ABLES
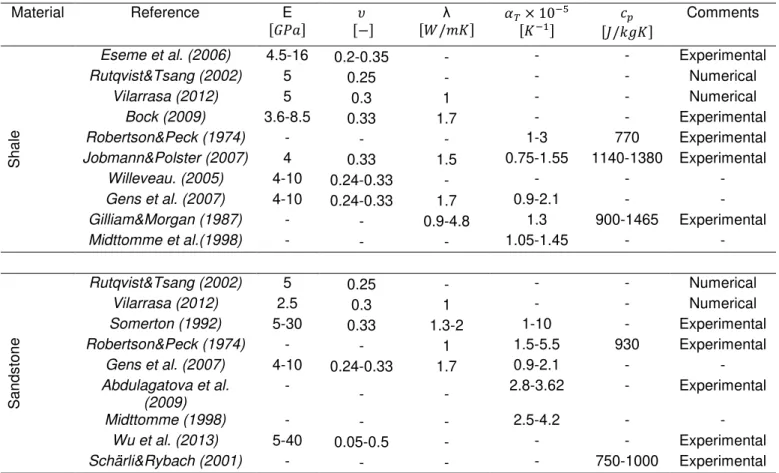
Table 4.1 - Range of mechanical and thermal parameters of sandstone and shale from a literature review
... 34
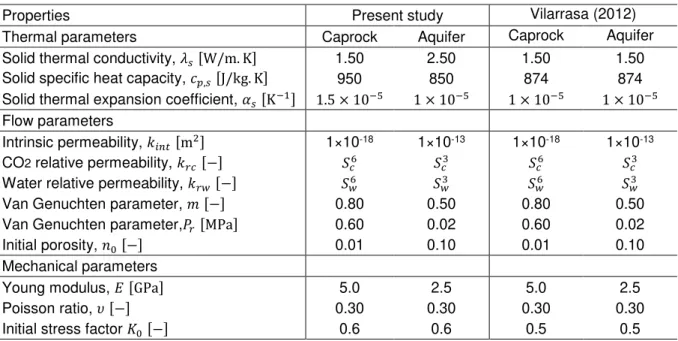
Table 4.2 - Material properties of the simulation ... 35
Table 4.3 – Characteristics of the reference model simulation ... 36
Table 5.1 - Simulation Characteristics and objectives……….38
Table 5.2 - Properties of the Vilarrasa (2012) and the present study model ………39
Table 5.3 - Decrease in horizontal effective stress due to temperature and fluid pressure ………56
ix
L
IST OF
F
IGURES
Figure 2.1 - Carbon dioxide capture and storage system (CO2CRC, 2014) ... 7
Figure 2.2 – Sleipner Project (Statoil, 2014) ... 10
Figure 2.3 - Time frame of the primary and secondary trapping mechanisms acting in depleted oil reservoir or deep aquifers (CO2CRC, 2014) ... 11
Figure 3.1 – CO2 saturation profile (Zhang, 2014) ... 17
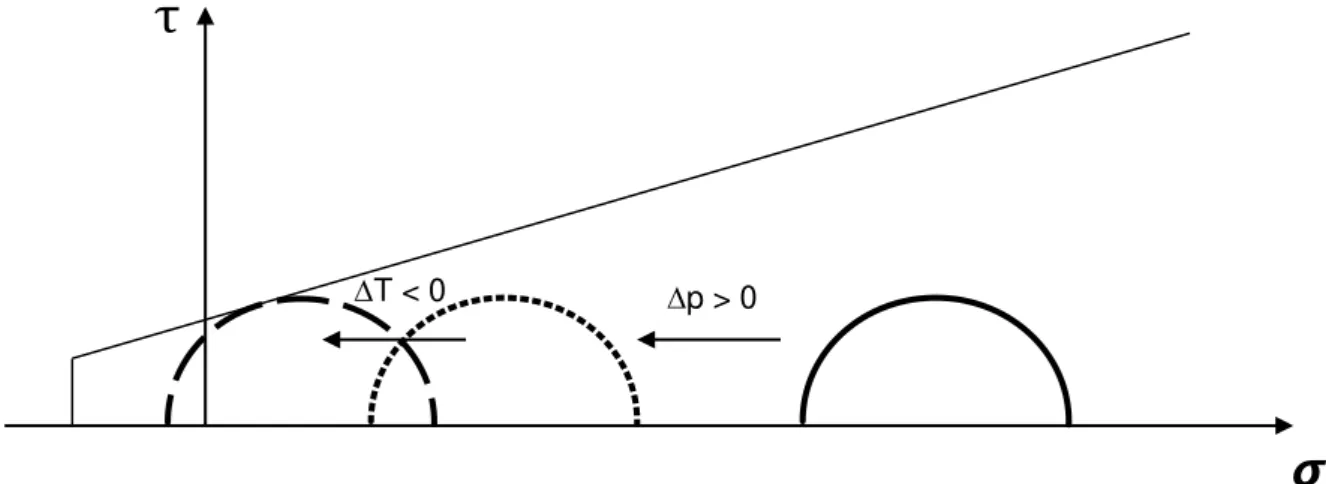
Figure 3.2 – Mohr-Coulomb circles stress path during CO2 injection ... 18
Figure 3.3 – Geomaterial matrix concept (adapted from Eichenberger, 2013) ... 19
Figure 3.4 – (a) Equilibrium of water molecules; (b) Capillary meniscus (adapted from Laloui, 2010). 19 Figure 3.5 – Water retention curve (adapted from Eichenberger, 2013) ... 20
Figure 3.6 - Phases and species of the system (Li, 2013) ... 21
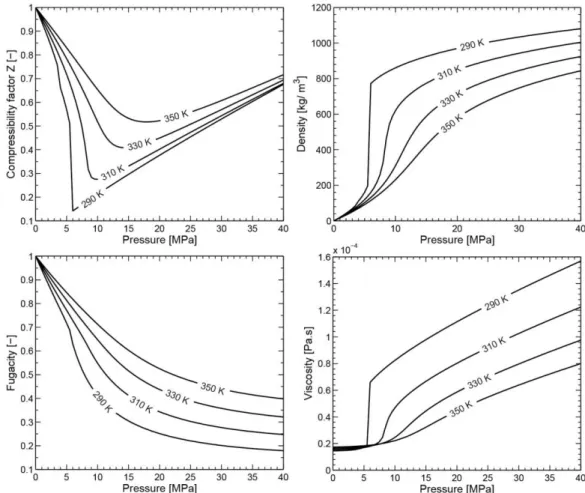
Figure 3.7 - Calculated compressibility factor Z, density, fugacity and viscosity (Li, 2013) ... 28
Figure 3.8 - The Joule-Thomson experiment ... 29
Figure 3.9 - Joule Thomson effect for a temperature reference of 300K (NIST web chemistry book) . 30 Figure 4.1 - Geometry and boundary conditions ... 33
Figure 4.2 - Evolution of the water and CO2 relative permeabilities for the aquifer and caprock ... 35
Figure 4.3 - Injection rate evolution ... 36
Figure 5.1 - Influence of the retention parameters: a)”m” and b)”Pr” on the water retention behaviour 40 Figure 5.2 - Stability line defining the values of “m” and “Pr” for which good convergence is achieved. a) 0.3 Mt per year and b) 1 Mt per year ... 40
Figure 5.3 - a) Fluid pressure evolution for an element 10 meters away from the injection well and at the top of the aquifer; b) time evolution of the mean and deviatoric stresses at the same element with respect to fluid pressure ... 42
Figure 5.4 - Stress pass in a q-p’ plane for an element 10 meters away from the injection well at the top of the aquifer ... 42
Figure 5.5 - Horizontal profile at the top of the aquifer comparing fluid pressure (a) and water saturation (b) for four different time steps ... 43
Figure 5.6 - Vertical displacement evolution with the distance from the injection well for an element at the top of the aquifer and for different time steps ... 43
Figure 5.7 - a) Temperature evolution with respect to the distance to the injection well; b) Fluid pressure evolution with time for an element at the top of the aquifer ... 44
Figure 5.8 - Temperature profile considering a) convection and conduction and b) conduction ... 45
Figure 5.9 - Fluid pressure evolution for an element at the top of the aquifer and close to the injection well ... 45
Figure 5.10 - CO2 state for case A (liquid) and B (supercritical) (modified from Bachu, 2008) ... 46
Figure 5.11 - Fluid pressure evolution with time for liquid and supercritical conditions for an element at the top of the aquifer and close to the injection well ... 46
x
Figure 5.13 - CO2 plume after 1 year of injection for a) Liquid and b) Supercritical conditions ... 47 Figure 5.14 - Gravity number evolution along the top of the aquifer length for supercritical and liquid injections ... 48 Figure 5.15 - Temperature profiles for four different permeabilities after 180 days of injection ... 48 Figure 5.16 - Horizontal displacements for a vertical profile 10 meters away from the injection well for three different time steps ... 49 Figure 5.17 - Vertical displacements for three different elements along the length of the aquifer after 180 days of injection ... 50 Figure 5.18 - a) Vertical displacements and b) Temperature profiles along the length of the aquifer at the upper caprock, top and middle aquifer after 180 days of injection ... 50 Figure 5.19 - Vertical (a), horizontal effective stress (b), fluid pressure (c) and temperature (d) time evolution for an element 10 meters away from the injection well and at the top of the aquifer ... 51 Figure 5.20 - Stress pass in a q-p’ plane for an element 10 meters away from the injection well at the top of the aquifer for liquid and supercritical injection ... 52 Figure 5.21 - Mean and deviatoric effective stress evolution with respect to fluid pressure ... 52 Figure 5.22 - Vertical profiles 10 meters away from the injection well: a) horizontal effective stress and b) vertical effective stress ... 53 Figure 5.23 - Schematic comparison between the vertical profiles of the horizontal effective stress of
xi
L
IST OF
A
BBREVIATIONS
,
A
CRONYMS AND
S
YMBOLS
Abbreviations
d – days
CO2 –carbon dioxide
CCGS – carbon dioxide capture and geological storage CCS – carbon dioxide capture and storage
ECBM – enhancing coal bed methane EOS – equation of state
EOR – enhancing oil recovery Gt – gigaton
H – hydraulic
HM – hydro-mechanical IR – injection rate Mt – megaton
REV – representative elementary volume SC – supercritical
TH – thermo-hydraulic
THM – thermo-hydro-mechanical WRC – water retention curve
Acronyms
FEM - finite element method
Symbols
Roman letters
𝑏 Biot’s coefficient
𝑐 specific heat capacity
𝑐′ coesion
CKC1 material parameters CKW1 material parameters 𝐷𝑐 diffusion coefficient
E Young modulus
𝐻 enthalpy
𝐼 identity matrix
xii 𝐾𝑖𝑛𝑡 intrinsic permeability
𝑘𝑟𝑐 carbon dioxide relative permeability 𝑘𝑟𝑤 water relative permeability
𝐾𝑠 bulk modulus of solid material 𝐾𝑜 inicial stress factor
m Van Genuchten parameter
𝑀 molar mass
𝑀 slope of the critical state line
𝑛 porosity
𝑝𝑐 carbon dioxide pressure
pf fluid pressure
𝑃𝑟 Van Genuchten parameter
𝑝𝑤 water pressure
𝑝′ confinement pressure
𝑞 deviatoric stress
𝑅 gas constant
𝑠 suction
𝑠𝐸 air entry value
𝑆 saturation
𝑆𝑟𝑒𝑠 residual saturation 𝑆𝑤 water phase saturation
𝑇 temperature
𝑉 volume
𝑉𝑣 volume of voids
𝑉𝑤 volume of water
Xdc mass fraction of dissolved carbon dioxide in water
𝑍 compressability parameter
Greek letters
𝛼𝑡 linear thermal expansion coefficient
𝛽𝑠 volumetric thermal expansion coefficient for solid material 𝛽𝑤 volumetric thermal expansion coefficient for water
𝛿 Kronecker delta
ε strain
𝜃𝑐𝑡 critical angle 𝜆𝛼 thermal conductivity
μ solid displacement
xiii
μw water viscosity
𝜌 density
𝜎 total stress
𝜎′ effective stress
𝜏 tortuosity
ν poisson coefficient
𝛷 fugacity coefficient
Subscript
𝑐 dry carbon dioxide
𝑑𝑐 dissolved carbon dioxide
𝑠 solid
𝑤 water
1
1.
I
NTRODUCTION
1.1.
GENERAL CONTEXT
One of the biggest challenges for Humanity is global warming and, consequently the climate changes. Even though there has been increasing public awareness and investments from numerous countries concerning renewable energies, fossil fuels are and will continue to be in the near future the main source of energy due to their low cost, abundance and global distribution. However, energy from fossil fuels has its downsides due to the emission of greenhouse gases, of which carbon dioxide is included. Even though a direct relationship, has not yet been established, the Intergovernmental Panel on Climate Change (IPCC) states that the scientific community strongly believes that greenhouse gases contribute towards global warming (IPCC, 2007). Hence, the challenge is to lower CO2 emissions or CO2
atmosphere concentrations. However, in order to keep up with population growth and its living standards, lowering CO2 emissions is not, as yet, a sustainable solution (Bachu, 2008).
Thus, a world convention was created, whose main objective is to establish plans and measures to mitigate CO2 atmosphere concentrations, of which carbon capture and storage is included. Carbon
capture and storage (CCS) is believed to be a serious measure and briefly consists of capturing CO2
either directly from the atmosphere or from stationary sources (e.g. power plants, cement factory) and transporting and storing it via mineral carbonation, in oceans or in geological media. The latter, is referred to as carbon capture and geological storage (CCGS) and is considered to be the most promising of all solutions. It consists of injecting CO2 into a storage formation (e.g. depleted oil and gas reservoirs
and deep aquifers), being that confined by a sealing formation (commonly termed as “caprock” in the oil industry). However, despite the potential, this technology has not yet gained public acceptance, which was the motivation for carrying out the present study.
The major risk of a CCGS project is the possibility of leakage due to its potential consequences. Thus, the success of a CCGS project is directly related to the sealing efficiency, i.e. the caprock integrity. The present study addresses the injection of CO2 into deep aquifers, focusing mainly on the mechanical behaviour of the caprock during the injection operation. The conditions in which CO2 is injected depend
2
Due to the high computational cost and the high coupled thermo-hydro-mechanical behaviour, the assessment of each influence is complex. For this purpose, a staged approach was adopted, firstly carrying out hydraulic analyses, followed by hydro-mechanical, thermo-hydro and finally thermo-hydro-mechanical analyses. The thermo-hydro-thermo-hydro-mechanical analysis is encompassed within a framework that takes into account the following processes: multiphase fluid flow occurring under pressure and temperature; interaction between fluids, which addresses the relative permeability evolution of water and CO2 and the exchange terms due to CO2 dissolution and degassing phenomena; heat flow through
convection and conduction; stress-strain relationship; effective stress changes due to fluid pressure and temperature; fluid flows governed by advective and non-advective (diffusion) flows.
1.2.
OBJECTIVES
The general objective of this study is to analyse the thermo-hydro-mechanical behaviour of the storage and especially the sealing formation during the injection operation. Should CO2 be injected with a lower
temperature than the storage and sealing formations, a contractive behaviour is expected which affects the mechanical regime. Thus, the main objective of the present study is to assess the influence of temperature on the mechanical behaviour of the aquifer and especially of the caprock.
1.3.
OUTLINE OF THE WORK
Chapter 2 introduces the concept of CCS technology addressing its role, stages of the system and its current status. Of the various CCS technology solution, carbon capture and geological storage (CCGS) is described in more detail, addressing aspects such as: trapping mechanisms, suitable geological media, risks and monitoring.
Since deep aquifers are the geological media considered for this study, chapter 3 describes the general coupled thermo-hydro-mechanical behaviour occurring during CO2 injection and some general knowledge of unsaturated geomaterials. Furthermore, the theoretical framework is presented, addressing the governing equations, i.e. mass balance conservation, momentum conservation, energy conservation and constitutive equations are presented.
Chapter 4 describes the characteristics of the FEM model: geometry, boundary conditions, material properties and simulation characteristics. These are the characteristics of what is considered to be the reference model from which several simulations are carried out in Chapter 5.
3
liquid (non-isothermal) CO2 injection. In addition, a comparison between the present study and Vilarrasa
(2012) is addressed.
5
2.
G
ENERAL
C
ONCEPTS OF
C
ARBON
D
IOXIDE
C
APTURE AND
S
TORAGE
(CCS)
2.1.
ROLE OF CCS
When analysing the temperature over the last centuries, an increase in the average temperature becomes evident and predictions show a tendency for this to continue (IPCC, 2001c). Although a direct relationship has not yet been established, it is generally accepted that this temperature increase is due to the increase in concentrations of greenhouse gases in the atmosphere (IPCC, 2007 and American Geophysical Union, AGU, 2003). Thus, in order to mitigate climate changes, an important challenge is to reduce the greenhouse gases concentrations, of which CO2 is included. Currently, this is one of humanity’s biggest concerns, which has led to the creation of an international convention whose primary objective is to establish plans and measures for the stabilization of greenhouse gases concentrations (United Nations Framework Convention on Climate Change-UNFCCC). This prompted a portfolio being drawn up, comprising measures and actions to reduce CO2 emissions, among which, carbon dioxide
capture and storage. Alternative measures refer to the use of energies with lower gas emission, nuclear power, renewable energies, reducing the demand for energy by increasing efficiency during energy conversion, reducing greenhouse gases other than CO2. In addition, this convention suggests that fossil
fuels will still remain the main source of energy until the middle of the next century. Bachu (2008), also states that due to industry’s major dependence on non-renewable energy and in order to maintain the population’s quality of life, and also due to its low cost, versatility, easy storage and global distribution is not foreseen that the energy from the burning of fossil fuels will be replaced in the near future. A CCS system briefly consists of the separation and capture of carbon dioxide at a large stationary source, transporting and storing it and isolating the CO2 from the atmosphere for long periods of time.
2.2.
PROCESS OF CARBON DIOXIDE CAPTURE AND STORAGE
The process of a CCS system starts at the stationary emission sources of CO2. The IPCC (2005) report
mentions three main sources:
Burning of fossil fuels: responsible for the highest percentage, this process results from the oxidation of carbon and is related to power plants, oil refineries, etc;
Industrial processes: commercial production of metals from ores and the cement industry;
6
Once the emission sources have been identified, the three main stages comprising a CCS project (Figure 2.1), can be carried out: Capture, Transport and Storage.
2.2.1.
C
APTUREThe capture phase represents a substantial portion of the investment needed for the implementation of a CCS technology and it is technically possible and economically viable for large-scale stationary sources of with high degrees of purity of CO2. Generally, the capture systems can be divided into three
categories: capture of exhaust gas (Post-Combustion), before combustion (Pre-Combustion and combustion with a high oxygen content (Oxyfuel Combustion). The application of each type of capture depends on the emission source. For more detailed information regarding the capture processes the reader should refer to IPCC (2005). Nowadays, it is possible to capture approximately 85 to 95% of the CO2 produced. However, the implementation of a capture technology requires approximately 10 to 40%
more energy than an equivalent plant without capture. Hence, the net amount of CO2 captured is
approximately 80 to 90%. With regard to the costs, a capture system implies an increase in electricity of about 20 to 85%, depending on the type of plant. Nevertheless, it is expected that with proper research and development and commercial deployment, the costs could be reduced by about 20 to 30% (IPCC, 2005).
2.2.2.
T
RANSPORTExcept in cases where the emission sources are located directly above the storage place, the captured CO2 has to be transported. Of all stages that comprise a CCS system, this is the one that causes less
complications on a technical level, as it has already been developed and deployed by the oil industry. The only concern to bear in mind is due to the fact that the state of CO2 varies with temperature and
pressure, which therefore requires monitoring during the transportation route in order to assure CO2
transport conditions. Currently, there are two efficient methods for carrying out the transport stage. The most common is through pipelines where typically CO2 is compressed and transported in liquid phase
(higher density), as it is easier and less costly to perform the transportation. If transport overseas is necessary, transport can be carried out by ships, in which CO2 is also transported in liquid state. However, the latter does not permit a continuous flow of CO2 from the source to the storage site,
meaning that an intermediate storage facility is required.
Regardless of the method of transport, the costs are directly related to the distance and to the quantity of CO2. In the particular case of pipelines, costs are associated with location (Offshore, Onshore), type
of area (inhabited or not), existence of obstacles (mountains, valleys), etc. With regard to ships, the costs are associated with the tank volume and the loading and unloading processes (IPCC, 2005).
2.2.3.
S
TORAGEIn the context of a CCS project, the captured CO2 needs to be stored in appropriate places. The question
7
these three, the trapping of CO2 through industrial products is also an option. However, it is not
considered as a CCS solution. Regardless of the storage site, there are several aspects of the storage stage that must be considered:
Long storage period: millions to millennia of years;
The cost of storage (injection and monitoring) should be minimized;
The applied methods can not infringe any national or international legislation;
Environmental impacts need to be carefully studied and minimized;
The probability of an accident occurring should be practically nil.
Ocean Storage
Oceans are, in their nature large storage sites of CO2. Carbon dioxide is soluble in water and gas
exchange between the ocean surface and atmosphere occurs naturally. Therefore, the vast majority of CO2 captured by oceans concentrates in the upper fraction, where an increase in the acidity of the water
has already been detected, which is reflected in the decrease of the water’s pH. However, at greater depths the pH remains stable (Brewer et al., 2000). Thus, the use of oceans as CO2 storage sites, only hasten this slow but natural process.
This solution implies the injection of CO2 in oceans where, depending on the depth, CO2 dissolves in water or sinks and accumulates on the seabed (phenomenon known as “deep lake”) (Aya et al., 2004). Despite this inherent advantage, which is the large storage capacity, it is expected that large scale injection can cause a change in the pH of the ocean that could bring consequences to the marine life. Due to the latter and due to several other physical and chemical phenomena that are still not well understood, ocean storage is not yet considered an economically and politically viable option (Chen et al., 2005).
8 Mineral Carbonation
Mineral carbonation involves converting CO2 into inorganic solid carbonates by resorting to chemical
reactions to accelerate this natural process. This process requires the existence of certain minerals found in silicate rocks, thus demanding their mining resulting in environmental impacts and high energy costs. Furthermore, following the conversion of CO2 into solid carbonates, it is then necessary to proceed to the transport and disposal of the solid carbonates. Although this type of storage is the safest and also the one that requires less monitoring due to the high costs and environmental impacts this option is currently being excluded from large scale implementation (Bachu, 2008).
Geological Storage
In contrast to the two previous options, carbon dioxide and geological storage (CCGS) is currently and probably the best and only option in the short-medium term for significantly reducing CO2
concentrations. This is due to the fact that besides storage in geological formations much resembling the natural accumulation of oil, gas and even CO2, which provides confidence in long-term storage (Bradshaw and Dance, 2005), this technology has the advantage of rapid implementation due to extensive experience developed over the years by the oil and gas industries.
The geological formations currently considered for CCGS projects are: depleted oil and gas reservoir, coal beds and deep saline aquifers. These types of geological traps are relatively well distributed throughout the globe and can be found in sedimentary basins, either offshore or onshore. In addition, to these three main formations, structures such as salt caves and abandoned mines are also considered. Although, the storage capacity of these structures is not significant, those could act as intermediate reservoirs (IPCC, 2005). Regarding the storage capacity of the three main formations, there are not yet any studies that clearly define the overall capacity, mainly due to inexistent detailed knowledge concerning the saline aquifers. However, addressing the storage capacity in another way, i.e. by looking at a bigger picture and simply determining whether there is enough capacity for the amounts of CO2
produced, present studies safely state that there is a capacity of 200Gt and a high probability of 2000Gt, which is the estimated amount of CO2 to be produced over the XXII century (IPCC, 2005).
The storage of the injected CO2 into geological formations, occurs through a combination of several
physical and geochemical trapping mechanisms. Site selection is imperative for the success of CCGS projects, meaning that there are a series of criteria to set prior to selection. The criteria and trapping mechanisms are presented in more detail in section 2.4.
Industrial use
This solution consists of the industrial use of CO2 in chemical and biological processes such as the
9
2.3.
CURRENT STATUS AND ALTERNATIVE APPROACHES
From the three CCS technologies presented in the previous section, only CCGS is seriously taken into consideration. With regard to ocean storage, the technology is quite complex and still requires many studies on both a technical and environmental level. Since the environmental impacts that could result are not yet well understood ocean storage is so far, not seen as a serious mitigation solution. Furthermore, due to the high costs and also the strong environmental impacts that it may cause, mineral carbonation is excluded as an option to be pursued. However, despite the obvious disadvantages of these solutions compared to CCGS, both are object of investment and development by some countries but not expected to be applied on a large scale in the short-medium term (IPCC, 2005).
Thus, the current state of CCGS is promising compared to the others, as it is the one which is the easiest to implement due to its high maturity as a technology implemented by the oil and gas industries. The capture and separation stages are already carried out by the oil and chemical industries. The transport of CO2 on a large scale is also implemented. In addition, the geophysical exploration for the selection of suitable storage sites has long been practiced along with the injection process which has been in under development by “Enhancing Oil Recovery” (EOR) projects for 30 years (IPCC, 2005). Regarding the storage stage, evidence from oil and gas reservoirs indicate storage times of about 5-100 million years (Bradshaw and Dance, 2005).
Nevertheless, despite all three stages already being implemented separately, their integration into a CCGS project is not a simple task. This is because of the high cost of capture, the transport being limited to the pipeline network and the high probability of the capture site being far from the storage site, which involves long-distance transport, resulting in a considerable increase in costs. Injection and storage operations require further investigation in order to ensure that no leakage of CO2 occurs and because of the lack of experience in implementing a monitoring project. These aspects result in the fact that CCGS projects are only viable for very particular cases. IPCC (2005), mentions the conditions which make a project viable. However, being realistic and transparent, currently, this technology is only economically feasible if one of the following premises is verified: implementing this technology in an EOR or ECBM (enhancing coal bed methane) project; significant increase in the market cost of CO2
emission licenses; added value for underground CO2.
Enhancing fuel recovery in the particular case of EOR, is performed through an injection well where CO2 is injected, pushing the oil to the capture well. Moreover the dissolution of CO2 in oil decreases its viscosity, thereby facilitating its flow. In the case of ECBM, injected CO2 causes the release of methane gas, which is naturally found adsorbed into the organic coal matter, due to greater affinity of the carbon dioxide compared to the methane. Thus, the profits obtained from the additional extraction of fuel can cover the costs of the technology. In the present context, CO2 has economic value if found in the
atmosphere (through the payment of CO2 emission licenses). However, the current market cost is still
10
that the last two premises will change, restricting the application of this technology only to enhancing fuel recovery projects, which greatly reduces the overall storage capacity (360Mt/year). Although only applicable to specific situations, it is expected that this solution could significantly contribute towards mitigating CO2 concentrations.
Currently, even though none of them have the main objective of storing CO2, there are three projects on a commercial scale that have implemented CCGS technology. The Sleipner project in Norway (Figure 2.2), is an offshore platform located in the North Sea, from where CO2 obtained from an ECBM operation is injected into a nearby saline formation about 800 meters below the seabed. This project is injecting about 1 Mt/year and is expected to store a total of 20 Mt by the end of the operations. The main objective of the In Salah project in Algeria is also the stimulation of natural gas extraction. CO2 is separated from
natural gas and afterwards injected at a ratio of 1.2Mt/year into a saline formation 1800 meters deep. The EOR project in Weyburn, Canada aims to store almost all the CO2 (20Mt) produced and used in the oil recovery operations.
2.4.
CCGS TRAPPING MECHANISMS AND SUITABLE GEOLOGICAL MEDIA
Bearing in mind the current status described above and the context of the present work, this section, presents only the trapping mechanisms referring to CCGS technology.
The sequestration of CO2 in geological formations occurs through a combination of various trapping
mechanisms. These entrapment phenomena can be of a chemical or physical nature and depend
11
obviously on the storage site in question. In oil reservoirs and saline aquifers the operating mechanisms are very similar, where the main phenomenon being the static trapping where CO2 is prevented from
flowing due to a physical barrier (less permeable rock), meaning that if there is an available pathway, CO2 will flow. Apart from this, other secondary mechanisms act, such as residual trapping, solubility
trapping and mineral trapping. The first relates to the fact that CO2 is trapped in the geomaterial pores due to capillary forces formed between CO2 and resident fluid and even if a pathway exists, it will not flow. Solubility trapping is a chemical phenomenon in which CO2 dissolves in the resident fluid. This
process is optimized for cases where underground flows exist, so that the resident fluid saturated with CO2 is replaced by unsaturated fluid. These geological traps are found in sedimentary basins that often
contain minerals such as olivine and serpentine, which chemically react with CO2 forming other mineral
solids such as calcite and magnesium.
As far as coal beds are concerned, the trapping mechanism relates to the adsorption of CO2 into the organic coal matter, more specifically, it is trapped in the micropore walls of the coal. It is important to highlight the fact that storing CO2 in coal beds implies that these become impracticable for exploitation, since once atmospheric pressure is observed, CO2 desorbs.
Due to their different natures (chemical or physical), the mechanisms have different functions and time windows. Firstly, the injected CO2 is trapped by primary mechanisms, static in the case of oil reservoirs
and aquifers, and by adsorption in coal beds, whose main role is storage capacity. Afterwards, secondary mechanisms such as residual, solubility and mineral mechanisms start to act, not contributing significantly to the overall capacity but indisputably increasing safety storage, since CO2 is no longer
found as a free phase (Bachu, 2008). Figure 2.3, shows the time window of the different trapping mechanisms acting in a geological formation such as depleted oil reservoirs and deep aquifers.
Although it is known that formations such as oil reservoirs, saline aquifers and coal beds are potential CO2 storage sites, selection and suitability is somewhat complex and it is necessary to carry out an
analysis in order to determine a series of aspects. Excluding coal beds, in brief the geological formations must consist of a reservoir-seal pair. As already mentioned, such geological media are found in
Figure 2.3 - Time frame of the primary and secondary trapping mechanisms
12
sedimentary basins, because only sandstone and carbonate rocks have the porosity and permeability required for high storage capacity and injection rates, while being confined by a very low permeable shale. This low permeability barrier is often termed “caprock” in the oil industry. The existence of a
sealing formation above the storage formation is of extreme importance, since due to a lower density of carbon dioxide compared to the one of the resident fluid (oil or water), buoyancy forces act all the time, imposing a vertical flow with upwards direction.
According to Bachu (2008) the requirements for a potential geological storage site are:
Accessibility: the location is economical available and the enterprise responsible for the storage has all the legal rights to do so;
Capacity: the geological formation has the sufficient porosity, i.e. storage capacity for the target volume of injected source;
Injectivity: the aquifer has the desired permeability in order to allow the injection at the same rate as the CO2 is captured at the source;
Storage Security: the caprock is impermeable enough to avoid vertical migration (leakage); well defined trapping mechanisms; the geologic environment is stable enough to guarantee storage site integrity (no seismic actions); fault system well defined to assure that no vertical and/or horizontal migration is possible.
Once a potential geological formation has been detected, it is necessary to make a geological, hydrogeological, geochemical and geotechnical characterization of the storage site and its surroundings. Hence, and according to Bachu (2008) and Chevalier et al. (2010), the following criteria should be addressed:
Depth: due to CO2 properties, variation with pressure and temperature, depth affects CO2
mobility through porous media, ergo affects storage capacity and security. Hence, depth should be such that it ensures high density and viscosity of CO2 in order to diminish
buoyancy forces, increase storage capacity and security but at the same time not so deep that drilling costs and energy requirements for carbon dioxide compression would be too high;
Thickness of the storage formation: considering homogeneous porosity and permeability throughout the aquifer, then its thickness is directly proportional to storage capacity;
Geothermal gradient: the in situ temperature at the storage formation is a relevant criterion to be evaluated since it affects the CO2 and resident fluid density and viscosity, influencing the CO2 plume mobility. Furthermore, if the fluid is injected with a lower temperature than
the storage formation, thermal contraction will occur;
13
Seismicity: having a record of the seismicity history of the surrounding area is crucial. A low seismicity is convenient, otherwise seismic actions may open pre-existing fractures or fault activation, causing CO2 leakage;
Fault systems: faults can be either favourable, creating structural traps or unfavourable, providing pathways for fluid circulation leading to a possible leakage. Chevalier et al. (2010), mentions three classes of faulted zones. One featuring high fault density and/or with faults that cut through the entire sequence of lithology, hence favouring leakage. Another, featuring faults that do not cross the caprock, which are considered to be favourable to storage due to their structural traps and finally an area that presents very little evidence of faulting. Thus, it is crucial to carry out a detailed study of the fault system, especially any that encounter the caprock;
Structural traps: despite not being a pre-requisite for CO2 storage a detailed evaluation of
the structural traps can be economically advantageous, since some effective structure traps can constrain the injected carbon dioxide into a limited area thereby resulting in a reduction of the site investigation required to establish an appropriate injection site;
Stress regime: the existing state of stress (𝐾0) needs to be carefully judged and investigated during the CCGS design stage. According to Rutqvist et al. (2008) thrust regimes (𝐾0< 1) are less favourable for CO2storage.
2.5.
RISKS AND MONITORING
Like any human activity, this technology involves some risks that need to be properly assessed and studied in order to provide public confidence in this technology as a serious solution to mitigate CO2
concentrations. The risks arise mainly from the storage stage that includes the injection operation and the storage itself. With regard to the transport stage, excluding the possibility of a pipeline rupture, no major risks are projected. In fact, since the oil industry has been set up, only a few cases like the latter have been reported (Damen et al., 2006). As far as the storage stage is concerned, there are a number of risks that must be evaluated, such as:
CO2 leakage through the injection well; Leakage through abandoned wells;
Leakage through undetected faults or fractures;
Activation of existing faults or opening of pre-existing fractures;
Rupture of the reservoir;
Surface settlements;
14
the injection stage. However, greater attention is needed during injection stage due to the increasing pore pressure in the reservoir, which can affect the mechanical stability of the seal which may result in the opening of fractures or fault activation. Thus, and according to IPCC (2005), the risk of leakage can be classified as global or local. It is considered global if the release of CO2 is of such an order that it
could contribute significantly to climate change and affect populations, ecosystems or potable water aquifers. Except in a catastrophe situation, a leakage at a global level is not likely to occur since current CCGS projects have evidence of retention fractions close to 99%. Local risks can occur though abandoned wells, undetected faults or fractures.
Many of the above risks can be avoided in advance through a correct selection of the storage site and can still be detected after their occurrence through monitoring methods. Although no methodology has yet been formulated, IPCC (2005) mentions some aspects that should be monitored:
Control the quantity of injected and stored CO2; System to detect possible leakages;
System to detect micro-seismicity;
Surface changes;
Pressure at the injection well;
Routine seismic analysis;
Analysis of the geomaterials between the storage formation and surface.
The risk can be evaluated through risk assessment, i.e. by means of probabilistic analysis (He et al., 2011) or through a technical analysis that can create a solid knowledge about a certain phenomenon enabling the definition of safety factors (Rutqvist and Tsang, 2002). In the present study, the objective is to better assess the mechanical behaviour of the seal during the injection process through a finite element analysis.
2.6.
CHALLENGES AND BARRIERS FOR DEPLOYMENT OF CCGS
Through projects such as Sleipner and In Salah, CCGS has been proven to be technologically possible. However, the relevant issue to address is whether this technology is indeed economically viable. Bachu (2008) states that many entities argue that this is the biggest barrier and in fact it is, should none of the following premises be detected: added value to the stored CO2, implementation of the technology in
EOR or ECBM operations; increase of the market value of CO2 emission licenses. The question arises
as to whether this technology is economically viable due to the high implementation costs, more in particular, with the capture system, this being a challenge rather than a barrier. Other issues such as detailed assessment of costs, experience in integrating the three stages, studies to establish the relation between emission sources and geological storage site represent other challenges.
15
17
3.
CO
2
S
TORAGE IN
D
EEP
A
QUIFERS
3.1.
COUPLED THERMO-HYDRO-MECHANICAL BEHAVIOUR
The focus of the present study is to analyse the injection of CO2 in deep aquifers. CCGS projects that
have deep aquifers as geological formations result in complex, thermo-hydro-mechanical coupled processes. Injecting carbon dioxide requires that the injection pressure is greater than the one established in the formation. In addition, the injection of CO2 results in a desaturation process of the
aquifer by displacing the resident water. The latter implies pressure build-up within the aquifer, which affects the effective stress regime resulting in deformations of the aquifer and caprock (Vilarrasa, 2012). The increasing pressure and spatial distribution depends on several aspects such as the injection rate, reservoir permeability and thickness, CO2 conditions, injection temperature, etc.
Suitable media for CCGS projects should ideally be placed at depths of around 800 meters (Bachu, 2008), in order to ensure injection of CO2 either in “supercritical” or liquid conditions, i.e. higher densities.
It should be emphasized that there is no “supercritical” state and this is just a figure of expression in order to facilitate the designation of CO2 at a certain temperature and pressure in which CO2 behaves
as a gas and a liquid. Taking this into consideration, the expression “supercritical state” is employed in order to facilitate description, whilst its true definitions should never be forgotten. In addition, regardless its conditions carbon dioxide will always be lighter than the resident water. Consequently, buoyancy forces rise and CO2 tends to float. Figure 3.1, shows the CO2 saturation profile, being observed the
tendency of the CO2 to accumulate at the top of the aquifer due to the buoyancy forces. This means
that a sealing rock is required and should be characterized by a very low permeability, in order to prevent vertical migration.
Thermal effects emerge if the injected CO2 has a different temperature from the storage formation. In
the context of this study the isothermal analysis refers to injecting CO2 in supercritical conditions and
the non-isothermal, to CO2 in liquid conditions (lower temperature than the reservoir). Liquid injection
brings several advantages when compared to supercritical. Liquid CO2 is characterized by a higher
density than in supercritical conditions. Therefore, for a given mass of CO2, a smaller volume of resident
18
water of the formation has to be displaced, leading to a lower overpressure in the reservoir. Furthermore, should CO2 is injected in liquid conditions, buoyancy forces are lower and viscosity higher, implying
safer storage conditions. In addition, Vilarrasa (2012) states that injecting liquid CO2 is energetically
more efficient than in supercritical conditions, since injection is carried out in the same state as that in which CO2 is transported. However, liquid CO2 implies lower temperature, inducing thermal stresses i.e. contractive behaviour that could affect caprock integrity. The latter brought the motivation for carrying out a non-isothermal study. Figure 3.2 represents in a schematic and simple way, through Mohr circles, the mechanical behaviour during CO2 injection where the effective stress of the geomaterial is first
reduced due to overpressure during the desaturation process followed by an additional reduction due to thermal contraction.
Once injected in deep aquifers, several physical and chemical phenomena take place such as:
Fluid flow due to pressure gradients imposed by injection;
Fluid flow due to natural hydraulic gradients;
Buoyancy forces due to differences between resident water and CO2; CO2 dissolution in water;
Mineral carbonation;
Diffusion.
3.2.
UNSATURATED GEOMATERIAL
Due to the desaturation process, some concepts of unsaturated geomaterials will be presented below. The matrix of a geomaterial is comprised by three phases. The grains of the geomaterial comprise the solid matrix, whereas the remaining phases are enclosed within what are called voids. The voids can be either filled with liquid, gas or both. Unsaturated conditions imply that the pores are filled simultaneously with water and CO2. Each one has its own mass, volume and pressure. The degree of
∆p > 0
∆T < 0
τ
𝞼
′
19
saturation is the parameter used to describe the state of a geomaterial and is defined as the ratio between the volume of water and the volume of voids (Equation 3.1). Figure 3.3 illustrates the geomaterial matrix concept.
𝑆 =𝑉𝑉𝑤
𝑣 (3.1)
Capillary Mechanisms
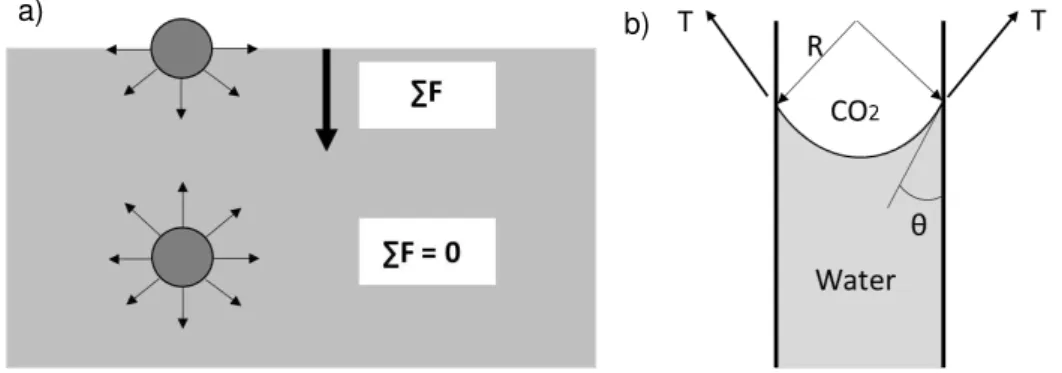
Capillary phenomena can be described as the motion of water in porous media that counters the gravity force. This physical mechanism depends on the type of liquid (surface tension) and on the surface (contact angle). Figure 3.4a, shows that in the bulk fluid the forces acting on a molecule are equal in all directions, so the molecule feels no net force. However, there are regions where unbalanced attractive forces with a downward direction are generated. In these conditions the liquid phase along with the gaseous phase form an interphase which when in contact with the solid particles, it curves and a meniscus is formed (Figure 3.4b) (Laloui, 2010).
a) b)
Figure 3.3 – Geomaterial matrix concept (adapted from Eichenberger, 2013)
Figure 3.4 – a) Equilibrium of water molecules; b) Capillary meniscus (adapted from Laloui, 2010)
Solid (solid particles) Solid (solid grains)
Solid (solid grains)
Liquid (water) Gas (CO2) Liquid (water)
Gas (CO2)
capillary meniscus
20 Geomaterial Suction
In the context of soil/rock mechanics the capillary meniscus results in the appearance of suction forces, which are defined as:
𝑠 = (𝑝𝑐− 𝑝𝑤) (3.2)
where, 𝑝𝑐 is CO2 pressure and 𝑝𝑤 water pressure.
Water Retention Behaviour
Assuming that a saturated geomaterial is exposed to desaturation, it starts to lose water on the interface. With the continuous water loss, capillary menisci are generated, while the geomaterial remains in almost saturated conditions. The appearance of this capillary mechanism is followed by an increase in negative pore water pressure, i.e. suction. With the continuous evolution of the desaturation process, the meniscus curvature will increase until it reaches a critical angle (𝜃𝑐𝑟). As soon as this critical value is reached the meniscus is displaced and CO2 enters the geomaterial matrix. The suction value above
which the degree of saturation becomes lower than one, is called 'air entry value' (𝑠𝐸). At this stage the geomaterial is in a partially saturated condition. The mechanism described occurs from the larger pores to the smaller ones until it reaches a state of residual saturation𝑆𝑟𝑒𝑠. The relation between suction and degree of saturation enables us to describe the water retention behaviour of a geomaterial and it is represented by the water retention curve (WRC) presented in Figure 3.5.
Figure 3.5 – Water retention curve (adapted from Eichenberger, 2013)
𝜃 = 90 𝜃 < 90
𝜃 = 𝜃𝑐𝑟
21
3.3.
THEORETICAL FRAMEWORK AND FIELD EQUATIONS
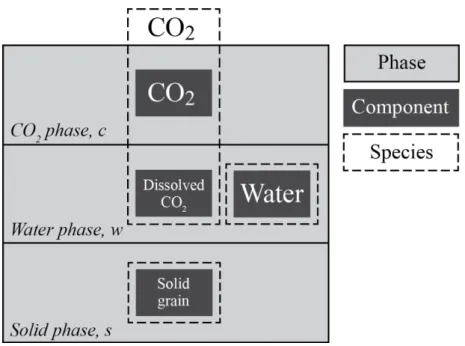
The theoretical framework treats a partially saturated medium as a multiphase system, in which the voids are filled with liquid water and carbon dioxide. Therefore, the system is broken down into three phases (water, CO2 and solid), of which the water phase consists of liquid water and dissolved carbon
dioxide, the CO2 phase of dry CO2 and the solid consists of the solid grains. Finally, the system can be described, resorting to the representative elementary volume (REV) with the following components:
Solid material, i.e. the solid phase, denoted here by the subscript s;
The CO2 phase, consisting of the injected CO2 denoted here by the subscript c;
The water phase, consisting of the water formation (w) and the dissolved carbon dioxide in water (dc).
The framework presented below takes into account the following processes: multiphase fluid flow occurring under pressure and temperature governed by advective and non-advective (diffusion) flows; interaction between fluids, addressing relative permeability evolution of water and CO2 and the exchange terms due to CO2 dissolution and degassing phenomena; heat flow through convection and conduction; stress-strain relationship; effective stress changes due to fluid pressure and temperature variations. Figure 3.6shows the components of the mixture.
The equations are written following the macroscopic approach because on a microscopic level the status of a phase is described in such a scale that discontinuities, which are smaller than the macroscopic magnitudes, can be examined. Such a level of detail is not necessary and for a more practical description and to enable the assessment of quantities that can be measured through laboratory tests, a macroscopic approach is more advantageous. On a macroscopic level, the porous medium domain is equivalent to a material where all the phases are thought to be continuously distributed throughout space, i.e. at any point all phases are present implying that the latter discontinuities can no longer be
22
detected. Thus, only three mass balance equations are required (one for each species) along with momentum, energy and constitutive equations to fully describe the thermo-hydro-mechanical behaviour (Bear, 1988).
3.3.1.
M
ASSC
ONSERVATIONE
QUATIONSFollowing the compositional approach (Panday and Corapcioglu, 1989), the mass balance equations are written for the species rather than the phases. This has the advantage of the exchange terms between phases being cancelled out. Furthermore, the equations follow the Lagrangian updated formulation (Charlier, 1987), which considers that the surface of the volume element is moving along with the fluid. This implies that fluid flow cannot cross this surface, hence the total mass within the volume element is automatically conserved and large deformations and displacements are considered. Water phase pressure 𝑝𝑤, CO2 phase pressure 𝑝𝑐, temperature 𝑇 and solid displacement field 𝒖 are
considered as the primary state variables to describe the state of the material.
3.3.1.1.
S
OLIDConsidering a compressible solid phase and for a certain volume 𝑉 of the REV the mass conservation equation for the solid species can be written as:
𝜕
𝜕𝑡 ((1 − 𝑛)𝜌𝑠) + 𝑑𝑖𝑣 [(1 − 𝑛)𝜌𝑠( 𝜕𝒖
𝜕𝑡 )] = 0 (3.3)
where 𝑛 is porosity, 𝜌𝑠 solid density, 𝑡 is time and 𝜕𝑢
𝜕𝑡= 𝒗𝒔 is the volumetric deformation rate. Expanding the equation (3.3) we obtain:
−𝜕𝑛𝜕𝑡 𝜌𝑠+ (1 − 𝑛)𝜕𝜌𝜕𝑡 −𝑠 (1 − 𝑛)𝒈𝒓𝒂𝒅(𝜌𝑠)𝒗𝒔+ 𝜌𝑠𝑑𝑖𝑣((1 − 𝑛)𝒗𝒔) = 0 (3.4)
dividing equation 3.4 by 𝜌𝑠,the latter, can also be written as follows: 𝜕𝑛
𝜕𝑡 =(1 − 𝑛) 1 𝜌𝑠
𝑑𝑠𝜌 𝑠
𝑑𝑡 + 𝑑𝑖𝑣[(1 − 𝑛)(𝒗𝒔)]
(3.5)
Resorting to Lewis and Schrefler (1987) the expression for the solid density variation is expressed as: 1
𝜌𝑠 𝑑𝑠𝜌
𝑠 𝑑𝑡 =
1
1 − 𝑛 [(𝑏 − 𝑛) 1 𝐾𝑠
𝑑
𝑑𝑡(𝑆𝑤𝑝𝑤+ (1 − 𝑆𝑤)𝑝𝑐) − 𝛽𝑠(𝑏 − 𝑛) 𝜕𝑇
𝜕𝑡 −(1 − 𝑏)𝑑𝑖𝑣(𝒗𝒔)] (3.6) where, 𝐾𝑠 is the bulk modulus of the solid material, 𝑆𝑤 water phase saturation, (1 − 𝑆𝑤) is CO2 phase
saturation, 𝑝𝑤 water phase pressure, 𝑝𝑐 CO2 phase pressure, 𝛽𝑠 volumetric thermal expansion coefficient for the solid material, 𝑇 temperature and (1 − 𝑏) = 𝐾𝑇
𝐾𝑠
23
dioxide phase pressure and the water phase pressure. Finally, by introducing (3.6) in (3.5) we can express the porosity variation through the primary state variables:
𝜕𝑛
𝜕𝑡 = (𝑏 − 𝑛) [ 1 𝐾𝑠
𝑑
𝑑𝑡(𝑆𝑤𝑝𝑤+ (1 − 𝑆𝑤)𝑝𝑐) − 𝛽𝑠 𝜕𝑇
𝜕𝑡 + 𝑑𝑖𝑣(𝒗𝒔)] (3.7)
3.3.1.2.
W
ATERS
PECIESThe mass balance for water species can be written as: 𝑑𝑤(𝑛𝑆
𝑤𝜌𝑤)
𝑑𝑡 + 𝜌𝑤𝑛𝑆𝑤𝑑𝑖𝑣(𝒗𝒘) = 0 (3.8)
where, the first term refers to the storage term and the second to the water phase advective flow, and 𝜌𝑤 is the water phase density. The equation (3.8) can be expanded as follows:
𝑆𝑤𝜌𝑤𝜕𝑛𝜕𝑡 + 𝑛𝜌𝑤𝜕𝑆𝜕𝑡 + 𝑛𝑆𝑤 𝑤𝜕𝜌𝜕𝑡 + 𝒈𝒓𝒂𝒅𝑤 (𝜌𝑤𝑛𝑆𝑤)𝒗𝒘𝒔+ 𝜌𝑤𝑛𝑆𝑤𝑑𝑖𝑣(𝒗𝒘) = 0 (3.9)
where 𝑣𝑤𝑠= 𝑣𝑤− 𝑣𝑠. Using a Lagrangian description of continuum deformation, the motion of the species is expressed with respect to the motion of the solid phase. Thus introducing the equation (3.7) in (3.9) and resorting to Darcy’s law to describe the advective flow, the mass balance equation for the water species results in:
[𝑛𝜌𝑤 𝜕𝑆𝜕𝑠 +𝑤 (𝑏 − 𝑛)𝐾
𝑠 𝑆𝑤 𝜌𝑤 (1 − 𝑆𝑤 − 𝜕𝑆𝑤
𝜕𝑠 𝑠 )] 𝜕𝑝𝑐
𝜕𝑡
[−𝑛𝜌𝑤 𝜕𝑆𝜕𝑠 + 𝑆𝑤 𝑤 𝑛𝜕𝜌𝜕𝑝𝑤 𝑤+
(𝑏 − 𝑛)
𝐾𝑠 𝑆𝑤 𝜌𝑤 (𝑆𝑤 + 𝜕𝑆𝑤
𝜕𝑠 𝑠 )] 𝜕𝑝𝑤
𝜕𝑡
−[𝑛𝑆𝑤 𝜌𝑤 𝛽𝑤 + (b − n)𝑆𝑤 𝜌𝑤 𝛽𝑠 ]𝜕T𝜕𝑡 +𝑏 𝜌𝑤 𝑆𝑤 𝑑𝑖𝑣(𝒗𝒔 )
+𝑑𝑖𝑣 (𝜌𝑤 𝑘𝑟𝑤𝜇𝒌𝑖𝑛𝑡
𝑤 (−𝒈𝒓𝒂𝒅(𝑝𝑤 ) + 𝜌𝑤 𝒈)) = 0
(3.10)
where, 𝛽𝑤 is the volumetric thermal expansion coefficient of water, 𝑘𝑟𝑤 is the water relative permeability, related to the state of saturation and 𝑘𝑖𝑛𝑡 the intrinsic permeability and 𝜇𝑤 the water viscosity. The concepts of intrinsic and relative permeabilities are addressed in more detail in section 3.3.4.2.
3.3.1.3.
CO
2S
PECIESHereinafter, firstly the mass balance equations will be presented separately for the components, CO2
24 CO2 Component
The mass balance equation for the CO2 component in the gas phase can be expressed as:
𝑑𝑐(𝑛𝑆 𝑐𝜌𝑐)
𝑑𝑡 + 𝜌𝑐𝑛𝑆𝑐𝑑𝑖𝑣(𝒗𝒄) = 𝑓𝐶𝑂2−𝑤 (3.11)
where, 𝑆𝑐 is the carbon dioxide saturation which is defined as 𝑆𝑐 = (1 − 𝑆𝑤), 𝜌𝑐 the carbon dioxide density and 𝑓𝐶𝑂2−𝑤 refers to the exchange term, i.e the process of dissolution of carbon dioxide in water. Following the same logic used for the water species the mass balance equation can be written as:
[−𝑛𝜌𝑐 𝜕𝑆𝜕𝑠 +𝑤 (1 − 𝑆𝑤 )𝑛 𝜌𝑐 𝜕𝜌𝜕𝑝𝑐 𝑐 +
(𝑏 − 𝑛)
𝐾𝑠 (1 − 𝑆𝑤 ) 𝜌𝑐 (1 − 𝑆𝑤 − 𝜕𝑆𝑤
𝜕𝑠 𝑠)] 𝜕𝑝c
𝜕𝑡
+ [𝑛𝜌𝑐 𝜕𝑆𝜕𝑠 + 𝑤 (𝑏 − 𝑛)𝐾
𝑠 (1 − 𝑆𝑤 ) 𝜌𝑐 (𝑆𝑤 + 𝜕𝑆𝑤
𝜕𝑠 𝑠)] 𝜕𝑝w
𝜕𝑡
+ [− (𝑏 − 𝑛) (1 − 𝑆𝑤 ) 𝜌𝑐 𝛽𝑠 + (1 − 𝑆𝑤 )𝑛 𝜌𝑐 𝜕𝜌𝜕𝑇 ]𝑐 𝜕T𝜕𝑡 +𝑏 𝜌𝑐 (1 − 𝑆𝑤 )𝑑𝑖𝑣(𝒗𝒔 )
+𝑑𝑖𝑣 (𝜌𝑐 𝑘𝑟𝑐𝜇𝒌𝑖𝑛𝑡
𝑐 (−𝒈𝒓𝒂𝒅(𝑝𝑐 ) + 𝜌𝑐 𝒈)) = 𝑓𝑐𝑜2−𝑤
(3.12)
where, 𝑘𝑟𝑐 is the carbon dioxide relative permeability, 𝑘𝑖𝑛𝑡 the intrinsic permeability of the medium and 𝜇𝑐 the carbon dioxide viscosity. The terms 𝜕𝜌𝑐⁄𝜕𝑝𝑐 and 𝜕𝜌𝑐⁄𝜕𝑇 represent the carbon dioxide density variation with pressure and temperature, respectively. Carbon dioxide being a real gas requires a parameter which describes the non-ideal behaviour of the gas. For this purpose, and resorting to Peng and Robinson (1976) state equation a 𝑍 parameter is introduced. Hence the relation between density and pressure can be written as follows:
𝜌𝑐=𝑍1𝑀𝑅𝑝𝑇𝑐 (3.13)
where, 𝑍 is the compressibility parameter, 𝑀 is the CO2 molar mass and 𝑅 is the gas constant. It is
important to note that 𝑍 is pressure and temperature-dependent. Hence the density variation with respect to time is expressed as:
𝑑𝜌𝑐 𝑑𝑡 = 𝜕𝜌𝑐 𝜕𝑝𝑐 𝜕𝑝𝑐 𝜕𝑡 + 𝜕𝜌𝑐 𝜕𝑇 𝜕𝑇 𝜕𝑡 (3.14) where, 𝜕𝜌𝑐 𝜕𝑝𝑐 =
𝑀 𝑍𝑅𝑇 (1 −
𝑝𝑐 𝑍
𝑑𝑍 𝑑𝑝𝑐) 𝑎𝑛𝑑
𝜕𝜌𝑐 𝜕𝑇 = −