Attributon License nonteﯡ httpﯡ//wwwwww scielo br/scielo phpcscript=sci_arttextppi
=01011-214X2107110210092plng=enpnrm=iso Acesso emﯡ 20 fev 2108
REnERÊNrIA
BAPTI0TA, Gustavo Mace o e Mello; TEOBALDO, Débora Worl Vieww-2 sensor for the etecton of
hematte an goethite in tropical soils
Pesquisa Agropecuária Brasileira
, Brasília, v 52, n 02, p
0092-0212, ez 2107 Disponível emﯡ <httpﯡ//wwwwww scielo br/scielo phpc
WorldView-2 sensor for the detection of hematite
and goethite in tropical soils
Gustavo Macedo de Mello Baptista(1) and Débora Teobaldo(1)
(1)Universidade de Brasília, Instituto de Geociências, Campus Darcy Ribeiro, Asa Norte, CEP 70910-900 Brasília, DF, Brazil. Email:
[email protected], [email protected]
Abstract – The objective of this work was to simulate the bands of the WorldView-2 sensor from laboratory specters, in order to study its potential to detect iron oxides, besides proposing a spectral index based on the depth of the spectral feature (RHGtPf). The iron index (IFe) and the hematite index (IHm), developed by
Madeira Netto for bands of Landsat TM-5 sensor, were adjusted for WorldView-2 to test the potential of the new yellow band. The results showed that the yellow band degrades to 2% compared to the red one. This is
due to fact that mineral quantification and identification are in the absorption feature, not in the reflectance
one, and it is only improved in the visualization of color. A new spectral index, the RHGtPF, based on the depth
feature with the continuum-removed spectra, was proposed, since the new bands of the WorldView-2 sensor – the coastal blue and yellow bands – allow a better individualization of the absorption features for goethite and hematite separately. The new index is statistically similar to the ratio Hm / Gt + Hm; however, it is not similar to the mineralogical relation obtained with Munsell colors.
Index terms: mineralogical relation, remote sensing, spectral feature depth, spectral indices.
Sensor WorldView-2 para detecção de hematita e goethita em solos tropicais
Resumo – O objetivo deste trabalho foi simular as bandas do sensor WorldView-2 a partir de espectros obtidos em laboratório, para estudar seu potencial de detectar óxidos de ferro, além de propor um índice espectral com base na profundidade da feição espectral (RHGtPF). O índice férrico IFe e o índice hematita IHm, desenvolvidos
por Madeira Netto para as bandas do sensor Landsat-TM5, foram ajustados para o WorldView-2 para testar o potencial da nova banda do amarelo. Os resultados mostraram que a banda do amarelo degrada em 2%
comparada à do vermelho. Isso se deve ao fato de a quantificação e identificação do mineral estarem localizadas na feição de absorção e não na de reflectância, e isso só é melhorado na visualização da cor. Um novo índice
espectral, RHGtPF, baseado na profundidade de feição com o contínuo espectral removido, foi proposto, pois
as novas bandas do sensor WorldView-2 – azul costal e amarelo – permitem individualizar melhor as feições de absorção da goethita e da hematita separadamente. O novo índice é estatisticamente similar à relação Hm / Hm + Gt; porém, ele não é similar à relação mineralógica obtida por meio das cores de Munsell.
Termos para indexação: relação mineralógica, sensoriamento remoto, profundidade da feição espectral, índices espectrais.
Introduction
Tropical soil studies by means of remote sensing data have contributed to understanding the soil cover to spatialize the study area variability (Baptista et al., 2011).
One of the most effective approaches in the use of sensor data is a spatialization of mineralogical relations – especially in a clay fraction, in relation to iron oxides and hydroxides –, by which the multispectral systems allow of this kind of analysis (Madeira Netto, 1993; Lagacherie et al., 2008; Genú & Demattê, 2011; Sousa
Junior et al., 2011; Gerighausen et al., 2012), and by means of hyperspectral systems (Baptista et al., 2011).
This clay fraction is represented mainly by iron oxides (hematite and goethite), aluminum oxides (gibbsite), and clay minerals 1:1 group (kaolinite) present mainly in the Oxisols (Schaefer et al., 2008).
The hematite/goethite mineralogical relation can be studied with remote sensing data, both multi- and hyperspectral ones, that seek to spatialize the pedohydric character of an area, characterizing it as
oxidation or oxidation of Fe+3 (Inda Junior & Kämpf,
Reatto et al., 2008; Sousa Junior et al., 2008; Barbosa et al., 2009; Campos et al., 2010; Baptista et al., 2011; Silva Junior et al., 2012).
According to Dalmolin et al. (2005), iron oxides have typical absorption features in the region around
0.9 μm, which are more intense when the iron content
is higher. Although the visible region is the most important for iron color visualization in iron oxides, other absorption characteristics can be used in other
portions of the spectrum for the quantification of iron
oxides.
However, as stated by Ahmad et al. (2016), typical
absorption features from the presence of Fe+3 ions can
be found between 0.4 to 0.9 μm, more specifically in 0.48 μm for goethite, and 0.53 μm for hematite
(Sherman & Waite, 1985).
Nowadays, sensor systems have become increasingly specialized in different bands of the electromagnetic spectrum with improvements for various resolutions. The WorldView-2 is a high-resolution sensor that has stood out because it offers 8 bands covering the band of visible and near infrared, besides pixels with spatial resolution of the order of 50 cm, with 11 bits of radiometric resolution. In addition to a new
coastal blue band (0.4-0.45 μm), developed for aquatic
ecosystems studies, it has a band in yellow
(0.585-0.625 μm), and one in the red border (0.705-0.745 μm),
both for biophysical vegetation studies (Mutanga et al., 2012; Consoli & Vanella, 2014; Rapinel et al., 2014; Kokaly & Skidmore, 2015; Marshall & Thenkabail, 2015; Hugue et al., 2016).
The objective of this work was to simulate the bands of the WorldView-2 sensor from laboratory specters, in order to study its potential to detect iron oxides, besides proposing a spectral index based on the depth
of the spectral feature (RHGtPf).
Materials and Methods
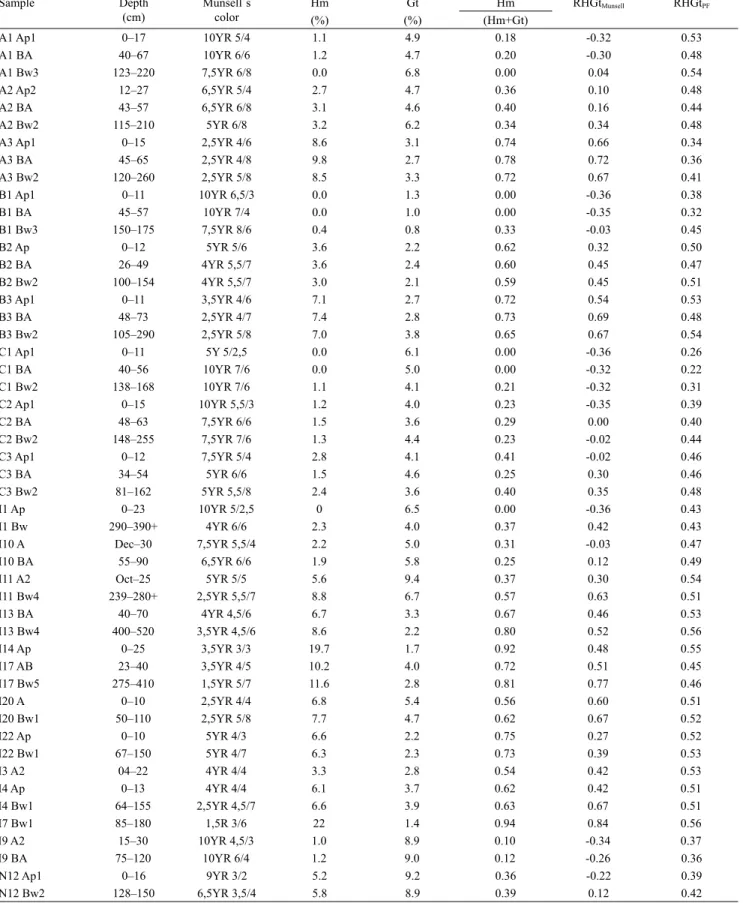
The spectra of 50 samples of Oxisols (A and B horizons with different depths), used in the present work, were extracted from Madeira Netto (1993), in order to analyze the spectral indexes denominated ferric index (IFe) and hematite index (IHm) adapted for the sensor WorldView-2. From the Madeira Netto (1993) data, six spectra of Gleissoles (Table 1) were suppressed.
The spectra were resampled to the bands for the WorldView-2 and the Landsat-TM5 sensors (Table 2),
using the ENVI 5.1 software, and their indices were adapted for the WorldView-2 bands, in order to analyze their potential for the detection of mineralogical
parameters of soils, more specifically the minerals
hematite and goethite. The simulation procedure adopted for sensor systems is based on the detector response functions of each sensor band, and it uses the same calculation procedure presented by Madeira Netto (1993).
The ferric index adapted for the WorldView-2 simulated bands, here called IFe (WVII), which correlates with the Hm / (Hm + Gt) ratio, was tested using two band combinations, one with simulated red bands (simulated WorldView band 5 - SWV5) and green (simulated WorldView band 3 - SWV3), and the other using the bands of yellow (simulated WorldView band 4 - SWV4) and green (SWV3) bands. The result of this index was statistically compared to the same ferric index adapted for the simulated bands, called by Madeira Netto (1993) as IFe (STM), using Landsat-TM5 resampled bands.
The hematite index adapted for the WorldView-2 simulated bands, here called IHm (WVII), which, according to Madeira Netto (1993), represents the percentage of hematite in the sample, was also adapted using two combinations of bands: one with the red (SWV5), blue (simulated WorldView band 2 - SWV2), and green (SWV3) bands, and another with yellow (SWV4), blue (SWV2), and green (SWV3) bands. These results were statistically compared to the IHM (TM5) proposed by Madeira Netto (1993).
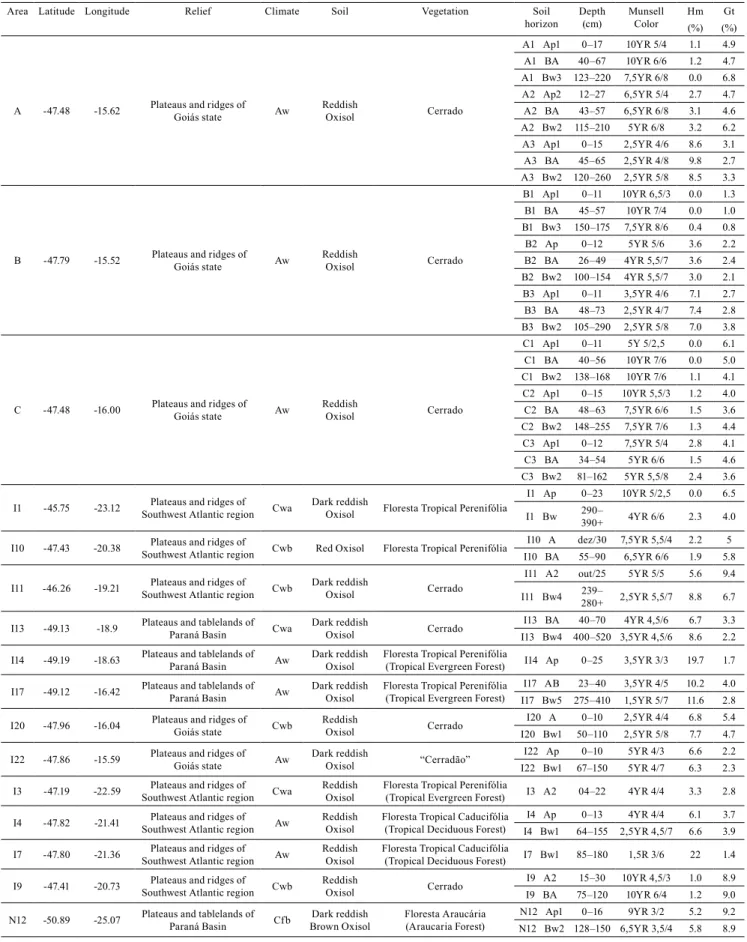
In the resampled spectral bands for the WorldView-2, when the spectral continuum is removed (Figure 1
A), the spectral features of goethite (0.48 μm) and hematite (0.53 μm) are evidenced; this discretion is
not possible when the Landsat-TM5 data are used (Figure 1 B). This discretion becomes possible in the presence of the new bands, mainly the coastal blue
(0.442 μm) and yellow (0.622 μm) ones, which allows
of the differentiation of one feature from the other. It is also noted that the removal of the spectral continuum
generates normalized reflectance values between 0
and 1, which enables the comparison of individual absorption features of the minerals from a common base value (Kokaly & Skidmore, 2015).
Table 1. Sample characteristics.
Area Latitude Longitude Relief Climate Soil Vegetation Soil horizon Depth (cm) Munsell Color Hm Gt (%) (%)
A -47.48 -15.62 Plateaus and ridges of Goiás state Aw
Reddish
Oxisol Cerrado
A1 Ap1 0–17 10YR 5/4 1.1 4.9 A1 BA 40–67 10YR 6/6 1.2 4.7 A1 Bw3 123–220 7,5YR 6/8 0.0 6.8 A2 Ap2 12–27 6,5YR 5/4 2.7 4.7 A2 BA 43–57 6,5YR 6/8 3.1 4.6 A2 Bw2 115–210 5YR 6/8 3.2 6.2 A3 Ap1 0–15 2,5YR 4/6 8.6 3.1 A3 BA 45–65 2,5YR 4/8 9.8 2.7 A3 Bw2 120–260 2,5YR 5/8 8.5 3.3
B -47.79 -15.52 Plateaus and ridges of Goiás state Aw
Reddish
Oxisol Cerrado
B1 Ap1 0–11 10YR 6,5/3 0.0 1.3 B1 BA 45–57 10YR 7/4 0.0 1.0 B1 Bw3 150–175 7,5YR 8/6 0.4 0.8 B2 Ap 0–12 5YR 5/6 3.6 2.2 B2 BA 26–49 4YR 5,5/7 3.6 2.4 B2 Bw2 100–154 4YR 5,5/7 3.0 2.1 B3 Ap1 0–11 3,5YR 4/6 7.1 2.7 B3 BA 48–73 2,5YR 4/7 7.4 2.8 B3 Bw2 105–290 2,5YR 5/8 7.0 3.8
C -47.48 -16.00 Plateaus and ridges of Goiás state Aw
Reddish
Oxisol Cerrado
C1 Ap1 0–11 5Y 5/2,5 0.0 6.1 C1 BA 40–56 10YR 7/6 0.0 5.0 C1 Bw2 138–168 10YR 7/6 1.1 4.1 C2 Ap1 0–15 10YR 5,5/3 1.2 4.0 C2 BA 48–63 7,5YR 6/6 1.5 3.6 C2 Bw2 148–255 7,5YR 7/6 1.3 4.4 C3 Ap1 0–12 7,5YR 5/4 2.8 4.1 C3 BA 34–54 5YR 6/6 1.5 4.6 C3 Bw2 81–162 5YR 5,5/8 2.4 3.6
I1 -45.75 -23.12 Plateaus and ridges of Southwest Atlantic region Cwa
Dark reddish
Oxisol Floresta Tropical Perenifólia
I1 Ap 0–23 10YR 5/2,5 0.0 6.5 I1 Bw 290–
390+ 4YR 6/6 2.3 4.0 I10 -47.43 -20.38 Plateaus and ridges of
Southwest Atlantic region Cwb Red Oxisol Floresta Tropical Perenifólia
I10 A dez/30 7,5YR 5,5/4 2.2 5 I10 BA 55–90 6,5YR 6/6 1.9 5.8
I11 -46.26 -19.21 Plateaus and ridges of Southwest Atlantic region Cwb
Dark reddish
Oxisol Cerrado
I11 A2 out/25 5YR 5/5 5.6 9.4 I11 Bw4 239–
280+ 2,5YR 5,5/7 8.8 6.7 I13 -49.13 -18.9 Plateaus and tablelands of
Paraná Basin Cwa
Dark reddish
Oxisol Cerrado
I13 BA 40–70 4YR 4,5/6 6.7 3.3 I13 Bw4 400–520 3,5YR 4,5/6 8.6 2.2 I14 -49.19 -18.63 Plateaus and tablelands of
Paraná Basin Aw
Dark reddish Oxisol
Floresta Tropical Perenifólia
(Tropical Evergreen Forest) I14 Ap 0–25 3,5YR 3/3 19.7 1.7 I17 -49.12 -16.42 Plateaus and tablelands of
Paraná Basin Aw
Dark reddish Oxisol
Floresta Tropical Perenifólia (Tropical Evergreen Forest)
I17 AB 23–40 3,5YR 4/5 10.2 4.0 I17 Bw5 275–410 1,5YR 5/7 11.6 2.8 I20 -47.96 -16.04 Plateaus and ridges of
Goiás state Cwb
Reddish
Oxisol Cerrado
I20 A 0–10 2,5YR 4/4 6.8 5.4 I20 Bw1 50–110 2,5YR 5/8 7.7 4.7 I22 -47.86 -15.59 Plateaus and ridges of
Goiás state Aw
Dark reddish
Oxisol “Cerradão”
I22 Ap 0–10 5YR 4/3 6.6 2.2 I22 Bw1 67–150 5YR 4/7 6.3 2.3 I3 -47.19 -22.59 Plateaus and ridges of
Southwest Atlantic region Cwa
Reddish Oxisol
Floresta Tropical Perenifólia
(Tropical Evergreen Forest) I3 A2 04–22 4YR 4/4 3.3 2.8 I4 -47.82 -21.41 Plateaus and ridges of
Southwest Atlantic region Aw
Reddish Oxisol
Floresta Tropical Caducifólia (Tropical Deciduous Forest)
I4 Ap 0–13 4YR 4/4 6.1 3.7 I4 Bw1 64–155 2,5YR 4,5/7 6.6 3.9 I7 -47.80 -21.36 Plateaus and ridges of
Southwest Atlantic region Aw
Reddish Oxisol
Floresta Tropical Caducifólia
(Tropical Deciduous Forest) I7 Bw1 85–180 1,5R 3/6 22 1.4 I9 -47.41 -20.73 Plateaus and ridges of
Southwest Atlantic region Cwb
Reddish
Oxisol Cerrado
I9 A2 15–30 10YR 4,5/3 1.0 8.9 I9 BA 75–120 10YR 6/4 1.2 9.0 N12 -50.89 -25.07 Plateaus and tablelands of
Paraná Basin Cf b
Dark reddish Brown Oxisol
Floresta Araucária (Araucaria Forest)
with the content material that generates the feature and, with the removal of the continuum, it is possible to evidence this depth without the interference of the typical concave shape in soil spectra, as well as to normalize any variation found in the measurements.
Based on this assumption, a spectral index was proposed from the depth of the spectral features and
called RHGtPF, or hematite / (hematite + goethite) by
feature depth, which was obtained in a continuum-removed spectra, whose development is detailed in Figure 2. As noted by Baptista (2012), in continuum-removed spectra, the feature depth can be determined
by means of 1 minus the reflectance value in the
spectral feature. Therefore, the RHGtPF index is
defined by: RHGtPF = IHm /(IHm + IGt), in which:
IHm, or hematite content proportional index, is given
by 1 minus the 0.53 μm reflectance value; and IGt, or
goethite content proportional index, is expressed as 1
minus the 0.48 μm reflectance value. Both indices are
obtained in continuum-removed spectra.
The values obtained by means of the RHGtPF index
for the Madeira Netto (1993) spectra were statistically compared with the mineralogical relation Hm/(Hm+Gt) obtained by means of the percentages of each mineral. The index proposed here was also compared with the relation of hematite and goethite obtained by means of the Munsell chart chromatic values, developed by
Santana (1984), here called RHGtMunsell.
Table 2. Spectral behavior of the sensor systems.
Spectral region Simulated band
Landsat-TM5 (µm)
Simulated band
WorldView-2 (µm) Coastal blue - SWV1 0.40–0.45 Blue STM1 0.45–0.52 SWV2 0.45–0.51 Green STM2 0.50–0.60 SWV3 0.51–0.58 Yellow - SWV4 0.585–0.625 Red STM3 0.63–0.69 SWV5 0.63–0.69 Red edge - SWV6 0.705–0.745 NIR (1) STM4 0.76–0.90 SWV7 0.77–0.895 NIR (2) - SWV8 0.86–1.04 SWIR (1) STM5 1.55–1.75 – SWIR (2) STM7 2.08–2.35 –
TIR STM6 10.4–12.5 –
NIR, near infrared; SWIR, shortwave infrared; and TIR, thermal infrared.
Figure 1. Reflectance spectra subjected to the continuum removal and resampled to: A, WorldView-2 bands, showing goethite and hematite spectral features; and B, for Landsat-TM5. Samples are represented by I14 Ap and I7 Bw1 (Table 1).
Figure 2. RHGtPF spectral index showing the proportional
indices of goethite (IGt) and hematite (IHm) contents.
0.90 0.92 0.94 0.96 0.98 1.00
0.49 0.57 0.66 0.84
Reflectance (continuum removed)
Wavelength ( m)
Landsat TM5
I14 Ap
I7 Bw1 B
0.70 0.75 0.80 0.85 0.90 0.95 1.00
0.43 0.48 0.55 0.61 0.66
Reflectance (continuum removed
)
Wavelength ( m)
WorldView - 2
I14 Ap I7 Bw1 Goethite
(0.48m) Hematite (0.53m) A
0.70 0.75 0.80 0.85 0.90 0.95 1.00
0.43 0.48 0.55 0.61 0.66
Reflectance (continuum removed)
Wavelength (m)
WorldView - 2
C1 Ap1
I7 Bw1 % Hm = 0.0 % Gt = 6.1
% Hm = 22.0 % Gt = 1.4 IGt
The data normality was tested using the Shapiro-Wilk
method (n=50); the Pearson correlation coefficient (r)
was adjusted for parametric data and the Kendall’s tau
(τ), for the nonparametric data. The similarity between
the results of both indices, and the mineralogical relationships obtained by the percentages, as well as
the Munsell chart chromatic values, were verified by
means of the Z-test for the parametric data, and by the
the Mann-Whitney U-test for the nonparametric ones.
Results and Discussion
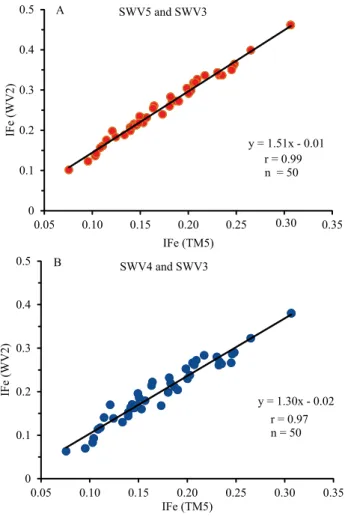
The ferric index results, obtained for both the simulated Landsat-TM5 [IFe(STM)] and WorldView-2 simulated [IFe(WVII)] bands (Table 3), were calculated with the red (SWV5) and the green (SWV2) bands (Figure 3 A), as well as with the yellow (SWV3) and green (SWV2) (Figure 3 B) bands.
The analyses show that, with the use of the yellow band (SWV3) in the ferric index, the correlation with IFe(TM5) degrades by only 2%, compared to the one obtained with the red band (SWV5). Even so, IFe obtained either with SWV3 or SWV5 are highly correlated with IFe(TM5). The Pearson correlation was had a very strong result for the two bands with the IFe(TM5); however, with the red band (r = 0.99), it was somewhat higher, compared to that obtained with the IFe calculated with the yellow band (r = 0.97).
In both ferric indices calculated with the WorldView-2 simulated bands, the means were different from those obtained by the index calculated from the Landsat-TM5 simulation data; therefore, when the parametric Z-test was calculated, as the samples were adjusted to normal, the null hypothesis was rejected, despite the high correlation between data. As these indices are proportional, when the linear regression was performed with the mineralogical data, the values of the relation could be attributed by the adjusted model.
The hematite index – IHm (WVII) calculated with the red (SWV5), blue (SWV2), and green (SWV3) bands (Figure 4 A), as well as with that of the yellow (SWV3) in place of red band (Figure 4 B) were compared with IHm (STM) (Table 4).
However, unlike the IFe, the normality adjustment of IHm data rejected the null hypothesis; therefore, the analyses were based on nonparametric tests. The
Kendall correlation coefficient was also high, but the
IHm obtained with the red band showed a greater
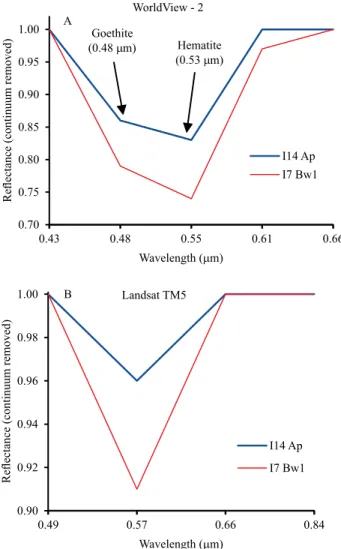
Table 3. Result of the ferric index obtained for the simulated bands of Landsat-TM5 [IFe(STM)] and for the WorldView-2 [IFe(WVII)].
Sample IFe(STM) IFe(WVII)
SWV5 and SWV3 SWV4 and SWV3 A1 Ap1 0.18 0.27 0.22
A1 BA 0.31 0.46 0.38
A1 Bw3 0.23 0.34 0.27 A2 Ap2 0.14 0.21 0.16
A2 BA 0.21 0.33 0.27
A2 Bw2 0.21 0.32 0.27 A3 Ap1 0.11 0.16 0.12
A3 BA 0.15 0.23 0.19
A3 Bw2 0.15 0.23 0.20 B1 Ap1 0.10 0.14 0.08
B1 BA 0.13 0.19 0.13
B1 Bw3 0.15 0.22 0.16
B2 Ap 0.19 0.27 0.21
B2 BA 0.27 0.40 0.32
B2 Bw2 0.25 0.36 0.29 B3 Ap1 0.20 0.30 0.24
B3 BA 0.31 0.46 0.38
B3 Bw2 0.25 0.36 0.29 C1 Ap1 0.08 0.10 0.06
C1 BA 0.14 0.21 0.15
C1 Bw2 0.12 0.20 0.17 C2 Ap1 0.11 0.16 0.11
C2 BA 0.18 0.28 0.23
C2 Bw2 0.16 0.26 0.22 C3 Ap1 0.12 0.18 0.14
C3 BA 0.21 0.32 0.26
C3 Bw2 0.20 0.30 0.25
I10 A 0.14 0.20 0.14
I10 BA 0.14 0.22 0.17 I11 A2 0.16 0.23 0.18 I11 Bw4 0.22 0.34 0.28 I13 BA 0.20 0.29 0.23 I13 Bw4 0.23 0.34 0.26 I14 Ap 0.13 0.19 0.15 I17 AB 0.18 0.26 0.20 I17 Bw5 0.24 0.34 0.26
I1 Ap 0.10 0.12 0.07
I1 Bw 0.16 0.25 0.21
I20 A 0.14 0.21 0.16
I20 Bw1 0.23 0.34 0.28 I22 Ap 0.19 0.27 0.20 I22 Bw1 0.25 0.35 0.27
I3 A2 0.17 0.24 0.17
I4 Ap 0.15 0.21 0.16
I4 Bw1 0.15 0.22 0.17 I7 Bw1 0.19 0.27 0.21
I9 A2 0.10 0.14 0.09
I9 BA 0.11 0.18 0.14
result (τ = 0.87), in comparison to that obtained with the yellow band (τ = 0.76).
The results with the two indexes proposed by Madeira Netto (1993) showed that the relation shows a very good response when calculated with the yellow band; however, such relation is lower than the obtained with the indices calculated with the red band, which was the original proposition of Madeira Netto (1993). This can be attributed to the fact that, in the analysis of the mineralogical relations evaluated by means of sensor systems, imagers or not, the proportionality between the contents is related to spectral feature depths (Baptista et
al., 2011) and not to reflectance peaks.
The spectral features that best separate these iron
oxides occur for goethite at 0.48 μm, in the blue region,
and for hematite at 0.53 μm at green region (Figure 1 A). The band presence that captures the reflection in the
yellow region allows of a better visualization of the
soil hue, and it does not generate a significant increase in its identification. This can be confirmed by study of
Balena et al. (2011), who compared data obtained with
a portable field spectroradiometer, by covering the
visible band with other methods of analysis of electron
paramagnetic resonance (EPR) and diffuse reflectance in ultraviolet-visible (DRUV-VIS) spectroscopy of
intensely weathered soils which are rich in iron oxides. These authors also observed two distinguishing
features of iron oxides, more specifically goethite and hematite, centered at 0.485 and 0.532 μm.
Figure 3. Pearson correlation coefficients of the ferric index results, obtained by the simulated bands for the Landsat-TM5 and WorldView-2 sensors, as follows: A, calculated with SWV5 (red) and SWV3 (green) bands; and B, calculated with SWV4 (yellow) and SWV3 (green) bands.
Figure 4. Kendall correlation coefficients of the hematite index results, obtained by the simulated bands for the Landsat-TM5 and WorldView-2 sensors, as follows: A, calculated with SWV5 (red), SWV2 (blue), and SWV3 (green) bands; and B, calculated with SWV4 (yellow), SWV2 (blue), and SWV3 (green) bands.
y = 1.51x - 0.01 r = 0.99 n = 50
0 0.1 0.2 0.3 0.4 0.5
0.05 0.10 0.15 0.20 0.25 0.30 0.35
IFe (WV2)
IFe (TM5)
SWV5 and SWV3
y = 1.30x - 0.02 r = 0.97 n = 50
0 0.1 0.2 0.3 0.4 0.5
0.05 0.10 0.15 0.20 0.25 0.30 0.35
IFe (WV2)
IFe (TM5)
SWV4 and SWV3
A
B
y = 2.9908x - 18.195
τ= 0.87
n = 50
0 100 200 300 400 500 600
0 50 100 150 200
IHm (WV2)
IHm (TM5)
SWV5, SWV2, and SWV3
y = 0.227x + 4.057 τ = 0.76
0 5 10 15 20 25 30 35 40 45
0 50 100 150 200
IHm (WV2)
IHm (TM5)
SWV4, SWV2, and SWV3
A
B
Several studies on the identification of mineralogical
relationships obtained by spectral indices report good statistical results, as well as those observed in the present work with the WorldView-2 data. Alves et al. (2015) performed a conventional pedological mapping and, later on, using the classes found and the spectral data and images of Landsat-TM5, they obtained 79% accuracy by the estimation of iron oxides. Bahia et al. (2015) estimated the hematite and goethite content of Oxisols in São Paulo state, Brazil, and found 99 and 79% accuracy, respectively, using X-ray diffractometry
and diffuse spectral reflectance. Cezar et al. (2013) found the determination coefficient of 0.99 between the synthetic hematite content and their reflectance factor.
Other authors have verified mineralogical
relationships between iron oxides and isolated bands. Demattê et al. (2004) also observed the relationships between soil mineralogical components and the Landsat-TM sensor isolated bands; they also found negative correlations between iron oxides and the
first three bands of the visible region (r = -0.71, -0.69,
and -0.64 for bands 1, 2, and 3, respectively). Nanni
& Demattê (2006) determined a coefficient of 0.88
by multiple regression with the bands of the visible Landsat TM-5.
As to hyperspectral data, the study by Baptista et al. (2011) stands out for showing a linear regression of the kaolinite/(kaolinite+gibbsite) mineralogical relationships, which was achieved by both the AVIRIS sensor data and the thermogravimetric data obtained
in the laboratory with 0.75 determination coefficient.
The RHGtPF index, that is based on the mineral
absorption features depth measured on continuum-removed spectra, was resampled for the WorldView-2 bands, which enabled the analisys of hematite and goethite as distinct features due to the new coastal blue and yellow bands.
When RHGtPF index was applied to the 50 resampled
spectra and compared with the Hm/(Hm+Gt) ratio obtained by chemical analysis, as well as by the ratio between the chromatic components of Munsell soil chart (Table 5), they did not adjust to normality by means of the Shapiro-Wilk test. For this reason, nonparametric tests were used for the correlation analysis, as well as for the hypothesis tests.
The Kendall coefficient (τ) was 0.40 for the relation
between RHGtPF and Hm/(Hm+Gt), and 0.38 for the
relationship between RHGtPF and RHGtMunsell. The
Table 4. Result of the hematite index obtained for the simulated bands of Landsat-TM5 [IHm(STM)] and for the WorldView-2 [IHm(WVII)].
Sample IHm (STM) IHm(WVII) SWV5, SWV2,
and SWV3
SWV4, SWV2, and SWV3 A1 Ap1 17.36 30.72 8.03 A1 BA 168.84 524.65 36.52 A1 Bw3 38.69 77.31 15.90 A2 Ap2 13.78 21.21 8.05 A2 BA 37.14 82.40 11.87 A2 Bw2 9.46 19.93 3.39 A3 Ap1 6.51 9.08 4.15 A3 BA 14.08 24.45 6.13 A3 Bw2 9.55 16.79 4.17 B1 Ap1 3.62 4.51 2.85
B1 BA 6.29 9.12 3.65
B1 Bw3 2.79 4.30 1.49 B2 Ap 12.17 21.30 5.79 B2 BA 59.45 151.77 16.10 B2 Bw2 12.40 27.28 4.26 B3 Ap1 18.03 33.50 8.01 B3 BA 137.98 424.06 30.58 B3 Bw2 27.76 58.33 10.64 C1 Ap1 11.52 13.72 9.81 C1 BA 14.39 23.11 7.05 C1 Bw2 2.92 4.91 1.28 C2 Ap1 6.66 9.11 4.50 C2 BA 22.56 45.08 7.98 C2 Bw2 11.54 21.79 4.66 C3 Ap1 8.33 12.07 5.19 C3 BA 25.96 54.91 8.96 C3 Bw2 7.69 15.46 2.90
I10 A 6.22 9.17 3.73
I10 BA 4.90 7.85 2.49 I11 A2 11.61 18.76 6.14 I11 Bw4 7.76 17.15 2.53 I13 BA 20.61 37.15 9.39 I13 Bw4 84.48 169.52 33.49 I14 Ap 18.03 25.59 10.78 I17 AB 18.75 31.03 9.93 I17 Bw5 33.95 66.17 14.19 I1 Ap 13.80 16.57 12.36
I1 Bw 4.70 8.53 1.97
I20 A 11.39 17.42 6.59 I20 Bw1 12.83 27.21 4.76 I22 Ap 14.44 24.51 7.61 I22 Bw1 15.83 31.96 6.76 I3 A2 11.23 17.19 7.10 I4 Ap 12.19 18.53 7.01 I4 Bw1 37.28 57.82 21.15 I7 Bw1 25.92 43.13 12.92
I9 A2 6.63 8.50 5.09
I9 BA 6.24 9.32 3.49
Table 5. Result of the RHGtPF index compared to the hematite / goethite ratio obtained with chemical analysis, as well as
through the relationships between the chromatic components of the Munsell´s soil chart.
Sample Depth (cm)
Munsell´s color
Hm Gt Hm RHGtMunsell RHGtPF
(%) (%) (Hm+Gt)
A1 Ap1 0–17 10YR 5/4 1.1 4.9 0.18 -0.32 0.53
A1 BA 40–67 10YR 6/6 1.2 4.7 0.20 -0.30 0.48
A1 Bw3 123–220 7,5YR 6/8 0.0 6.8 0.00 0.04 0.54
A2 Ap2 12–27 6,5YR 5/4 2.7 4.7 0.36 0.10 0.48
A2 BA 43–57 6,5YR 6/8 3.1 4.6 0.40 0.16 0.44
A2 Bw2 115–210 5YR 6/8 3.2 6.2 0.34 0.34 0.48
A3 Ap1 0–15 2,5YR 4/6 8.6 3.1 0.74 0.66 0.34
A3 BA 45–65 2,5YR 4/8 9.8 2.7 0.78 0.72 0.36
A3 Bw2 120–260 2,5YR 5/8 8.5 3.3 0.72 0.67 0.41
B1 Ap1 0–11 10YR 6,5/3 0.0 1.3 0.00 -0.36 0.38
B1 BA 45–57 10YR 7/4 0.0 1.0 0.00 -0.35 0.32
B1 Bw3 150–175 7,5YR 8/6 0.4 0.8 0.33 -0.03 0.45
B2 Ap 0–12 5YR 5/6 3.6 2.2 0.62 0.32 0.50
B2 BA 26–49 4YR 5,5/7 3.6 2.4 0.60 0.45 0.47
B2 Bw2 100–154 4YR 5,5/7 3.0 2.1 0.59 0.45 0.51
B3 Ap1 0–11 3,5YR 4/6 7.1 2.7 0.72 0.54 0.53
B3 BA 48–73 2,5YR 4/7 7.4 2.8 0.73 0.69 0.48
B3 Bw2 105–290 2,5YR 5/8 7.0 3.8 0.65 0.67 0.54
C1 Ap1 0–11 5Y 5/2,5 0.0 6.1 0.00 -0.36 0.26
C1 BA 40–56 10YR 7/6 0.0 5.0 0.00 -0.32 0.22
C1 Bw2 138–168 10YR 7/6 1.1 4.1 0.21 -0.32 0.31
C2 Ap1 0–15 10YR 5,5/3 1.2 4.0 0.23 -0.35 0.39
C2 BA 48–63 7,5YR 6/6 1.5 3.6 0.29 0.00 0.40
C2 Bw2 148–255 7,5YR 7/6 1.3 4.4 0.23 -0.02 0.44
C3 Ap1 0–12 7,5YR 5/4 2.8 4.1 0.41 -0.02 0.46
C3 BA 34–54 5YR 6/6 1.5 4.6 0.25 0.30 0.46
C3 Bw2 81–162 5YR 5,5/8 2.4 3.6 0.40 0.35 0.48
I1 Ap 0–23 10YR 5/2,5 0 6.5 0.00 -0.36 0.43
I1 Bw 290–390+ 4YR 6/6 2.3 4.0 0.37 0.42 0.43
I10 A Dec–30 7,5YR 5,5/4 2.2 5.0 0.31 -0.03 0.47
I10 BA 55–90 6,5YR 6/6 1.9 5.8 0.25 0.12 0.49
I11 A2 Oct–25 5YR 5/5 5.6 9.4 0.37 0.30 0.54
I11 Bw4 239–280+ 2,5YR 5,5/7 8.8 6.7 0.57 0.63 0.51
I13 BA 40–70 4YR 4,5/6 6.7 3.3 0.67 0.46 0.53
I13 Bw4 400–520 3,5YR 4,5/6 8.6 2.2 0.80 0.52 0.56
I14 Ap 0–25 3,5YR 3/3 19.7 1.7 0.92 0.48 0.55
I17 AB 23–40 3,5YR 4/5 10.2 4.0 0.72 0.51 0.45
I17 Bw5 275–410 1,5YR 5/7 11.6 2.8 0.81 0.77 0.46
I20 A 0–10 2,5YR 4/4 6.8 5.4 0.56 0.60 0.51
I20 Bw1 50–110 2,5YR 5/8 7.7 4.7 0.62 0.67 0.52
I22 Ap 0–10 5YR 4/3 6.6 2.2 0.75 0.27 0.52
I22 Bw1 67–150 5YR 4/7 6.3 2.3 0.73 0.39 0.53
I3 A2 04–22 4YR 4/4 3.3 2.8 0.54 0.42 0.53
I4 Ap 0–13 4YR 4/4 6.1 3.7 0.62 0.42 0.51
I4 Bw1 64–155 2,5YR 4,5/7 6.6 3.9 0.63 0.67 0.51
I7 Bw1 85–180 1,5R 3/6 22 1.4 0.94 0.84 0.56
I9 A2 15–30 10YR 4,5/3 1.0 8.9 0.10 -0.34 0.37
I9 BA 75–120 10YR 6/4 1.2 9.0 0.12 -0.26 0.36
N12 Ap1 0–16 9YR 3/2 5.2 9.2 0.36 -0.22 0.39
Mann-Whitney’s test showed that there was a statistical
similarity between RHGtPF and Hm/(Hm+Gt). However,
as the null hypothesis was rejected, there was no
similarity between RHGtPF and RHGtMunsell. Data were
polynomially related, with determination coefficients
of 0.40 and 0.47, for RHGtPF and Hm/(Hm+Gt), and
RHGtPF and RHGtMunsell ratios, respectively.
According to Vivaldi et al. (2013), in the
Mann-Whitney´s U-test, the calculated values allow to
estimate the relationships between data of the two sample spaces after the rank. In the relationships
between RHGtPF and RHGtMunsell, the greater separation
between data, when they grouped, indicates that the samples are distinct, which led to the rejection of the hypothesis of the equality of the medians.
The results of the RHGtPF index showed a regular
positive correlation both with Hm/(Hm+Gt) and with RHGtMunsell, which was also verified in other studies
using remote sensing data. Almeida et al. (2016) have not obtained good results too, when comparing the RHGtMunsell with the RHGtscale, proposed by Baptista
(2001), and obtained from the use of the spectral feature
fitting algorithm on Hyperion sensor data. This fact
can be attributed to the oscillation that the RHGtMunsell
showed in a transect starting from a predominantly goethitic soil towards a hematitic soil, and it may probably be related to the observer’s accuracy in determining Munsell’s chromatic components. As
noted above, the quantification of the Hm/(Hm+Gt)
ratio depends on mineral absorption features, and the
Munsell´s color ratio is derived from its reflectance,
that is, the way the color is observed by the human eye. Botelho et al. (2006) compared the Munsell’s soil chart components, hue, value, and chroma, and the colorimeter found respectively 0.93, 0.97 and 0.94 as
determination coefficients.
Campos et al. (2010) analyzed the red index based on the Munsell’s system, as hematite content, and observed
a high-determination coefficient (R2 = 0.76). These
authors also used the CIE (International Commission on Illumination) component system, and when comparing
the hematite content, they found a R2 of 0.96.
Fernandes et al. (2004) studied three relationships between the hematite content and the red index, described by Torrent et al. (1980), and the red factor
described by Santana (1984), and observed R2 of 0.79,
0.86 and 0.86, respectively. These two indices are related to the hematite content, that is, only with the red color.
When the Mann-Whitney test rejects the hypothesis of the equality of medians, it indicates that the samples are distinct and have different medians, generating a result of these comparative relations that is considered inadequate (Vivaldi et al., 2013). However, it is important to note that remote sensing data are intended to generate digital data similar to that observed by
human eyes (Vivaldi et al., 2013). As the RHGtMunsell
relation is based on the chromatic components of the soil, according to Vivaldi et al. (2013), the visual analysis has a predominance over the results of the statistical analysis.
Conclusions
1. The WorldView-2 multispectral data enable the detection of hematite and goethite iron oxides, both by ferric and hematite indices.
2. The implementation of the new coastal blue and yellow bands allows the separation of spectral features
of goethite, centered at 0.48 μm, and hematite, at 0.53 μm; such a separation was impossible before, with
other multispectral data.
3. The proposition of the RHGtPF spectral index
based on the spectral feature depth makes it possible to
discretize the hematite/goethite ratio in the reflectance
spectra.
Acknowledgment
To Coordenação de Aperfeiçoamento de Pessoal de Nível Superior (Capes), for the scholarship granted.
References
AHMAD, L.; SHAH, M.T.; KHAN, S.D. Reflectance spectroscopy and remote sensing data for finding sulfide-bearing alteration zones
and mapping geology in Gilgit-Baltistan, Pakistan. Earth Science
Informatics, v.9, p.113-121, 2016. DOI: 10.1007/s12145-015-0239-x.
ALMEIDA, C.D.S. de; BAPTISTA, G.M. de M.; ALMEIDA, T. de. Espacialização de sesquióxidos de ferro (goethita e hematita) em mancha de solo exposto por meio de sensoriamento remoto hiperespectral. Revista Brasileira de Geomática, v.4, p.81-88, 2016. ALVES, M.R.; DEMATTÊ, J.A.M.; BARROS, P.P.S. Multiple geotechnological tools applied to digital mapping of tropical soils.
Revista Brasileira de Ciência do Solo, v.39, p.1261-1274, 2015.
DOI: 10.1590/01000683rbcs20140410.
hematite and goethite in Oxisols of São Paulo, Brazil. Geoderma
Regional, v.5, p.150-156, 2015. DOI: 10.1016/j.geodrs.2015.04.006.
BALENA, S.P.; MESSERSCHMIDT, I.; TOMAZONI, J.C.;
GUIMARÃES, E.; PEREIRA, B.F.; PONZONI, F.J.; BLUM, W.E.H.; MANGRICH, A.S. Use of Fe3+ ion probe to study intensively weathered soils utilizing electron paramagnetic resonance and optical spectroscopy. Journal of the Brazilian
Chemical Society, v.22, p.1788-1794, 2011. DOI:
10.1590/S0103-50532011000900023.
BAPTISTA, G.M.M. Mapeamento e quantificação da relação
caulinita/(caulinita+gibbsita) de solos tropicais, por meio
dos dados do sensor AVIRIS (JPL/NASA). 2001. 278p. Tese
(Doutorado) – Instituto de Geociências Aplicadas, Universidade
de Brasília, Brasília.
BAPTISTA, G.M.M. Processamento de dados hiperespectrais. In: MENESES, P.R.; ALMEIDA, T. de (Org.). Introdução ao
processamento de imagens de sensoriamento remoto. Brasília:
UnB: CNPq, 2012. p.221-238.
BAPTISTA, G.M.M.; CORRÊA, R.S.; SANTOS, P.F. dos;
MADEIRA NETTO, J.S.; MENESES, P.R. Use of imaging
spectroscopy for mapping and quantifying the weathering degree of tropical soils in Central Brazil. Applied and Environmental
Soil Science, v.2011, article ID 641328, 2011. 7p. DOI:
10.1155/2011/641328.
BARBOSA, I.O.; LACERDA, M.P.C.; BILICH, M.R. Relações pedomorfogeológicas nas chapadas elevadas do Distrito Federal.
Revista Brasileira de Ciência do Solo, v.33, p.1373-1383, 2009.
DOI: 10.1590/S0100-06832009000500029.
BOTELHO, M.R.; DALMOLIN, R.S.D.; PEDRON, F. de A.;
AZEVEDO, A.C. de; RODRIGUES, R.B.; MIGUEL, P. Medida
da cor em solos do Rio Grande do Sul com a carta de Munsell e por colorimetria. Ciência Rural, v.36, p.1179-1185, 2006. DOI: 10.1590/S0103-84782006000400021.
CAMARGO, L.A.; MARQUES JÚNIOR, J.; PEREIRA, G.T.;
BAHIA, A.S.R. de S. Clay mineralogy and magnetic susceptibility of Oxisols in geomorphic surfaces. Scientia Agricola, v.71, p.244-256, 2014. DOI: 10.1590/S0103-90162014000300010.
CAMARGO, L.A.; MARQUES JÚNIOR, J.; PEREIRA, G.T.;
HORVAT, R.A. Variabilidade espacial de atributos mineralógicos de um Latossolo sob diferentes formas do relevo. I - Mineralogia da fração argila. Revista Brasileira de Ciência do Solo, v.32, p.2269-2277, 2008. DOI: 10.1590/S0100-06832008000600006. CAMPOS, P.M.; LACERDA, M.P.C.; SILVA, C.L. da; SÁ,
M.A.C. de; SOUSA, D.M.G. de. Drenagem interna como fator
de diferenciação de Latossolos do Distrito Federal. Pesquisa
Agropecuária Brasileira, v.45, p.306-314, 2010. DOI: 10.1590/
S0100-204X2010000300011.
CEZAR, E.; NANNI, M.R.; CHICATI, M.L.; SOUZA JÚNIOR, I.G. de; COSTA, A.C.S. da. Uso de dados espectrais para estimar
a relação entre óxidos de ferro e minerais 2:1 com suas respectivas
reflectâncias. Semina: Ciências Agrárias, v.34, p.1479-1492, 2013. DOI: 10.5433/1679-0359.2013v34n4p1479.
CONSOLI, S.; VANELLA, D. Mapping crop evapotranspiration by integrating vegetation indices into a soil water balance model.
Agricultural Water Management, v.143, p.71-81, 2014. DOI:
10.1016/j.agwat.2014.06.012.
CORREA, M.M.; KER, J.C.; BARRÓN, V.; FONTES, M.P.F.;
TORRENT, J.; CURI, N. Caracterização de óxidos de ferro de
solos do ambiente Tabuleiros Costeiros. Revista Brasileira de
Ciência do Solo, v.32, p.1017-1031, 2008. DOI:
10.1590/S0100-06832008000300011.
DALMOLIN, R.S.D.; GONÇALVES, C.N.; KLAMT, E.; DICK, D.P. Relação entre os constituintes do solo e seu comportamento espectral. Ciência Rural, v.35, p.481-489, 2005. DOI: 10.1590/ S0103-84782005000200042.
DEMATTÊ, J.A.M.; TOLEDO, A.M.A.; SIMÕES, M.S. Metodologia para reconhecimento de três solos por sensores: laboratorial e orbital. Revista Brasileira de Ciência do Solo, v.28, p.877-889, 2004. DOI: 10.1590/S0100-06832004000500010. FERNANDES, R.B.A.; BARRÓN, V.; TORRENT, J.; FONTES,
M.P.F. Quantificação de óxidos de ferro de Latossolos brasileiros por espectroscopia de refletância difusa. Revista Brasileira de
Ciência do Solo, v.28, p.245-257, 2004. DOI:
10.1590/S0100-06832004000200003.
GENÚ, A.M.; DEMATTÊ, J.A.M. Prediction of soil chemical
attributes using optical remote sensing. Acta Scientiarum.
Agronomy, v.33, p.723-727, 2011. DOI: 10.4025/actasciagron.
v33i4.7975.
GERIGHAUSEN, H.; MENZ, G.; KAUFMANN, H. Spatially
explicit estimation of clay and organic carbon content in agricultural soils using multi-annual imaging spectroscopy data.
Applied and Environmental Soil Science, v.2012, article ID
868090, 2012. 23p. DOI: 10.1155/2012/868090.
HUGUE, F.; LAPOINTE, M.; EATON, B.C.; LEPOUTRE, A.
Satellite-based remote sensing of running water habitats at large riverscape scales: tools to analyze habitat heterogeneity for river ecosystem management. Geomorphology, v.253, p.353-369, 2016. DOI: 10.1016/j.geomorph.2015.10.025.
INDA JUNIOR, A.V.; KÄMPF, N. Variabilidade de goethita e
hematita via dissolução redutiva em solos de região tropical e subtropical. Revista Brasileira de Ciência do Solo, v.29, p.851-866, 2005. DOI: 10.1590/S0100-06832005000600003.
KOKALY, R.F.; SKIDMORE, A.K. Plant phenolics and
absorption features in vegetation reflectance spectra near 1.66
µm. International Journal of Applied Earth Observation
and Geoinformation, v.43, p.55-83, 2015. DOI: 10.1016/j.
jag.2015.01.010.
LAGACHERIE, P.; BARET, F.; FERET, J.-B.; MADEIRA NETTO, J.S.; ROBBEZ-MASSON, J.M. Estimation of soil
clay and calcium carbonate using laboratory, field and airborne
hyperspectral measurements. Remote Sensing of Environment, v.112, p.825-835, 2008. DOI: 10.1016/j.rse.2007.06.014.
MADEIRA NETTO, J. da S. Étude quantitative des relations
constituants minéralogiques – réflectance diffuse des latosols
brésiliens: application à l’utilisation pédologique des données
WorldView-2, Landsat ETM+, and MODIS vegetation indices in crop biomass estimation. ISPRS Journal of Photogrammetry
and Remote Sensing, v.108, p.205-218, 2015. DOI: 10.1016/j.
isprsjprs.2015.08.001.
MUTANGA, O.; ADAM, E.; CHO, M.A. High density biomass
estimation for wetland vegetation using WorldView-2 imagery and random forest regression algorithm. International Journal
of Applied Earth Observation and Geoinformation, v.18,
p.399-406, 2012. DOI: 10.1016/j.jag.2012.03.012.
NANNI, M.R.; DEMATTÊ, J.A.M. Comportamento da linha do solo obtida por espectrorradiometria laboratorial para diferentes classes de solo. Revista Brasileira de Ciência do Solo, v.30, p.1031-1038, 2006. DOI: 10.1590/S0100-06832006000600012. RAPINEL, S.; CLÉMENT, B.; MAGNANON, S.; SELLIN,
V.; HUBERT-MOY, L. Identification and mapping of natural
vegetation on a coastal site using a Worldview-2 satellite image.
Journal of Environmental Management, v.144, p.236-246,
2014. DOI: 10.1016/j.jenvman.2014.05.027.
REATTO, A.; BRUAND, A.; MARTINS, E. de S.; MULLER,
F.; SILVA, E.M. da; CARVALHO JR., O.A. de; BROSSARD, M. Variation of the kaolinite and gibbsite content at regional and local scale in Latosols of the Brazilian Central Plateau. Comptes
Rendus Geoscience, v.340, p.741-748, 2008. DOI: 10.1016/j.
crte.2008.07.006.
SANTANA, D.P. Soil formation in a toposequence of Oxisols
from Patos de Minas region, Minas Gerais state, Brazil. 1984.
129p. Thesis (PhD) – Purdue University, West Lafayette.
SCHAEFER, C.E.G.R.; FABRIS, J.D.; KER, J.C. Minerals in the clay fraction of Brazilian Latosols (Oxisols): a
review. Clay Minerals, v.43, p.137-154, 2008. DOI: 10.1180/ claymin.2008.043.1.11.
SHERMAN, D.M.; WAITE, T.D. Electronic spectra of Fe3+
oxides and oxide hydroxides in the near IR to near UV. American
Mineralogist, v.70, p.1262-1269, 1985.
SILVA JUNIOR, J.F. da; MARQUES JÚNIOR, J.; CAMARGO,
L.A.; TEIXEIRA, D. de B.; PANOSSO, A.R.; PEREIRA, G.T. Simulação geoestatística na caracterização espacial de óxidos de ferro em diferentes pedoformas. Revista Brasileira de
Ciência do Solo, v.36, p.1690-1703, 2012. DOI:
10.1590/S0100-06832012000600003.
SOUSA JUNIOR, J.G. de A.; DEMATTÊ, J.A.M.; GENÚ, A.M.
Comportamento espectral dos solos na paisagem a partir de dados coletados por sensores terrestre e orbital. Revista Brasileira de
Ciência do Solo, v.32, p.727-738, 2008. DOI:
10.1590/S0100-06832008000200027.
SOUSA JUNIOR, J.G.; DEMATTÊ, J.A.M.; ARAÚJO, S.R.
Modelos espectrais terrestres e orbitais na determinação de teores de atributos dos solos: potencial e custos. Bragantia, v.70, p.610-621, 2011. DOI: 10.1590/S0006-87052011000300017.
TORRENT, J.; SCHWERTMANN, U.; SCHULZE, D.G. Iron
oxide mineralogy of some soils of two river terrace sequences in Spain. Geoderma, v.23, p.191-208, 1980.
VIVALDI, D.D.; BAPTISTA, G.M. de M.; MENESES, P.R. Avaliação dos processamentos de crosstalk e de correção
atmosférica em dados ASTER para identificação da relação
mineralógica caulinita/(caulinita + gibbsita) em solos no município de São João d’Aliança (GO). Brazilian Journal of Geology, v.43, p.571-582, 2013. DOI: 10.5327/Z2317-48892013000300011.
![Table 3. Result of the ferric index obtained for the simulated bands of Landsat-TM5 [IFe(STM)] and for the WorldView-2 [IFe(WVII)].](https://thumb-eu.123doks.com/thumbv2/123dok_br/16668116.742576/6.914.469.830.172.1074/table-result-ferric-index-obtained-simulated-landsat-worldview.webp)