DOI: http://dx.doi.org/10.1590/2446-4740.00218 Volume 34, Number 2, p. 147-156, 2018
Introduction
It has long been known that delivering heat to tumoral tissues can be an efficient ally to combat cancer (Crile, 1961). For example, increasing tissue temperature in the range 42-45oC (hyperthermia) can improve chemotherapy and radiotherapy efficacy (Goldberg et al., 2000; Wust et al., 2002). Furthermore, the so-called local thermotherapy consists in providing heat to precise locations within tissues, to increase temperature in the range 50-100oC, killing cancer cells by thermal ablation and preserving healthy tissues (Goldberg et al., 2000).
Most of the thermotherapy techniques consist in delivering heat to superficial tumors by placing antennas in contact with its surface to emit microwaves or radiowaves, heating the area through radiation absorption (Wust et al., 2002). However, other methods have been developed such as photothermal therapy (Steger et al., 1989), high intensity focused ultrasound (Crouzet et al., 2010) and magnetic hyperthermia (Pankhurst et al., 2003).
Temperature monitoring and application time are crucial steps in thermal therapy and have to ensure safety limits of delivered heat, minimizing damages in healthy tissue and increasing control, efficacy, and safety of applications (Larina et al., 2005; Welch and van Gemert, 2011). Researchers have demonstrated temperature dependence of acoustic wave propagation speed (Nasoni et al., 1979) and, based on this idea, several studies using ultrasound imaging to monitor
temperature were conducted in the 90’s (Maass-Moreno
and Damianou, 1996a; Maass-Moreno et al., 1996b; Simon et al., 1998; Straube and Arthur, 1994; Ueno et al., 1990), generally using speckle tracking algorithms to calculate echo-shifts in the ultrasound images (Seo et al.,
Photoacoustic-based thermal image formation and optimization using
an evolutionary genetic algorithm
João Henrique Uliana
1, Diego Ronaldo Thomaz Sampaio
1, Antonio Adilton Oliveira Carneiro
1,
Theo Zeferino Pavan
1*
1Department of Physics, Faculty of Philosophy, Science and Letters of Ribeirão Preto, University of São Paulo, Ribeirão Preto, SP,
Brazil.
Abstract Introduction: For improved efficiency and security in heat application during hyperthermia, it is important to monitor tissue temperature during treatments. Photoacoustic (PA) pressure wave amplitude has a temperature dependence given by the Gruenesein parameter. Consequently, changes in PA signal amplitude carry information about temperature variation in tissue. Therefore, PA has been proposed as an imaging technique to monitor temperature during hyperthermia. However, no studies have compared the performance of different algorithms to generate PA-based thermal images. Methods: Here, four methods to estimate variations in PA signal amplitude for thermal image formation were investigated: peak-to-peak, integral of the modulus, autocorrelation of the maximum value, and energy of the signal. Changes in PA signal amplitude were evaluated using a 1-D window moving across the entire image. PA images were acquired for temperatures ranging from 36oC to 41oC using a phantom immersed in
a temperature controlled thermal bath. Results: The results demonstrated that imaging processing parameters and methods involved in tracking variations in PA signal amplitude drastically affected the sensitivity and accuracy of thermal images formation. The sensitivity fluctuated more than 20% across the different methods and parameters used. After optimizing the parameters to generate the thermal images using an evolutionary genetic algorithm (GA), the percentage of pixels within the acceptable error was improved, in average, by 7.5%. Conclusion: Optimization of processing parameters using GA could increase the accuracy of measurement for this experimental setup and improve quality of PA-based thermal images.
Keywords Photoacoustic imaging, Temperature monitoring, Hyperthermia, Genetic algorithm.
This is an Open Access article distributed under the terms of the Creative Commons Attribution License, which permits unrestricted use, distribution, and reproduction in any medium, provided the original work is properly cited.
How to cite this article: Uliana JH, Sampaio DRT, Carneiro AAO, Pavan TZ. Photoacoustic-based thermal image formation and optimization using an evolutionary genetic algorithm. Res Biomed Eng. 2018; 34(2):147-156. DOI: 10.1590/2446-4740.00218
*Corresponding author: Department of Physics, Faculty of Philosophy,
Science and Letters of Ribeirão Preto, University of São Paulo, Av. Bandeirantes, 3900, CEP 14040-901, Ribeirão Preto, SP, Brazil. E-mail: [email protected]
2011). Energy of ultrasonic backscattering (Arthur et al., 2003) and tissue attenuation (Ueno et al., 1990) are also known to be dependent on temperature and have been proposed as methods to monitor temperature using, for example, the gray level information in B-mode images (Alvarenga et al., 2017; Teixeira et al., 2014). Later, in the 2000’s, photoacoustic (PA) imaging was proposed as a technique for temperature estimation based on PA signal amplitude temperature dependence (Larina et al., 2005; Pramanik and Wang, 2009; Schüle et al., 2004; Shah et al., 2008). Temperature estimative using PA imaging can be an interesting approach due to its good spatial resolution and optical contrast besides being capable of imaging at greater depths than purely optical techniques (Wang and Hu, 2012; Xu and Wang, 2006). Generation of PA-based thermal images during thermotherapy procedures has been investigated by analyzing the laser-induced pressure profile in PA images (Larina et al., 2005).
Several studies reported the use of PA imaging to estimate temperature only for single point or spatial averages of changes in PA images (Larina et al., 2005; Pramanik and Wang, 2009). Other studies expanded these measurements to a 2-D spatial temperature distribution in tissue using PA images for temperature monitoring during hyperthermia procedures (Ke et al., 2014; Kim et al., 2014; Pramanik and Wang, 2009; Shah et al., 2008; Yao et al., 2013). However, the procedure used for thermal images formation or how the parameters used in the processing steps were chosen are not detailed described in those studies. In the present paper, four different mathematical methods to estimate variation in PA signal amplitude were investigated and all parameters used in the data processing were optimized using an evolutionary genetic algorithm (GA).
Evolutionary algorithms have been applied in several studies, for example: curve fitting, image and signal processing, economic modelling and medicine (Rozenberg et al., 2012). This form of programming works using a quality criterion to evolve a population of candidate solutions following basic principles of Darwinian evolution (Eiben and Smith, 2015; Rozenberg et al., 2012). Thus, a population of solutions, which is represented by the parameters used during signal processing steps for thermal imaging formation, was evolved by a GA to optimize PA temperature estimation.
Methods
Photoacoustic signal temperature dependence In PA imaging, short pulses of light are absorbed by biological tissue, causing local thermal expansion and subsequent acoustic wave emission. The pressure wave
magnitude is described by optical fluence, absorption coefficient and thermoelastic properties of the material
(Beard, 2011; Xu and Wang, 2006). The Grueneisen
parameter mathematically represents these thermoelastic properties (Shah et al., 2008). Therefore, PA signal amplitude is expressed as (Beard, 2011; Xu and Wang, 2006):
( ) ( )=Γ T .µa.
P T F (1)
where F is the laser fluence, µa is the absorption coefficient
and ( ) ( ) ( )( )
2
T β
Γ =
p
T c T
C T is the Grueneisen parameter,
which is temperature (T) dependent. β is the thermal coefficient of volumetric expansion, c is the propagation speed of the acoustic wave and Cp is the heat capacity at constant pressure.
Shah et al. (2008) mentioned that for water and the majority of soft tissues, the relationship between PA signal amplitude and temperature is potentially linear for temperatures in the range of 10°C to 55°C, due to the linear dependence of β and c with temperature (Bamber
and Hill, 1979; Duck, 1990). Thus, the temperature dependence of PA signal amplitude can be described using a linear model (Shah et al., 2008):
( )0
∆
∆ = αT P
P T (2)
In Equation 2, P is the pressure amplitude of the wave generated by the photoacoustic effect, ∆P is the pressure amplitude variation when the temperature changes by ΔT and α represents the linear approximation slope and has been experimentally determined in several studies for different materials. In water, for example, an increment of 51% in PA signal amplitude for a 10oC increase in temperature was observed (Shah et al., 2008).
Phantom production
Houston, TX, USA), at a dry weight concentration of 1%, were added to act as optical absorber within the inclusion to improve PA image contrast. Glass beads were added, at a dry-weight concentration of 2%, in both the inclusion and background to act as scattering sources to the PA waves. Moreover, the presence of magnetic nanoparticles in the inclusion can be thought as a tumor being treated under magnetic hyperthermia conditions.
Photoacoustic images acquisition
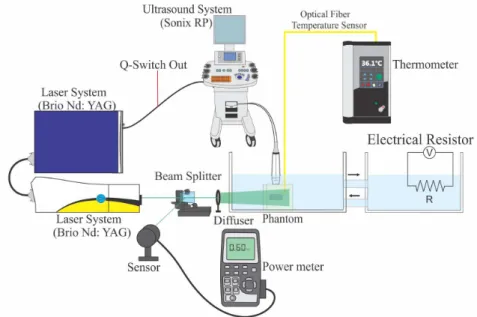
The experiments were performed acquiring PA images of the phantom submerged in a tank filled with water at controlled temperature. The water temperature in the tank was controlled using an electrical resistor. A fiber optical thermometer (Qualitrol - Neoptix, Québec, Canada) with resolution ±0.1°C and accuracy ±1°C was used to measure the internal temperature of the phantom. A total of 29 PA images were acquired at each degree in the range 36°C-41°C, after reaching thermal equilibrium.
Laser excitation was performed using a Nd:YAG laser (Quantel, model Brio, Les Ulis, France) operating at 20 Hz pulse repetition frequency, with 5 ns pulse duration, wavelength 512 nm and fluence around 7.6 mJ.cm-2. Laser energy was monitored by a power meter (FieldMax II, Coherent, Santa Clara, USA) during the entire experiment to correct eventual laser energy variation. A diffuser (DG100-600 – MD, Thorlabs, Newton, USA) was used to expand the laser beam, increasing excitation area.
The generated PA waves were acquired using a diagnostic ultrasound system (Sonix RP, Ultrasonix, Richmond, Canada) connected to a linear array transducer (L14-5/38)
composed by 128 piezoelectric elements with a measured central frequency of 5.0 MHz. PA radiofrequency (RF) signals were collected at a 40 MHz sampling frequency with 10-bit analog-to-digital converter. PA images were reconstructed using a delay-and-sum algorithm (Park et al., 2008). A depiction of the experimental setup is shown in Figure 1.
Signal processing
Due to variations in the speed of sound, PA images acquired at different temperatures appear to be moving towards the transducer. These displacements were estimated using a cross-correlation algorithm (O’Donnell et al., 1994) and then compensated for by applying a registration algorithm. After motion compensation, changes in PA signal amplitude for different temperatures were evaluated using a 1-D hanning window wH( )τ moving across the entire images with a certain overlap percentage, generating maps of PA signal amplitude variation. These amplitude variation maps were submitted to moving average filter for soften the peaks.
PA-RF (RF signal generated by PA effect) windowed signal can be described as:
( )= ( ) ( ) ( )H τ +
s t p t w n t (3)
where p t( ) is the PA detected signal and n t( ) is the zero-mean additive noise.
Variation in PA signal amplitude within the moving window limits, for a pair of signals, was calculated using four different methods.
Peak-to-peak (Pramanik and Wang, 2009; Wang et al., 2009): ( )
( )
( )
( ) ( )( )
( )
( )[max min ]
max min − = − target PP reference
s t s t
A
s t s t
(4)
Integral of the modulus:
( )
(
)
( )(
)
∫ = ∫ target IM references t dt A
s t dt
(5)
Square root of autocorrelation maximum value computed using Wiener-Khinchin theorem (Strube, 1985):
( )ω = ( ) * ( )
S s t s t (6)
( )
(
)
(
)
(
)
1 1 . ( ( ) − − ω = ω target AC corr reference max S A C max S (7)where Ccorr is the correlation coefficient between s t( )target and s t( )reference, and is the complex Fourier transform. Energy of the windowed signal (Arthur et al., 2003):
( ) ( )
(
)
2
2
∫ ω ω
=
∫ ω ω
target ES reference S d A S d (8)
For all methods a threshold was used to avoid the algorithm to compare low signal amplitude regions. This procedure consisted in comparing the amplitudes only if the peak-to-peak values of the PA signal within the window limits were greater than a percent of the maximum peak-to-peak value found in the entire image. If the peak-to-peak values within the window limits were less than this threshold, the ratio was considered to be null.
Mathematical methods to compare the PA signal amplitude were evaluated varying the window length and threshold level from 0.31 mm (1λ of the 5 MHz signal) to 1.55 mm (5λ) and 5% to 20%, respectively. To obtain the thermal images, changes in PA signal amplitude were estimated by comparing PA images acquired at 1oC incremental temperatures. The amplitude variation was then integrated from 36°C to the current temperature.
The PA-based thermal images were obtained by applying a calibration factor to the final estimated amplitude variation. This calibration factor was calculated using a linear approximation of the mean signal amplitude variation within a region of interest (ROI) with dimensions of 7.0 mm x 8.53 mm, selected within the phantom inclusion region, as a function of
temperature. For each combination of signal processing parameters, a different calibration factor was determined as the slope of a linear fit. The final PA-based thermal images, at each degree, were quantitatively evaluated in the same ROI by estimating the percent of pixels within a range of ± 1oC deviation from the actual temperature value.
Genetic algorithm
PA-based thermal images formation is greatly influenced by several signal processing parameters, such as threshold value, window length, overlap percentage, and dimensions of moving average filter mask. Since it can be challenging to empirically choose the best combination of these parameters, we propose to use GA for this optimization (Whitley, 1994).
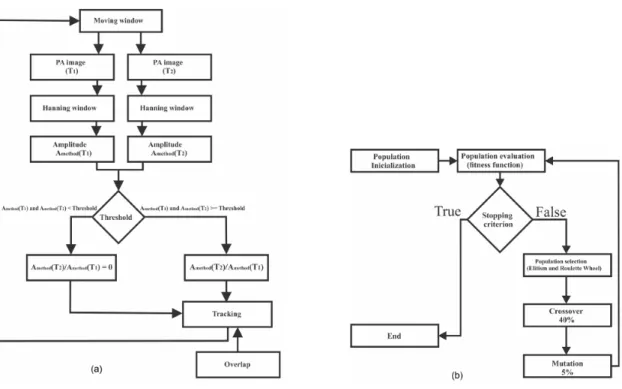
GA consisted in generating a population of 100 candidate solutions composted of window length, threshold value, size of moving average mask (width and height) and window overlap. The quality criterion, also known as fitness function, was the percent of pixels within a range of ± 1°C deviation from the actual temperature value. The candidate solutions population for the next generation was selected using of elitism and roulette wheel, i.e., a portion of next generation individuals (5%) was completed with solutions that presented the best fitness values; while the rest of the population (until complete 100 candidate solutions) was randomly selected. This random selection was created by the roulette wheel, where each solution has a probability to be chosen and this probability is proportional to the fitness value. The mutation and crossover coefficients used were equal to 5% and 40%, respectively. The defined stopping criteria was a population with 100 generations evolution, or by obtaining a candidate solution where 100% of pixels were within a range of ± 1°C deviation from the actual temperature value, for all temperatures.
Figure 2 illustrates the imaging processing and optimization using GA. Figure 2a shows a flowchart representing all steps involved in the PA images processing to generate the thermal images and Figure 2b shows another flowchart of the GA used to optimize the parameters used for thermal image formation.
Results
good contrast in the PA image due to the higher optical absorption of the magnetic nanoparticles compared to the rest of the phantom.
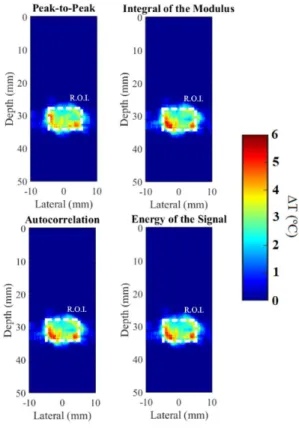
Figure 4 shows examples of PA-based thermal images, mapping temperature variation of 3oC, generated using different mathematical methods to estimate PA signal amplitude change. For these examples of thermal images, the processing parameters were arbitrarily chosen: window
length of 3λ with 70% overlap, moving average filter using a mask size of 0.26 mm x 2.13 mm in height and width, respectively, and 10% threshold.
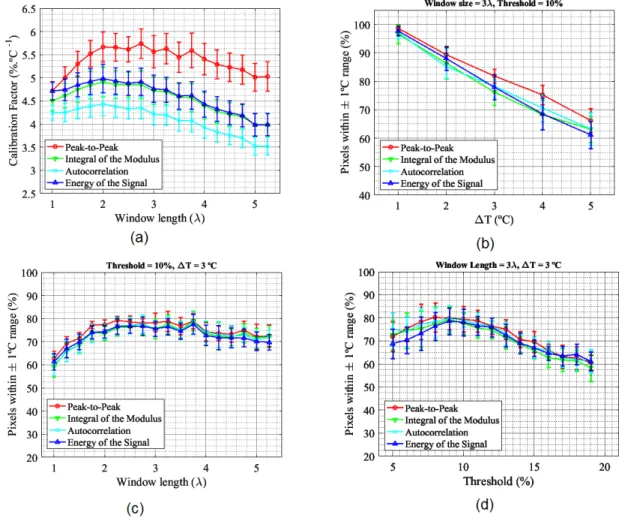
Although the images in Figure 4 show, in general, similar aspects, it should be recalled that for each case a different calibration factor was used to transform signal amplitude variation into temperature. Figure 5a shows the calibration factor obtained for the different methods. This result shows that the calibration factor can present variations higher than 20%, depending on the chosen method and parameters used during signal processing. Figure 5 also shows the percentage of pixels within ±1°C range, in the ROI, for different temperatures, threshold levels and window lengths. The other parameters were arbitrarily chosen, i.e., moving average mask size of
0.26 mm x 2.13 mm and 70% overlap. Figure 5b shows
the percent values as a function of phantom temperature using fixed values for window length and threshold level (3λ and 10%), Figure 5c shows the values as a function of window length when temperature variation
and threshold were fixed (ΔT = 3oC and 10%), and
Figure 5d shows the dependence of threshold level used for window length 3λ and ΔT = 3°C.
Once the calibration factor was obtained, the thermal images were quantified to access the estimated temperature distribution. For example, figure 6 shows histograms of estimated amplitude variation within the Figure 2. (a) Flowchart of the processing steps to calculate the amplitude ratio between two PA images acquired at different temperatures, (b) Diagram
describing the GA used for the signal processing parameters optimization.
ROI presented in figure 4 for temperatures of 37°C, 39°C, and 41°C (See Figure 6a, b and c, respectively). In this case, the amplitude variation was estimated using the peak-to-peak technique. In these histograms, the dashed lines in red show the pixels within ± 1oC deviation from the true temperatures.
The computational times demanded to generate the PA-based thermal images using each mathematical method described, by averaging all 29 frames, were calculated using as processing parameters the same arbitrary values used to produce the example images of figure 4. Since the results shown in Figure 5 demonstrated very similar behaviors for all four methods, only the peak-to-peak was used in GA due to lower computational demand (0.84±0.03s) compared to integral of the modulus (0.96±0.03s), autocorrelation (1.35±0.03s) and energy
of the signal (2.59±0.07s). Table 1 shows the mean
optimized processing parameters obtained by GA after
ten executions. In all cases, the stopping criterion was the evolution of 100 generations.
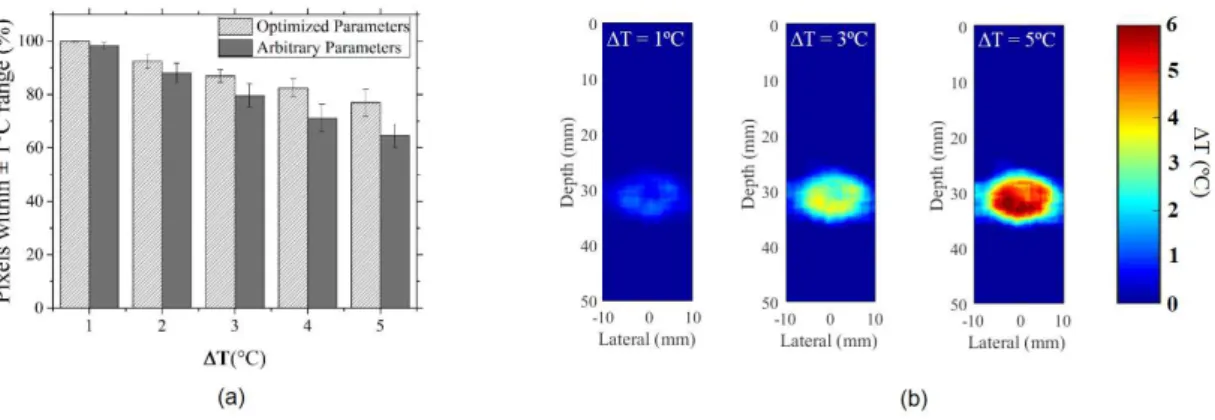
As can be seen in Figure 7(a), the percentage of pixels within ±1oC in the ROI after optimization of imaging parameters by GA becomes more accurate than that obtained by using arbitrary imaging parameters (Figure 4). Finally, Figure 7b shows the PA-based thermal images generated using the optimized processing parameters.
Discussion
Increasing tissue temperature can be an ally to fight diseases such as cancer. Rising tumoral tissue temperature to 42-45oC can improve chemotherapy and radiotherapy efficacy (Goldberg et al., 2000; Wust et al., 2002). When biological tissue temperature is maintained between 47 and 50°C, for more than 10 minutes, or above 50°C for 4 to 6 minutes or even between 60 and 140°C for a few seconds, a possible consequence is protein denaturation and cell death (Habash et al., 2006). Therefore, monitoring application time and temperature during thermal treatment is crucial step to improve treatment output and assure patient safety.
Previous studies showed that PA images are sensitive to monitor temperature variation during hyperthermia procedures (Ke et al., 2014; Kim et al., 2014; Shah et al., 2008; Wang et al., 2011). However, to the best of our knowledge, no study compared the performance of different approaches to generate PA-based thermal images.
Studies comparing the performance of different algorithms to improve the process for medical image formation are of great importance. In ultrasound imaging, for example, the performances of time-delay estimators were compared to improve Doppler and elastography imaging (Pinton et al., 2005; Viola and Walker, 2003). The performances of these algorithms were further explored to extract medium vibration and estimate viscoelastic parameters from ultrasonic signals (Costa-Júnior et al., 2017a; 2017b). Based on the same idea, the present study proposed to evaluate the performance of different methods and the influence of different signal processing parameters to generate PA-based thermal images. For this purpose, PA images of a gelatin phantom presenting good PA contrast (see Figure 3) were acquired at different temperatures; the temperature within the phantom was assumed to be uniform. Subsequently, the percentage of pixels in an ROI with calculated temperatures within Figure 4. Examples of PA-based thermal images generated using different
mathematical methods, for a temperature variation of 3°C. The method used is indicated on the top of each image.
Table 1. Optimized processing parameters found using GA.
Window length (λ) Overlap (%) Height of moving
average mask (mm) average mask (mm)Width of moving Threshold (%)
a limit of ±1°C deviation from the actual temperature was analyzed.
A crucial step in transforming the PA-signal amplitude variation into temperature is the determination of the calibration factor. Figure 5a shows that this parameter is greatly affected by the method used to estimate the
PA-signal amplitude changes. This result shows that peak-to-peak was more sensitive to temperature variation compared to integral of the modulus, energy of the signal and autocorrelation methods. For all four techniques, the sensitive decreased for window lengths greater than 2λ. In general, the calibration factor fluctuated more than 20% Figure 5. (a) Calibration factor obtained for different window lengths and mathematical methods; percent of pixels within ±1°C range (b) as function of temperature using a fixed window length 3λ and threshold 10%; (c) as function of window length for a temperature variation of 3°C; and (d) as function of threshold level using a fixed window length 3λ and temperature variation of 3°C.
for the different methods and parameters used. On the other hand, the accuracy of the images was improved when increasing the window length from 1λ to 2λ and remained almost stable for greater window lengths for all four methods. Previous studies have already demonstrated the drastic impact of varying window length to estimate time-delay between a pair of ultrasound signals for Doppler and elastography applications (Pinton et al., 2005; Viola and Walker, 2003).
Figure 5b shows that, for all mathematical methods, the accuracy of temperature measurements decreased with temperature. Few factors can explain this behavior. First, at higher temperatures the increase in speed of sound creates greater apparent displacements. These displacements reduce the similarity between PA images, increasing errors in the amplitude comparison procedure. Also, these higher displacements enhance the possible error caused by the co-registration algorithm. Second, the thermal images for temperature variations higher than 1°C are obtained by integrating the amplitude variation maps at incremental temperatures. This cumulative procedure can accumulate errors; therefore, diminishing the accuracy of the images. The third explanation is that the acceptable error we adopted here (±1°C) is more significant when mapping 1°C variation than for 5°C increment, for example. This observation is easily verified by analyzing the histograms in Figure 6. Naturally, the temperature distribution broadens for higher temperature variations, reducing the number of pixels within the acceptable error. Finally, thermal diffusion can be more pronounced at higher temperatures, decreasing the accuracy of the values calculated to obtain the thermal images. Since the temperature inside the phantom was being constantly monitored and the phantom was immersed in a water tank, we believe that homogeneous temperature distribution within the phantom was achieved.
The results in Figure 5 show equivalence among
all mathematical methods when analyzing the thermal images generated using different window lengths and threshold values at different temperatures. For optimizing the processing parameters using GA, the peak-to-peak method was chosen, since it demands less computational time and showed more sensitivity, see Figure 5a, than the other mathematical methods studied.
The arbitrary parameters used to generate the thermal images shown in figure 4 were chosen based on the apparent best combination observed in Figure 5. However, visually determining the best condition in a multivariate problem can lead to moderate outputs. Therefore, in this study the evolutionary programming was used to optimize this procedure. It is interesting to observe that the optimized values (Table 1) for threshold and window length differed from those that were the apparent obvious the best choices in Figure 5. The results in Figure 7a show improvement in the accuracy to map temperature variation, especially at higher temperatures. Increments of around 12.5% in the amount of pixels within the acceptable error of ±1°C were observed when ΔT = 5°C.
Parameters optimization using GA can be of simple implementation and can be easily adapted from one application to another (Eiben and Smith, 2015). The most important limitation of GA is the lack of guarantee to reach an optimal solution in finite amount of time, i.e., the dependence of population size and number of generations to find global optima (Buczak et al., 2001). In this study, population evolution over 100 generations was empirically found to be a good tradeoff between computational demand and improvement in image quality. The total time spent in the optimization shown here was around 23 hours. We verified that the gain achieved by using, for example, 200 generations was not justified by the increase in computational demand.
Figure 7. (a) Amount of pixels within ±1°C range for the parameters obtained before and after optimization using GA; (b) Optimized PA-based
The results observed in this study are dependent on the setup, composed of a linear probe with limited bandwidth, and the sample used. Different setups could lead to different sensitivity and accuracy in temperature mapping. It is worth noting that different calibration factor values have been reported, depending on the type of tissue analyzed and setup used (Ke et al., 2014; Larina et al., 2005; Shah et al., 2008; Wang et al., 2011). Therefore, the merit of the present paper was to demonstrate that signal parameters and methods involved in tracking PA signal amplitude changes, due to temperature variation, drastically affected the sensitivity and accuracy of thermal images formation. We also demonstrated that a simple evolutionary algorithm could improve the accuracy of temperature mapping by, on average, 7.5%. Consequently, we strongly advise the researchers interested in using PA imaging to monitor the temperature in hyperthermia procedures to evaluate the sensitivity and accuracy of their method using a similar experiment described here. Optimizing the parameters to improve accuracy is also recommended.
In this study, the performance of different algorithms to generate PA-based thermal images by tracking changes in PA signal amplitude was evaluated. The results demonstrated that signal processing parameters, such as window length, threshold level and dimensions of moving average filter, and mathematical methods used to track PA signal amplitude variation, due to temperature variation, affected the sensitivity and accuracy of the thermal images formation. The sensitivity, for example, fluctuated more than 20% depending on the methods and parameters used. The peak-to-peak method presented the best combination of accuracy, sensitivity and computational demand. The optimized signal processing parameters lead to improved performance. For example, for a temperature variation of 4°C, 82% of the pixels estimated temperature within the acceptable error, while for the images obtained using arbitrarily chosen parameter only 71% were.
Acknowledgements
This study was supported by CAPES, CNPq (grant 476671/2013-2), FAPESP grants 2013/18854-6, 2014/26598-2 (for JHU) and 2015/05684-0 (for DRTS), and USP NAP-FisMed grant.
References
Alvarenga AV, Wilkens V, Georg O, Costa-Félix RPB. Non-invasive estimation of temperature during physiotherapeutic ultrasound application using the average gray-level content of B-Mode Images: a metrological approach. Ultrasound Med Biol. 2017; 43(9):1938-52. http://dx.doi.org/10.1016/j. ultrasmedbio.2017.04.008. PMid:28619277.
Arthur RM, Straube WL, Starman JD, Moros EG. Noninvasive temperature estimation based on the energy of backscattered ultrasound. Med Phys. 2003; 30(6):1021-9. http://dx.doi. org/10.1118/1.1570373. PMid:12852524.
Bamber JC, Hill CR. Ultrasonic attenuation and propagation speed in mammalian tissues as a function of temperature. Ultrasound Med Biol. 1979; 5(2):149-57. http://dx.doi. org/10.1016/0301-5629(79)90083-8. PMid:505616. Beard P. Biomedical photoacoustic imaging. Interface Focus. 2011; 1(4):602-31. http://dx.doi.org/10.1098/rsfs.2011.0028. PMid:22866233.
Buczak AL, Wang H, Darabi H, Jafari MA. Genetic algorithm convergence study for sensor network optimization. Inf Sci (Ny). 2001; 133(3-4):267-82. http://dx.doi.org/10.1016/S0020-0255(01)00089-5.
Costa-Júnior JFS, Elsztain MAD, Sá AMFLM, Machado JC. Characterization of viscoelasticity due to shear wave propagation: A comparison of existing methods based on computational simulation and experimental data. Exp Mech. 2017a; 57(4):615-35. http://dx.doi.org/10.1007/s11340-017-0254-6.
Costa-Júnior JFS, Parcero GC, Machado JC. Comparison analysis of four processing methods employed in dynamic elastography to estimate viscoelastic parameters of a medium: tests using computational simulation and experiment. Biomed Phys Eng Express. 2017b; 3(2). http://dx.doi.org/10.1088/2057-1976/aa61b9.
Crile G Jr. Heat as an adjunct to the treatment of cancer: Experimental studies. Cleve Clin Q. 1961; 28(Apr):75-89. http://dx.doi.org/10.3949/ccjm.28.2.75. PMid:13696466. Crouzet S, Murat FJ, Pasticier G, Cassier P, Chapelon JY, Gelet A. High intensity focused ultrasound (HIFU) for prostate cancer: current clinical status, outcomes and future perspectives. Int J Hyperthermia. 2010; 26(Dec):796-803. http://dx.doi.org/10.3 109/02656736.2010.498803. PMid:20883113.
Duck FA. Physical properties of tissue. New York: Academic Press; 1990.
Eiben AE, Smith J. From evolutionary computation to the evolution of things. Nature. 2015; 521(7553):476-82. http:// dx.doi.org/10.1038/nature14544. PMid:26017447.
Goldberg SN, Gazelle GS, Mueller PR. Thermal ablation therapy for focal malignancy: a unified approach to underlying principles, techniques and diagnostic imaging guidance. Am Roentgen Ray Soc. 2000; 323-31.
Habash RWY, Bansal R, Krewski D, Alhafid HT. Thermal therapy, part 2: Hyperthermia techniques. Crit Rev Biomed Eng. 2006; 34(6):491-542. PMID: 17725480.
Hall TJ, Bilgen M, Insana MF, Krouskop TA. Phantom materials for elastography. IEEE Trans Ultrason Ferroelectr Freq Control. 1997; 44(6):1355-65. http://dx.doi.org/10.1109/58.656639. Ke H, Tai S, Wang LV. Photoacoustic thermography of tissue. J Biomed Opt. 2014; 19(2):26003. http://dx.doi.org/10.1117/1. JBO.19.2.026003. PMid:24522803.
Larina IV, Larin KV, Esenaliev RO. Real-time optoacoustic monitoring of temperature in tissues. J Phys D Appl Phys. 2005; 38(15):2633-9. http://dx.doi.org/10.1088/0022-3727/38/15/015. Maass-Moreno R, Damianou CA. Noninvasive temperature estimation in tissue via ultrasound echo-shifts. Part I. Analytical model. J Acoust Soc Am. 1996a; 100(4 Pt 1):2514-21. http:// dx.doi.org/10.1121/1.417359. PMid:8865654.
Maass-Moreno R, Damianou CA, Sanghvi NT. Noninvasive temperature estimation in tissue via ultrasound echo-shifts. Part II. In vitro study. J Acoust Soc Am. 1996b; 100(4 Pt 1):2522-30.
http://dx.doi.org/10.1121/1.417360. PMid:8865655. Nasoni RL, Bowen T, Connor WG, Sholes RR. In vivo temperature dependence of ultrasound speed in tissue and its application to noninvasive temperature monitoring. Ultrason Imaging. 1979; 1(1):34-43. http://dx.doi.org/10.1177/016173467900100103. PMid:575811.
O’Donnell M, Skovoroda AR, Shapo BM, Emelianov SY. Skovoroda A a. R, Shapo BMB, Emelianov SSY. Internal displacement and strain imaging using ultrasonic speckle tracking. IEEE Trans Ultrason Ferroelectr Freq Control. 1994; 41(3):314-25. http://dx.doi.org/10.1109/58.285465.
Pankhurst QA, Connolly J, Jones SK, Dobson J. Applications of magnetic nanoparticles in medicine. J Phys D Appl Phys. 2003; 36(3):227-38. http://dx.doi.org/10.1088/0022-3727/36/13/201. Park S, Karpiouk AB, Aglyamov S, Emelianov SY. Adaptive beamforming for photoacoustic imaging. Opt Lett. 2008; 33(12):1291-3. http://dx.doi.org/10.1364/OL.33.001291. PMid:18552935.
Pavan TZ, Madsen EL, Frank GR, Carneiro AAO, Hall TJ. Nonlinear elastic behavior of phantom materials for elastography. Phys Med Biol. 2010; 55(9):2679-92. http:// dx.doi.org/10.1088/0031-9155/55/9/017. PMid:20400811. Pinton GF, Dahl JJ, Trahey GE. Rapid tracking of small displacements using ultrasound. Proc IEEE Ultrason Symp. 2005; 4(6):2062-25. http://dx.doi.org/10.1109/ULTSYM.2005.1603285. Pramanik M, Wang LV. Thermoacoustic and photoacoustic sensing of temperature. J Biomed Opt. 2009; 14(5):54024. http://dx.doi.org/10.1117/1.3247155. PMid:19895126. Rozenberg G, Bäck T, Kok JN. Handbook of natural computing. USA: Springer-Verlag Berlin Heidelberg; 2012. http://dx.doi. org/10.1007/978-3-540-92910-9.
Schüle G, Hüttmann G, Framme C, Roider J, Brinkmann R. Noninvasive optoacoustic temperature determination at the fundus of the eye during laser irradiation. J Biomed Opt. 2004; 9(1):173-9. http://dx.doi.org/10.1117/1.1627338. PMid:14715070. Seo CH, Shi Y, Huang S-W, Kim K, O’Donnell M. Thermal strain imaging: a review. Interface Focus. 2011; 1(4):649-64. http://dx.doi.org/10.1098/rsfs.2011.0010. PMid:22866235. Shah J, Park S, Aglyamov S, Larson T, Ma L, Sokolov K, Johnston K, Milner T, Emelianov SY. Photoacoustic imaging and temperature measurement for photothermal cancer therapy. J Biomed Opt. 2008; 13(3):34024. http://dx.doi. org/10.1117/1.2940362. PMid:18601569.
Simon C, VanBaren P, Ebbini ES. Two-dimensional temperature estimation using diagnostic ultrasound. IEEE Trans Ultrason Ferroelectr Freq Control. 1998; 45(4):1088-99. http://dx.doi. org/10.1109/58.710592. PMid:18244264.
Steger AC, Lees WR, Walmsley K, Bown SG. Interstitial laser hyperthermia: a new approach to local destruction of tumours. BMJ. 1989; 299(6695):362-5. http://dx.doi.org/10.1136/ bmj.299.6695.362. PMid:2506968.
Straube WL, Arthur RM. Theoretical estimation of the temperature dependence of backscattered ultrasonic power for noninvasive thermometry. Ultrasound Med Biol. 1994; 20(9):915-22. http:// dx.doi.org/10.1016/0301-5629(94)90051-5. PMid:7886851. Strube HW. A generalization of correlation functions and the Wiener-Khinchin theorem. Signal Process. 1985; 8(1):63-74. http://dx.doi.org/10.1016/0165-1684(85)90089-1.
Teixeira CA, Alvarenga AV, Cortela G, Von Krüger MA, Pereira WCA. Feasibility of non-invasive temperature estimation by the assessment of the average gray-level content of B-mode images. Ultrasonics. 2014; 54(6):1692-702. http://dx.doi. org/10.1016/j.ultras.2014.02.021. PMid:24630851.
Ueno S, Hashimoto M, Fukukita H, Yano T. Ultrasound thermometry in hyperthermia. In: Ultrasonics Symposium; Proceedings IEEE; 1990 Dec 4-7; Honolulu. USA: IEEE; 1990. p. 1645–52. http://dx.doi.org/10.1109/ULTSYM.1990.171648. Viola F, Walker WF. A comparison of the performance of time-delay estimators in medical ultrasound. IEEE Trans Ultrason Ferroelectr Freq Control. 2003; 50(4):392-401. http://dx.doi.
org/10.1109/TUFFC.2003.1197962. PMid:12744395.
Wang LV, Hu S. Photoacoustic tomography: In vivo imaging from organelles to organs. Science. 2012; 335(6075):1458-62. http://dx.doi.org/10.1126/science.1216210. PMid:22442475. Wang S-H, Wei C-W, Jee S-H, Li P-C. Photoacoustic temperature mensurements for monitoring of thermal therapy. Proc. SPIE 2009; 7177:71771S1-11. http://dx.doi.org/10.1117/12.809973. Wang SH, Wei CW, Jee SH, Li PC. Quantitative thermal imaging for plasmonic photothermal therapy. J Med Biol Eng. 2011; 31(6):387-93. http://dx.doi.org/10.5405/jmbe.810.
Welch AJ, van Gemert MJC. Optical-thermal response of laser-irradiated tissue. 2nd ed. New York: Springer-Verlag;