Thermal and Optical Properties of Porous Silicon
A. Ferreira da Silvaa, T. Souza da Silvaa, O. Nakamuraa,
M.M.F. d’Aguiar Netoa, I. Pepea, L. S. Romanb, E. Vejec
a
Instituto de Física, Universidade Federal da Bahia, Campus Universitário de Ondina, 40210-340 Salvador - Ba, Brasil
b
Departamento de Física, Universidade Federal do Paraná, C.P. 19044, 81531-990 Curitiba - Pr, Brazil
c
Department of Electric Power Engineering, Technical University of Denmark, Building 325, DK-2800 Lyngby, Denmark
Received: October 19, 2000; Revised: January 8, 2001
Thermal diffusivity and optical absorption have been investigated for porous silicon, at room temperature, using photoacoustic spectroscopy. The experimental results obtained conform well with the existing studies recently published. The value obtained for thermal diffusivity is 0.045±0.002 cm2/s.The absorption onsets show energy structures, differing from the ordinary semiconductor of bulk type. PACS 51.20.Td; 74.25.Fy; 73.20.Dy; 78.20.Wc; 81.40.Tv
Keywords: thermal properties, optical properties, photoacoustic spectroscopy, porous silicon
1. Introduction
Owing to the wide-ranging of possible technological applications in opto-electronic devices1-27and biocompat-ible materials as well28-33, the interest in characterizing porous silicon (PS) has recently increased very much. Po-rous silicon has been studied intensively since the discov-ery by Canham1, that even at room temperature PS can emit very bright photoluminescence (PL), in great contrast to crystalline silicon (c-Si). Usually, the PS samples are pro-duced by anodic etching of c-Si wafers in hydrofluoric (HF) solution.
A large amount of investigations is devoted to the PL and absorption measurements of PS1-6,8, but so far there has been a few reports on its thermal properties7,17,18,34,35. In this work we have devoted our attention to obtain, by applying the photoacoustic spectroscopy (PAS), the optical absorption and the thermal diffusivity, which is, as other optical properties, an important physical parameter to be considered in device modeling, specially for power dissi-pation. The PAS spectra are obtained directly from the heat generated in a sample, due to nonradiative absorption proc-esses36,37. The fact that the PA signal depends on how the heat diffuses through the sample enable us to measure its thermal diffusivity7,17,18,38. The experimental PA setups, consisting of a periodically exciting light source, a
photoa-coustic cell containing the sample and a microphone are described in details in Refs. 37 and 38 for optical absorption and thermal diffusivity respectively.
2. Experimental
The samples were produced by etching p-type c-Si wafers of crystal orientation (100) and resistivity 1-30Ωcm eletrochemycally in 40% HF: ethanol 1:1. The electrolytic cell as well as the etching procedure are described in Ref. 5. Current densities from 5 mA/cm2 to 25 mA/cm2were used and in each case, the current density was always kept constant during etching. Etching times were from 60 to 90 min, so that all samples consisted of a fairly thick layer of PS. Scanning force microscopy (SFM) investigation revealed a typical thickness of around 30µm.
The SFM measurements were performed using a Digital Instrument Nanoscope III running in tapping mode. In this imaging mode, the SFM tip-cantileve oscillates sinusoi-dally at high frequencies (300 kHz) with amplitude 10-100 nm, so that the tip contacted the surface once during each period. The data were taken in ambient air at room tempera-ture. The samples were stored in air for a long time (>> 1 month), so that surface oxidation had equilibrated. This implies that the surface structure is fairly reproducibly and does not change in time. Scans were made over areas from
e-mail: [email protected]
500 x 500 nm to 20 x 20µm with a resolution of 512 x 512 pixels and the scan rate of 1-2 Hz.
3. Results and Discussion
Figure 1 shows a typical SFM image of p-type PS sample produced with 60 min etching time. In Fig. 2 we show the PA spectrum of the same sample used for Fig. 1. Several spectral features are seen, revealing the complex band system originated from the surface roughness as shown in Fig. 1. The PA energies are respectively 1.603±0.048, 1.668±0.050, 1.751±0.052, 1.882±0.056, 2.025±0.086 and 2.143±0.064eV. Such structures have
recently been confirmed by PL, photoluminescense excita-tion (PLE) and photocurrent measurements21,26.
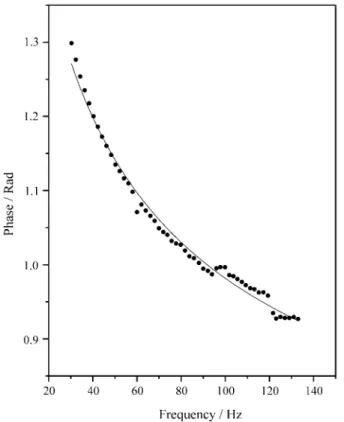
To measure thermal diffusivity, the acoustic signal pro-duced in the gas cavity by the sample is detected by a Sunheiser condensed microphone and analyzed in respect to the modulator reference by a lock-in amplifier38. For the transmission arrangement, corresponding to the rear-side excitation of a thermally thick sample, the thermoacoustic phase contribution is given by the equation38.
Φ=Φ0+ arctan {Ls[(π/αs) f ] - 1}-1, (1)
whereΦ0is the initial phase,αsis the thermal diffusivity,
Ls is the sample thickness (Ls = 530 µm), and f is the
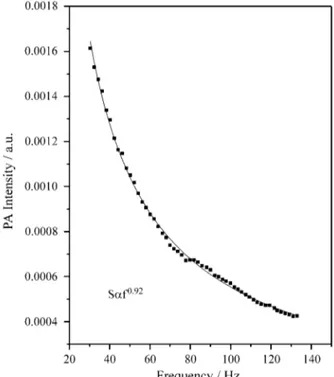
chopping frequency. These parameters are determined by a numerical least-squares fitting procedure. In Fig. 3 we show the rear-PA intensity as a function of the chopping frequency f for the PS sample. It is shown that the PA signal intensity S is proportional to f-λ, for our best set of measurements λ = -0.92. Figure 4 shows the chopping frequency dependence of rear-signal phase. The solid curve represents the best fit of the data to Eq. (1). The value obtained for the thermal diffusivity, at room temperature is αs= 0.045±0.002 cm2/s. This value may be compared to αs= 0.047 cm2/s andαs= 0.053 cm2/s recently found7,18by
Cruz-Orea et al.7and Calderón et al.18, respectively, with open photoacoustic cell method. It is worthwhile to point out that there are some discrepancies between thermal conductivity values in the literature7,17,18,25. Like the thermal diffusivity, the thermal conductivity k is another important parameter to manufacturing devices. The
24 Ferreira da Silva et al. Materials Research
Figure 1.The SFM image of the PS sample. The axes units have been chosen in order to provide a better image presentation. Details in the text.
Figure 2.A typical PAS spectrum from a PS sample. The PAS signal is plotted versus the photon energy of the illuminating light. Same PS sample
measurement ofαsallows us to obtain k, once the density ρand the specific heat Cvare know. We determine k by the
relation k = αsρCv. Cruz-Orea7 with a spark-process PS
found k = 0.0074 w/cmK andαs= 0.047 cm2/s, Calderón
et al., with the usual eletrochemical etching process found k = 0.130±0.006 W/cmK andαs= 0.053±0.0035 cm2/s
respectively. They have used a n-type PS. Amato et al.17, found, for p-type PS the values k = 0.025 W/cmK and k = 0.039 W/cmK respectively for two different samples, while a value of k = 0.312 W/cmK for a n-type PS. Shinoda et al.25, with a thermally induced ultrasonic technique
found k = 0.01 W/cmK. We may mention that Amato et al.17, have used forheat capacity a value equal to that of c-Si. Using the heat capacity of c-Si, Cv= 1.67 J/cm3K and of PS
from Shinoda et al.25. Cv= 0.7 J/cm3K we found k = 0.075
W/cmK and k = 0.031 W/cmK respectively. The results above confirm the good possibility for thermal insulation given by PS layers in contrast to c-Si, which has higher thermal properties, i.e.,αs= 0.9 cm2/s and k = 1.67 W/cmK.
In summary, we have obtained through the PAS tech-nique, the complex structure of the band gap energies and the thermal diffusivity of porous silicon. Several absorption features were observed from the PAS spectrum. The posi-tions of these features were found in a range of energy 1.603±0.048≤E≤2.143±0.064 eV. The thermal diffusiv-ity result is 0.045±0.002 cm2/s, a value compared to other semiconductors of current technological importance38. The results conform well with the existing studies recently published, recognizing PS as a good material with potential to be used, for instance, thermal insulating layers and structures.
Acknowledgments
The authors would like to acknowledge the support of the Brazilian National Research Council, CNPq and SE-PLANTEC/CADCT (Bahia). LSR acknowledges the fi-nancial support of the Göran Gustafsson foundation, and Thin Film Electronics AB, Sweden. EV is very grateful to support from the Danish Natural Science Research Council, the Carlsberg Foundation, Director Ib Henriksens Founda-tion, and the NOVO Nordic Foundation.
References
1. Canham, L.T. Appl. Phys. Lett., v. 57, p. 1046, 1990. 2. Canham, L.T.; Leong, W.Y.; Beale, M.I.J.; Cox, T.I.;
Taylor, L. Appl. Phys. Lett., v. 61, p. 2563, 1992. 3. Lockwood, D.J.; Wang, A.; Bryskiewicz, B. Solid
State Commun., v. 89, p. 587, 1994.
Vol. 4, No. 1, 2001 Thermal and Optical Properties of Porous Silicon 25
Table 1.Measured values of thermal diffusivityαsand thermal conductivitykfor porous silicon. In the fourth columnkmeanstands for the computed average. The corresponding average ofkfor p-type samples isαs = 0.032±0.018 W/cmK.
Author αs(cm2/s) k (W/cmK) kmean(W/cmK) p-type Sample type
Present work 0.045±0.002 0.075
0.031
0.053±0.022 p
p
Cruz-Orea7 0.047 0.0074 - n
Caldereón18 0.053±0.0035 0.130 - n
Amato17 0.025
0.039 0.312
0.032±0.013 p
p n
Shinoda25 0.0100 0.010 p
4. Lockwood, D.J. Solid State Commun., v. 92, p. 101, 1994.
5. Andersen, O.K.; Veje, E. Phys. Rev., B53, 15643, 1996.
6. Miller, D.A.B. Nature, v. 384, p. 307, 1996.
7. Cruz-Orea, A.; Delgadillo, I.; Vargas, H.; Gudino-Martinez, A.; Marin, E.; Vazquez-Lopez, C.; Cal-deron; A.; Alvarado-Gil, J.J. J. Appl. Phys., v. 79, p. 8951, 1996.
8. Pavesi, L. Microelectronics Journal, v. 27, p. 437, 1996.
9. Bjorklund, R.B.; Zangooie, S.; Arwin, H. Appl. Phys. Lett., 69, 3001, 1996; Adv. Matter, v. 9, p. 1067, 1997. 10. Chang, I.M.; Chen, Y.F. J. Appl. Phys., 82, 3514,
1997.
11. Collins, R.T.; Fauchet, P.M.; Tischler, M.A. Phys. Today, v. 50 n. 1, p. 24, 1997.
12. Canham, L.T., ed., Properties of Porous Silicon, EMIS Data Review Series n. 181 NSPEC, London chaps. 6, 7 and 10, 1997.
13. Cullis, A.G.; Canham, L.T.; Cacott, P.D. J. Appl. Phys., v. 82, p. 909, 1997.
14. Veje, E.; Ferreira da Silva, A.; Berggren, K-F.; Pepe, I.; Silva, A.V. Batista da. Pits and Pores: formation, properties and significance for advanced lumines-cence materials, Schmuki, P.; Lockwood, D.J.; Isaacs, H.; Bsiesy, A., eds., Proc. Electrochem. Soc., v. 97, n. 7, p. 242, 1997.
15. Romstad, F.C.; Veje, E. Phys. Rev., v. B55, p. 5220, 1997.
16. Gole, J.L.; Dudel, F.P.; Grantier; D.; Dixon, D.A. Phys. Rev., v. B56, p. 2137, 1997.
17. Amato, G.; Benedetto, G.; Boarino, L.; Brunetto, N.; Spagnolo, R. Opt. Eng., v. 36, p. 423, 1997.
18. Calderón, A.; Alvarado-Gil, J.J.; Gurevich, Y.G.; Cruz-Orea, A.; Delgadillo, I.; Vargas, H.; Miranda, L.C.M. Phys. Rev. Lett., v. 79, p. 5022, 1997. 19. Zangooie, S.; Jansson, R. ; Arwin, H. J. Vac. Sci.
Technol., v. A16, p. 2901, 1998.
20. Pavesi, L.; Pauzarini, G.; Andreani, L.C. Phys. Rev., v. B58, p. 15794, 1998.
21. Frederiksen, J.T.; Melcher, P.G.; Veje, E. Phys. Rev., v. B58, p. 8020, 1998.
22. Gole, J.L.; Dixon, D.A. Phys. Rev., v. B57, p. 12002, 1998; J. Phys. Chem., v. B102, p. 1768, 1998.
23. Pavesi, L.; Mulloni, V. Proceedings of the Interna-tional School of Physics Enrico Fermi, Course CXLI, Bisi, O.; Campisano, S.V.; Pavesi, L.; Priolo, F., eds., IOS Press, Amsterdam, p. 87, 1999.
24. Pavesi, L.; Chierchia, R.; Bellutti, P.; Lui, A.; Fuso, F.; Labardi, M.; Pardi, L.; Sbrana, F.; Allegrini, M.; Trusso, S.; Vasi, C.; Ventura, P.J.; Costa, L.C.; Carmo, M.C.; Bisi, O. J. Appl. Phys., v. 86, p. 6474, 1999.
25. Shinoda, H.; Nakajima, T.; Ueno, K.; Koshida, N. Nature, v. 400, p. 853, 1999.
26. Egeberg, R.C.; Veje, E.; Ferreira da Silva, A.; Pepe, I.; Alves, A. Santos. J. Porous Matter, v. 7, p. 173, 2000.
27. Ferreira da Silva, A.; Rosa, R.R.; Roman, L.S.; Veje, E.; Pepe, I. Solid State Commun., v. 113, p. 703, 2000. 28. Canham, L.T. Adv. Mater., v. 7, p. 1033, 1995. 29. Canham, L.T.; Reeves, C.L.; Leni, A.; Houlton, M.R.;
Newey, J.P.; Simons, A.J.; Cox, T.I. Thin Sol. Fil., v. 297, p. 304, 1997.
30. Bayliss, S.C.; Buckberry, L.D.; Rousseau, C.; Harris, P. and Rousseau, Thin Sol. Fil., v. 297, p. 308, 1997. 31. Bayliss, S.C.; Harris, P.J.; L.D. Buckberry and
Rous-seau, J. Mater. Sci. Lett., v. 16, p. 737, 1997. 32. Buckberry, L.; Bayliss, S.C. Materials World, v. 7 n.
4, p. 213, 1999.
33. Bayliss, S.C.; Buckberry, L.D.; Fletcher; I.; Tobin, M.J. Sensors and Actuators A, v. 74, p. 139, 1999. 34. Benedetto, G.; Boarino, L.; Brunetto, N; Rossi, A.;
Spagnolo, R.; Amato, G. Phil. Mag., v. B76, p. 383, 1997
35. Amato, G.; Angelucci, R.; Benedetto, G.; Boarino, L.; Dori, L.; Maccagnani, P.; Brunetto, N.; Rossi, A.M.; Spagnolo, R. J. Porous Mater., v. 7, p. 183, 2000. 36. Zelaya-Angel, O.; Alvarado-Gil, J.J.;
Lozada-Mo-rales, R.; Vargas, H.; Ferreira da Silva, A. Appl. Phys. Lett., v. 64, p. 291, 1994.
37. Ferreira da Silva, A.; Veissid, N.; An, C.Y.; Pepe, I.; Oliveira, N. Barros de; Silva, A.V. Batista da. Appl. Phys. Lett., v. 69, p. 1930, 1996.
38. Silva, T.S.; Alves, A.S.; Pepe, I.; Tsuzuki, H.; Naka-mura, O.; d’Aguiar Neto, M.M.F.; Ferreira da Silva, A.; Veissid, N.; An, C.Y. J. Appl. Phys., v. 83, p. 6193, 1998.