Catherine Viana da Silva
UMinho|20 15 April, 2015 The P er formance of US Sociall y R esponsible Mutual F undsUniversidade do Minho
Escola de Economia e Gestão
The Performance of US Socially Responsible
Mutual Funds
Master dissertation
Master in Finance
Study realized under the supervision of
Professor Doutor Nelson Manuel P. B. Areal
Catherine Viana da Silva
Universidade do Minho
Escola de Economia e Gestão
The Performance of US Socially Responsible
Mutual Funds
Acknowledgments
It is with great pleasure that I write this point of the dissertation, thanking all those who contributed in some way to the accomplishment of the dissertation.
In general, I thank all the people who directly or indirectly contributed to the preparation of this work.
In particular, I express my gratitude to my supervisor, Professor Doutor. Nelson Areal, for his precious help provided throughout the preparation of the dissertation, without which it would be impossible to accomplish.
I also want to thank my parents and my brothers for the precious words of encouragement and strength they gave me during this unique stage of my life.
Finally, I extend my sincere gratitude to the University of Minho and the School of Economics and Management.
RESUMO
Esta dissertação pretende investigar o desempenho dos fundos socialmente responsáveis no período de janeiro de 2001 a setembro de 2014, através da comparação dos fundos de retalho com os fundos institucionais. Desta forma, pretendemos dar uma visão mais clara sobre o desempenho dos fundos de investimento socialmente responsáveis dos EUA num contexto de (não) variação no tempo em diferentes estados do mercado entre os dois tipos de fundos. Para tal, são consideradas várias medidas de desempenho que são amplamente utilizadas na literatura.
O desempenho dos fundos foi avaliado com base nas medidas não condicionais de Jensen (1968) e Carhart (1997) e também no modelo condicional completo de Christopherson et al. (1998). Por fim, com o objetivo de obter resultados mais sólidos, uma variável dummy será usada para definir os diferentes estados de mercado. Deste modo, o desempenho das carteiras será medido num contexto de tempo variável de acordo com as classificações do NBER.
Os resultados não mostram diferenças estatisticamente significativas entre as duas carteiras na abordagem VW. Estes resultados são consistentes com a evidência empírica. Por sua vez, a EW carteira de fundos institucionais tem um desempenho superior ao da EW carteira de fundos de retalho (modelos não condicionais). Enquanto para o modelo dos quatro fatores de tempo variável de Carhart (1997) os resultados sugerem que os fundos institucionais têm um desempenho significativamente menor que os fundos de retalho.
Por fim, o alfa em períodos de expansão é neutro para as carteiras VW e EW, exceto a carteira VW PINS que tem um desempenho negativo e estatisticamente significativo. Além disso, essas carteiras não variam durante a recessão. Analisando os outros fatores de risco, podemos inferir que as carteiras EW e VW não mudam significativamente dos períodos de expansão para os períodos de recessão. Além disso, os resultados mostram que há algumas evidências de mudanças do fator Momentum em diferentes regimes de mercado.
Abstract
This master thesis investigates the performance of SRI retail mutual funds compared to SRI institutional funds, over the time period of January 2001 to September 2014. By doing so, it provides a better insight into the performance of US socially responsible mutual funds in a (non) time-varying context in different states of the market between both fund types. To this end, several performance measures that are widely used in the literature are considered.
Fund performance was evaluated on the basis of the Jensen (1968) and Carhart (1997) unconditional measures and also the full conditional model of Christopherson, Ferson and Glassman (1998). Finally, in order to get more robust results, a dummy variable will be used to define the different market conditions. Thus, the performance of the portfolio will be measured in a time varying context under the NBER classifications.
The results show no statistically significant differences between the two portfolios for the value-weighted approach. This is consistent with previous empirical evidence. Meanwhile, the EW portfolio of institutional funds has a higher performance than the EW portfolio of retail funds (unconditional models). While for the time varying Carhart (1997) four-factor model, the results suggest that institutional funds underperform significantly more than retail funds.
Finally, the alpha in periods of expansion is neutral for the equally weighted and value weighted portfolios, except the VW PINS portfolio that underperforms significantly. Additionally, those portfolios do not change during recession. Analysing the other risk factors, it may be inferred that EW and VW portfolios do not change significantly from periods of expansion to periods of recession. Furthermore, the results show that there is some evidence that the momentum factor changes across different market regimes.
Table of contents
LIST OF ACRONYMS AND ABBREVIATIONS………..vi
LIST OF TABLES……….…..vii
LIST OF APPENDIX……….viii
1. INTRODUCTION……...………..……….1
1.1. Socially responsible funds………..……1
1.2. Retail and institutional funds………..3
1.3. The purpose of the study………4
1.4. The structure of the dissertation……….………6
2. LITERATURE REVIEW………...………....7
2.1. Introduction………....7
2.2. Performance of socially responsible investments………..7
2.3. Performance of unconditional retail and institutional funds………10
2.4. Performance of SRI/conventional funds according to NBER Business cycles……….………..…………..12 3. METHODOLOGY………...15 3.1. Introduction….……….15 3.2. Unconditional Model………16 3.2.1. Jensen’s alpha (1987)………...…..16 3.2.2. Carhart’s alpha (1997)………....16 3.3. Conditional Models………..17
3.3.1. The conditional model of Christopherson, Ferson and Glassman (1998)………17
3.4. Time-varying Carhart (1997) four-factor based performance estimates considering NBER cycles……….…20
4. DATA.……….……….21
5. EMPIRICAL RESULTS…...………...25
5.1. Introduction………..25
5.2. Unconditional Models………..25
5.3. Full Conditional Model………30
5.4. Time-varying Carhart four-factor based performance estimates considering NBER cycles………37
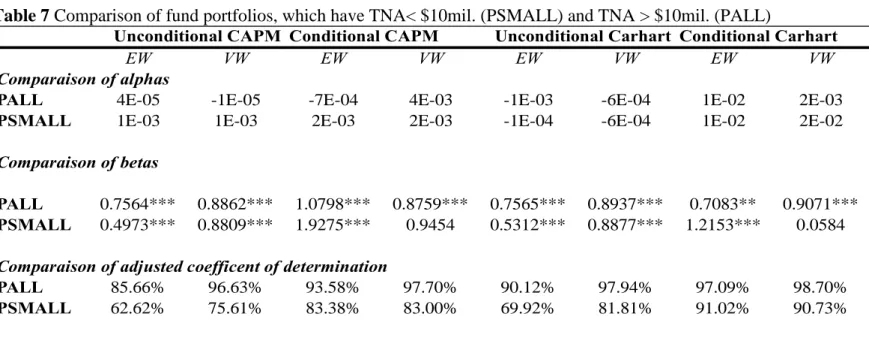
5.5. Portfolio funds, which have TNA < $10 mil. (PSMALL) and
TNA > $10 mil. (PALL)………..40
6. CONCLUSION..………..……42
LIST OF ACRONYMS AND ABBREVIATIONS
CAPM Capital Asset Pricing Model
ESG Environmental, social and governance
EW Equally-weighted
HAC Heteroskedasticity and autocorrelation
consistent
HC Heteroskedasticity consistent
KLD Kinder Lydenberg Domini
NBER National Bureau of Economic Research
PALL Portfolio of All (retail and institutional)
funds which TNA > $10m
PINS Portfolio of Institutional funds
PRET Portfolio of Retail funds
PSMALL Portfolio of small funds which TNA
< $10m.
SIF Social Investment Forum
SRI Socially Responsible Investments
S&P500 Standards and Poor’s 500
US United States
LIST OF TABLES
Table 1 - Summary statistics on fund portfolios and benchmark………....24 Table 2 - Performance estimates using the unconditional one-factor Model………..26 Table 3 - Performance estimates using the unconditional four-factor Model……….28 Table 4 - Performance estimates using the full conditional one-factor Model……...32 Table 5 - Performance estimates using the full conditional four-factor Model…...…34 Table 6 - Time-varying Carhart four-factor based performance estimates
considering NBER cycles………...…….38
Table 7 - Comparison of fund portfolios, which have TNA< $10mil. (PSMALL)
LIST OF APPENDIX
Appendix 1 - Summary statistics on individual funds.……….…..53 Appendix 2 - Performance estimates using the unconditional one-factor model……...56 Appendix 3 - Performances estimate using the unconditional four-factor model……..57 Appendix 4 - Performances estimate using the full conditional one-factor model…….59 Appendix 5 - Performances estimate using the full conditional four-factor model…....61 Appendix 6 - Time-varying Carhart four-factor based performance
estimates considering NBER cycles………64
1. Introduction
1.1. Socially responsible funds
Mutual funds have become one of the largest financial intermediaries in the leading world economies, currently controlling about US$26.6 trillion of investments in the world.1 The performance of mutual funds inevitably becomes of significant interest not only to individual/professional investors investing in funds, but also to academics. Thus, the performance evaluation of investment portfolios has been widely debated in the financial literature.
Moreover, the performance of socially responsible investments (SRI) has been receiving increasing interest in the academic literature. Accompanying this trend, a significant number of socially responsible mutual funds have grown faster than traditional mutual funds (Cortez et al., 2009); a central issue consists on whether the financial performance is sacrificed or not by taking into account social issues. “Socially responsible investing (SRI) is an investment process that considers the social and environmental consequences of investments, both positive and negative, within the context of rigorous financial analysis” (Sustainable and Responsible Investing, 2007). In other words, socially responsible investment is “a set of approaches which include social or ethical goals or constraints as more conventional financial criteria in decisions over whether to acquire, hold or dispose of a particular investment” (Cowton, 1999, p. 60).
Furthermore, concerns of social context are also increasingly patent in financial markets, with more and more investors seeking to invest according to their social and ethical values. An increasing number of investors are willing to invest for ethics into their investment decision (Renneboog et al., 2008).
SRI investment managers have three main strategies, which promote socially and environmentally responsible business practices and motivate positive impacts across the economy: screening, shareholder advocacy, and community investing (Social Investment Forum, 2007).
The screening strategy concerns socially responsible investments, which can use social screens (negative, positive, best-in-class) that reflect the social, religious or ethical values of investors, thus non-financial criteria is used in the investment process to decide on the inclusion and exclusion of securities. The negative screen implies the exclusion of companies that invest in socially undesirable business (tobacco, alcohol, gambling) and that are not consistent with social, environmental and ethical standards (unfair labour practices, child labour). The diversification problem appears in the negative screen where total sectors are excluded. The positive screen involves selecting companies with good practices in specific stakeholder-oriented issues (corporate governance, treatment of customers). The best-in-class screen is the best strategy, because it overcomes problems related to possible sector biases and loss of diversification that arise when using negative screens. It involves selecting the companies with the best practices in each sector. Managers of socially responsible mutual funds believe that they can make a long-term profit by selecting securities according to social screens. Investment analyses and decision-making processes incorporate positive, negative or best-in-class screening of environmental, social and governance (ESG) criteria in order to achieve portfolios with high ethical values.
The shareholders advocacy strategy (also known as shareholder activism) is a way in which shareholders can influence a corporation's behaviour by exercising their rights as owners (shareholder resolutions or active dialogue with companies).
The third approach, community investing, involves direct investment in local development initiatives.
The impacts of social screening on mutual fund performance are by definition explained by two conflicting arguments. First, the classical portfolio theory advocates that the addition of constraints will inhibit the creation of the optimal portfolio (Markowitz, 1952). The investments universe of selection is restricted in SRI, so investors will abdicate from the potential for diversification that an unconstrained portfolio shows, which will be translated into lower risk-adjusted returns (Rudd, 1981).
Moreover, a negative relationship is consistent with the neo-classic version of Friedman (1962) that sustains that social responsibility practices imply internalising additional costs, thus penalising corporate financial performance. Those funds could underperform compared with conventional portfolios. On the other hand, however, several arguments are put forward to support a positive relationship between corporate
The stakeholder theory considers that the integration of all stakeholders’ interests creates value for shareholders, thus resulting in a higher financial performance (Freeman, 1984). Furthermore, Kempf and Osthoof (2007) argue that SRI portfolios perform better then less responsible funds.
1.2. Retail and institutional funds
After the early 1990s, a successful new class of institutional funds was created that quickly won on popularity, more than retail funds (James and Karceski, 2006). In the fund industry, clients are sorted in two groups; “retail” which is a classification for serving individual clienteles, and “institutional” which regroups institutional investors. James and Karceski (2006) refer in their study that the selection of mutual funds by individual investors faces significant search and information costs; therefore they select their funds based on past performance, which will not precisely forecast future fund performance. Meanwhile, institutional investors base their investment decisions on more sophisticated selection criteria than individual investors do.
Concerning the fund selection ability, retail investors are considered as unsophisticated investors. On the other hand, institutional investors represent a more sophisticated type of clients. In accordance with Gruber’s terminology, the retail fund investors are classified as unsophisticated and viewed as individual investors (Del Guercio and Tkac, 2002; Palmiter and Taha, 2008). Institutional funds’ clients are seen as sophisticated investors or as investors who have account restriction or tax issues. The main focuses of institutional funds are on endowments, foundations, municipalities, pension funds, corporations, non-profit organisations and other large investors, including wealthy individuals. This explains the existing division in mutual funds for retail and institutional clients. Furthermore, institutional mutual fund clients tend to use more quantitatively sophisticated criteria, such as risk-adjusted returns measure and tracking error, so that they are able to prove stronger momentum-driven and herding behaviours and also less sensitive to fund expense ratio (Salganik and Scheiber, 2013).
Empirical papers, such as James and Karceski (2006), Salganik and Scheiber (2013), state that the performance between retail and institutional funds is not different from each other.
1.3.The purpose of the study
The purpose of this study is to provide a better insight into the performance of US socially responsible mutual funds in a (non) time-vary context in different states of the market, by the inclusion of public information variables. More precisely, this research aims to analyse whether there are differences between the performance of SRI retail funds and SRI institutional funds. To this end, several performance measures that are widely used in the literature are considered.
First, unconditional models (not time varying-context) are used, as the alpha of Jensen (1968) and the alpha based on the model of Carhart (1997). Empirical evidence on mutual fund performance indicates that multi-factor approaches are a much more useful characterisation of portfolio returns than single-index models (Elton et al., 1996; Carhart, 1997). Thus the application of the Carhart (1997) model is motivated by possible misspecification of the single-factor model. However, unconditional models are considered to be biased, because they produce incorrect performance estimates, since they can confound the normal variation in risk and risk premiums with manager’s performance. Aragon and Ferson (2008) state that the reasons for the biases estimates are that portfolio managers exhibit market-timing skills or engage in dynamic investment strategies resulting in time-varying risk. In order to overcome this limitation, the performance of portfolios is analysed based on a time-varying approach. Ferson and Schadt (1996) developed the partial conditional model, allowing the risk estimates to vary over time depending on economic conditions, with the inclusion of public information variables.
Second, this study only considers the full conditional model of Christopherson
et al. (1998). The decision to only present the results of the conditional model of
Christopherson et al. (1998) is due to the statement that those models are more robust, so alphas and betas vary over time; if only alphas are considered time-varying, it may lead to biased estimates of performance and risk (Ferson et al., 2008; Christopherson et
al., 1998). This model allows the variation of risk and performance over time, with the
inclusion of public information variables. Most empirical evidences are consistent on the fact that conditional models lead to better performance estimates then unconditional models (Cortez et al., 2009; Bauer et al, 2006; Bauer et al., 2007). Ferson and Schadt (1996) state that conditional models are more robust and provide slightly better
The study of Fama and French (1989) suggests that variables related to economic conditions are useful in predicting the returns of stocks and bonds.
Third, in order to get more robust results, a dummy variable is used to define the different market conditions (Moskowitz 2000; Kosowski 2011, Areal et al. 2013; Nofsinger and Varma (2014). Thus, the performance of the portfolio is measured in a time varying context under the NBER classifications.
Finally, the performance evaluation of small funds, which total net asset, is below $10.mil. is assessed. The total net asset of $10mil. will be used as reference to identify the smallest funds, as the study of Bollen (2007). A brief comparison with the portfolio of large funds, whose TNA exceeds $10.mil. is made. According to the literature, the size of the fund is a relevant factor to consider. Chen et al. (2004) state that fund size erodes performance due to liquidity and organizational diseconomies, especially funds investing in small and illiquid stocks.
Although the literature on SRI is growing, there are more SRI equity funds than SRI bond funds available in the Social Investment Forum; therefore I will choose to investigate SRI equity mutual funds. Another thing to point out is that European mutual funds have a lack of readily available fund classification compared to US mutual funds, therefore I decided to choose only equity domestic style and cap-based funds in the United States. The following questions will be answered through this master thesis:
Does the performance of US socially responsible mutual funds change in different market conditions?
1.2 The structure of the dissertation
This dissertation is organised into six sections. The first chapter consists on a brief introduction about the topic and the main objectives of the master’s thesis. The subsequent chapter focuses on the literature review about the performance of socially responsible investments, the performance of conventional retail and institutional funds and the funds’ performance under the NBER classifications. The methodology will be described in the third chapter, along with the models used to assess the SRI performance. The following chapter describes the data, which consists on US socially responsible mutual funds. Chapter five sums up the main results, including an analysis and discussion of the empirical results in terms of performance evaluation based on different methodologies. A main conclusion of the study will be presented in the last chapter, as well the limitations and suggestions for future research.
2. Literature Review
2.1 Introduction
This section presents the supporting literature review to the performed empirical results that will be reported later.
One of the objectives is to discuss the most important literature in relation to socially responsible funds. Additionally, only empirical evidence of conventional retail and institutional funds are presented, because there are no studies in the area of socially responsible investments, which compare both types of funds with each other.
Finally, several studies that used NBER business cycles to define different market regimes for socially responsible and conventional funds’ performance are discussed.
2.2 Performance of socially responsible investments
Cortez et al. (2009) mentioned in their study that the relationship between social and financial performance has been developed along three different approaches in numerous studies.
The first one consists on the difference between the performance of individual companies that have strong socially responsible performance and other companies with low SRI performance. Numerous studies have investigated the relationship between financial and corporate social performance. Since the study of Moskowitz (1972), some authors obtained the same statement that socially responsible investments are beneficial for the company. Moskowitz (1972) found evidence of a positive relationship between corporate social and financial performance, concluding that socially responsible companies are good investments. Companies with better social and environmental expertise can be identified trough the use of social criteria, by allowing them to choose better management skills and, therefore, a better future financial potential (Moskowitz, 1972). However, there is no definite consensus on the existence and nature of this relationship, this may result from the use of different methodologies, the limited samples
Most academic studies tend to show a positive relationship between corporate social responsibility and financial performance (Margolis and Walsh, 2001; Orlitzky et
al., 2003). These results, however, should be interpreted with caution, considering
several conceptual and methodological shortcomings that have been pointed out. Margolis and Walsh (2001) state that a company involves stakeholders and deals with their concerns, that it can signal capital market that managers are well skilled and therefore the company’s value will improve.
In the second approach estimations of the financial performance of indices of companies that are less socially responsible with conventional market are done (Sauer, 1997; Statman, 2006).
Finally, the last approach concerns the comparison of the performance of socially responsible mutual funds and their unscreened investments, such as conventional funds and indices (Cortez et al., 2009; Goldreyer et al., 1999).
Lately, socially responsible mutual funds have grown faster than traditional mutual funds, bringing up a central issue of whether or not socially responsible mutual funds have a similar performance to conventional mutual funds. According to Markowitz (1952), a portfolio should be diversified across industries. Consequently, two conflicting arguments appear when using socially responsible criteria on mutual fund performance: first, the modern theory suggests that portfolios built on omitting some sectors of stocks will lose diversification possibilities (Rudd, 1981), which may result in underperformance when compared with the conventional mutual fund over the long term. In addition, using various social screenings on mutual funds may weaken the fund managers’ incentive to pursue high risk-adjusted excess returns. Second, a negative relationship is consistent with the neo-classic version of Friedman (1962) that sustains that social responsibility practices imply internalising additional costs, thus penalising corporate financial performance, which reflect on lower returns. Those funds could underperform compared with conventional funds. Rudd (1981) argues that the investments universe of selection is restricted in socially responsible investments, which will be translated into lower risk-adjusted returns. Socially responsible mutual funds underperform the domestic conventional mutual funds in the US, the UK and in many European and Asia-Pacific countries by 2.2% to 6.5% (Renneboog et al., 2008a).
However, Drut (2010) states that investors can construct their bond portfolio by considering social screens, and there will not be any lack of diversification. D’Antonio
et al. (1997) are the first in academic literature suggesting that the concept of socially
responsible investing like screening for ESG criteria can be transferred from equity to bond investments. Furthermore, Kempf and Osthoof (2007) argue that SRI portfolios perform better.
In addition, Moskowitz (1972) reports that socially responsible mutual funds may attract investors by requiring managers’ requisite skills to run a superior company. As a result, socially responsible mutual funds might outperform non-screened funds, which means a positive relationship between corporate social responsibility and financial performance can appear. Moreover, several arguments are put forward to support a positive relationship between corporate social responsibility and financial performance. The stakeholder theory considers that the integration of all stakeholders’ interests creates value for shareholders, thus resulting in a higher financial performance (Freeman, 1984). In support of the above argument, Hill et al. (2007), and Kempf and Osthoff (2007) conclude that SRI portfolios benefit from improved performance in the long run. Kempf and Osthoof (2007) argue that SRI portfolios perform better then less responsible funds. They used the ratings of the Kinder Lydenberg Domini (KLD) (social responsibility based on annual data from 1991 to 2003, and used a strategy of buying shares of companies with high ratings and sell stocks of companies with low ratings. These ratings are defined according to qualitative criteria and exclusion criteria. As regards the qualitative criterion, the rule would include filters such as community relations, diversity, labour relationships, environment, human rights and product.
Meanwhile, some authors argue that there is no statistical difference between socially responsible mutual funds and non-socially responsible mutual funds, implying a neutral relationship. The above-mentioned empirical evidence concerns several studies that focus on different geographic areas. Goldreyer et al. (1999) and Hamilton et al. (1993) show that the performance of US socially responsible mutual funds are not statistically different from conventional funds. In those studies, the single-index framework is used as methodology and for this reason some limitations arise. For UK investment portfolios, Gregory et al. (1997) also show the conclusion above.
In an attempt to overcome some limitations that were identified in some earlier studies, Bauer et al. (2006), Bauer et al. (2007) and Cortez et al. (2009) apply multifactor models and conditional models as methodologies for more robust performance. They state that there is no statistical difference between the performance of SRI and conventional funds, meaning no underperformance in relation to unscreened funds. The three studies used different geographic areas: Bauer et al. (2006) on Australian funds, Bauer et al. (2007) on Canadian funds, Cortez et al. (2009) on European funds. Additionally, the performance estimates improved in conditional measures as conventional and socially responsible benchmarks are considered. They showed, on the one hand, a neutral performance of funds to both conventional and socially responsible benchmarks. On the other hand, they showed that the performance is better when funds are evaluated in relation to socially responsible benchmarks. Empirical evidence of time varying beta is stated in the conditional models used in the study of Cortez et al. (2009) but this is not the case for alpha. The financial performance is not sacrificed if the investor wishes to implement social screens in his investment decision.
2.3 Performance of conventional retail and institutional funds
According to the literature, James and Karceski (2006), Salganik and Scheiber (2013), state that performance between retail and institutional funds is not different from each other.
In the study of James and Karceski (2006), the performance evaluation is measured through the risk-adjusted five-factor model, which adds an international equities factor, similar to that used by Carhart (1997). They analyzed the differences in performance between retail and institutional funds during the time period of 1995 to 2001. James and Karceski (2006) showed that the performance between retail and institutional funds is not different from each other, despite significantly lower management expenses. Additionally, they studied cross-sectional differences in performance of institutional funds, by splitting them in proxies for the degree of investor oversight. Their results show that institutional funds before and after adjusting for risk and expenses perform significantly better than institutional funds with retail mates and funds with low initial investment requirements.
Salganik and Schreiber (2013) analysed the fund selection abilitily of institutional and retail fund investors from January 1999 to May 2009, to see which one of them is better. His results suggest that institutional fund investor do not demonstrate a better fund ability. They state that retail and institutional funds exhibit a negative, but not statistically significant. The performance is assessed through the unconditional Fama and French model and the Carhart (1997) model. Several studies report that mutual fund performance varies over business cycles (Moskowitz, 2000; Kosowski, 2006). They find that mutual funds outperform the market during recession periods, while underperforming during expansion periods. Salganik and Scheiber (2013) analysed the smart money effect for recession and expansion periods for both types of fund, according to the NBER business cycles. Both institutional and retail investors demonstrate no smart money effect in periods of recession, while showing a significant smart money effect during expansion periods. In other words, significant selection ability is demonstrated in expansion periods, but not in recession periods. The authors also state that the momentum factor differs over different business cycles.
Gallagher and Jarnecic (2003) studied the performance of australian-based open-end international funds by analysing retail and institutional funds separately. The performance evaluation is measured by computing the unconditional CAPM and the conditional model of Ferson and Schadt (1996). They state that average active fund (retail and institutional funds) does not outperform the benchmark.
In accordance with Gruber’s terminology, the retail fund investors are classified as unsophisticated and viewed as individual investors (Del Guercio and Tkac, 2002; Palmiter and Taha, 2008).
First, Del Guercio and Tkac (2002) studied the reaction of investors to the past performance of pension funds and funds investment, from 1985 to 1994, using the gross profitability and the Jensen’s alpha (1987). He considers institutional fund, namely pension fund sponsors that are professionals specialized in investment management, more sophisticated than retail fund investors. A better access to services of professional experts to institutional funds is provided through the economies of scale. Moreover, the economies of scale reduce more search costs for institutional investors than for individual investors. Institutional investors have access to larger assets, meaning that they have more opportunities of diversification.
Second, Palmiter and Taha (2008) concluded that individual investors are mostly ignorant and financially unsophisticated; because individual investors are unaware of the basic characteristics of the funds they invest in. Additionally, individual investors do not consider the risk and the costs associated with their fund investments, and chase past returns.
2.4. Performance of SRI/conventional funds according to NBER business cycles
Empirical papers, such as Moskowitz (2000), Kosowski (2006) and Glode’s (2011), suggest that conventional funds perform significantly better in recession periods than in expansion periods.
First, Moskowitz (2000) analysed two subsamples: the gross and net returns of funds across each quarter separately in order to test if they are driven by fund biases, such as window dressing or tax-motivated trading (conventional funds). Moskowitz (2000) used periods of expansion and recession according to NBER business cycles to define different market regimes while recomputing the performance measures. The results obtained by this computation shows underperformance during expansion periods and outperformance in recession periods. Additionally, he states that adjusting fund returns for size, value and momentum premia increase during recession rather than otherwise, as the average stock style measure indicates, suggesting that active managers deliver returns when investors need them the most.
Second, Kosowski (2011) states that the stylised fact of average mutual fund net return underperform in expansion periods and outperform in recession periods. Thus, funds have a negative and statistically significant performance in expansion periods and in recession periods it is the opposite as alpha is positive. Meanwhile, it means that when the investors' marginal utility of wealth is high, then in a recession period the unconditional performance model would minimise the supplement value by active mutual fund managers. He analysed the performance of the sample by using a full conditional model, where risk and return vary through time. The methodology used by Kosowski (2001) included a dummy variable based on the NBER business cycles. Kosowski (2011) and Moskowitz (2000) note that examination of the unconditional performance of mutual funds may not properly answer the question of how mutual funds perform under the NBER classifications.
Third, Glode (2011) analysed data on US funds and suggests that conventional funds underperform in expansion periods and outperform in recession periods. He states that the ability of active managers to deliver a superior performance during recession periods than during expansion periods could be explained by a strong investor demand for actively managed funds. Moskowitz (2000) and Glode (2011) state that while actively managed mutual funds tend to underperform unconditionally, they may be valuable to investors as they deliver superior returns during recession periods.
The results obtained by Areal et al. (2013) are in line with those obtained for conventional funds (Moskowitz, 2000; Glode, 2011; Kosowski, 2011), as they show underperformance during expansion periods.
Areal et al. (2013) analysed in their study the performance evaluation of US mutual funds employing different ethical criteria, such as religious and socially responsible and irresponsible criteria (sin funds), and used several models for this end. One was the use of periods of expansion and recession according to the National Bureau of Economic Research business cycles to define different market regimes, and the other was the use of an endogenous classification given by a Markov switching regime. They state that estimates of performance vary across different market conditions. On the one hand, Vice funds underperform in high-volatility regimes and outperform in low ones. Consequently, this result contradicts the “solid investment during recession”. On the other hand, SR and MR funds exhibit different performance across different market regimes. MR funds have a negative performance and show underperformance in high-volatility regimes, which contradicts Boasson et al. (2006) study of neutral performance.
Moskowitz (2000), Kosowski (2011), Areal et al. (2013) are examples of studies that also use NBER business cycles to define different market regimes.
Nofsinger and Varma (2014) analysed US socially responsible funds and their conventional patterns during crisis and non-crisis periods. The performance evaluation is measured by computing the return alphas of CAPM, Fama and French (1993) 3-factor model, and Carhart (1997) 4-factor model with the incorporation of two dummy variables that are based on the NBER classifications. They state a neutral relation of both samples and no differences between them. However, they conclude that SRI funds outperform conventional funds in crisis periods and underperform during non-crisis periods.
Moreover, the cost of underperforming during non-crisis periods comes from dampening of downside risk. Apparently, investors seeking downside protection would value the asymmetry of these returns, which are driven by funds focusing on environmental, social or governance (ESG) screens and use simultaneously positive screens. They analysed differences in performance across SRI foci and screening strategies in order to show possible boosters of results by using different classes of SRI investing strategies.
3. Methodology
3.1. Introduction
After the presentation of the literature review, this chapter proceeds with the presentation of the methodology, assessing the performance evaluation of socially responsible mutual funds.
First, the unconditional evaluation measures, the alpha of Jensen (1968) and the alpha of the four-factor of Carhart (1997) will be presented. As unconditional models do not consider time-varying risk and returns over time, they are considered to be biased, since their application may lead to incorrect performance estimates (Aragon and Ferson, 2008, p.118).
In this context, the Christopherson et al. (1998) full conditional model will be presented. Conditional models take into account publicly available information about the state of the economy to predict risk and returns. Farnsworth (1997) states that “a conditional performance evaluation approach refers to the measurement of performance of a managed portfolio taking into account the information that was available to investors at the time the returns were generated” (p. 23). In other words, the expected return and risk are allowed to vary over time with the state of the economy, which is measured using predetermined public information variables. Ferson and Schadt (1996), states that conditional models are more potent and that those estimates of performance are slightly better.
The application of the Carhart (1997) model is motivated by possible misspecification of the single-factor model. The multi-index models have a better ability to capture sources of systematic risk. Therefore, they only attribute to alpha performance the results from the ability of the fund manager. There is a general agreement in the literature that multifactor models are a much more useful characterisation of portfolio returns than single-index models (Elton et al., 1996; Carhart, 1997).
In order to get more robust results, the performance of the portfolio will be measured in a time varying context under the NBER classifications, a dummy variable will be used to define the different market conditions (Moskowitz, 2000; Kosowski, 2011; Areal
3.2. Unconditional Model
3.2.1. Jensen’s alpha (1968)
Jensen’s model (1968) is one of the traditional performance evaluation measures used by academics to assess the performance of investment portfolios. This measure is considered to be unconditional because it does not consider the variability of risk over time. The estimation of the Jensen model will serve mainly to compare the exposure of socially responsible funds with the benchmark.
The measure of performance will be based on Jensen's (1968) alpha, which is the intercept ( ) of the CAPM-based following regression:
(1)
where:
is the abnormal return of fund p (return above or below the CAPM equilibrium return implied by its level of systematic risk)
represents the systematic risk of fund p
is the excess return of fund p over period t
represents the excess return of the market over period t
3.2.2. Carhart’s alpha (1997)
A four-factor model will be implemented, i.e. the unconditional Carhart 4-factors model (1997), which includes three more variables: size factor (SML), book-to-value factor (HML) and momentum factor (MOM).
The Carhart four-factor model (1997) increases the risk, size, value and momentum factors in the performance evaluation. The application of the Carhart (1997) model is motivated by possible misspecification of the single-factor model. Multifactor models are a much more useful characterisation of portfolio returns than single-index models (Elton et al., 1996; Carhart, 1997).
The regression of the unconditional Carhart (1997) four-factor model is specified as follows:
(2) where:
(small minus big) is the difference in returns between a portfolio of small stocks and a portfolio of large stocks
(high minus low) is the difference in returns between a portfolio of high book-to-market stocks and a portfolio of low book-to-book-to-market stocks
(momentum) consist on the difference in return between a portfolio of past 1-year winners and a portfolio of past 1-year losers
are the factor coefficients (betas on each of the factors)
3.3. Conditional Models
3.3.1 The conditional model of Christopherson, Ferson and Glassman (1998)
Since the previous models do not consider time-varying risk and returns over time, they are considered to be biased because their application may lead to incorrect performance estimates (Aragon and Ferson, 2008, p.118). In reality, while measuring the performance, the expected return and risk vary through time.
Under these circumstances, unconditional models are considered to be biased, because they produce incorrect performance estimates, since they can confound the normal variation in risk and risk premiums with manager’s performance. The reasons for the biases estimates are that portfolio managers exhibit market timing skills or engage in dynamic investment strategies resulting in time-varying risk (Aragon and Ferson, 2008). If time-varying risk is ignored, performance estimates will be biased (Ferson and Schadt, 1996).
Ferson and Schadt (1996) propose a modification in the regression, where market prices and securities only reflect available and public information. They assumed a linear functional form for the changing beta of the managed portfolio, given the market
Meanwhile, Christopherson et al. (1998) extended the partial conditional model, where alpha and beta can vary through time according to the public information. They considered the temporal variability of performance and risk, hence known as the fully conditional model. In the same way that betas can be dynamic and change with market conditions, alphas may also be dynamic.
In this study only the full conditional model of Christopherson et al. (1998) is considered, therefore time-varying alphas and betas are included in the regression. Ferson et al. (2008) state that a time-varying alpha term should be included in the regression in order to obtain unbiased estimates of a conditional beta.
Christopherson et al. (1998) assumed the linear function from the conditional alphas, which are related to changes in public information:
(3)
where
is an average alpha
is a vector that measures the response of the conditional alpha to the information variables, thus is the sensitiveness of the conditional alpha to the information variables .
= -E(Z) is a vector of deviation of , from the unconditional average values;
is a vector that measures the response of the conditional beta to same information
variables and
is an average beta, which represents the unconditional mean of the conditional
betas.
Asset pricing models used time-varying variables that are also known as conditional models. They demonstrated that predetermined variables are statistically significant when the performance measure is changed.
Additionally, the mutual fund performance has a better aspect when public information controls for biases in traditional timing models are conditioned.
Ferson and Schadt (1996) used five public information variables: (1) Short term interest rate on Treasury (TB); (2) Dividend Yield (DY) of a market index; (3) Term Spread (TS), which is a measure of the slope of the term structures of interest rates; (4) Default Spread (DS) resulting from the difference between the yields of high risk bonds and low risk bonds; and (5) a variable dummy (D) for the month of January.
Replacing the market return by a set of factor returns, the equation above can be expressed as:
(4)
where:
is an average beta, which represents the unconditional mean of the conditional betas
is the vector of factor returns
In this master thesis, three public information variables of Ferson and Schadt (1996) will be used to explain the fund returns, the short term interest rate on treasury, the dividend yield of S&P500 index and the term spread. Gallagher and Jarnecic (2003) used in their study those three variables.
In this context, the full conditional model of a one-factor model is represented in the following way:
(5)
Empirical evidence from Elton et al. (1996) and Carhart (1997) shows that multifactor models are a much more useful characterisation of portfolio returns than single-index models.
The generalisation of the conditional approach to multi-factor models is straightforward.
The full conditional approach will be extended to a multifactor context, considering the risk factors of Carhart (1994) and the three public information variables mentioned before, which results in the following specification:
(6)
The conditional model can be extended to a multifactor approach. Kosowski et
al. (2006); Cortez et al. (2009); Bauer et al. (2006) and Bauer et al. (2007) used in their
study a conditional multi-factor model.
3.4. Time-varying Carhart (1997) four-factor based performance estimates considering NBER cycles
A last detail about the conditional models is that a dummy variable is implemented to the Carhart four-factor model to define different market conditions in order to deal with the time-varying risk issue (Moskowitz, 2000; Kosowski, 2011; Areal
et al., 2013; Nofsinger and Varma, 2014). The performance and risk estimates of the
sample will be analysed over expansion and recession periods according to the National Bureau of Economic Research (NBER).
In this context, considering the risk factors of Carhart (1994) and the dummy variable, results in the following specification:
(7)
Where the variable represents a dummy variable that assumes a value of 0 in periods of expansion and a value of 1 in periods of recession.
4. Data
In this chapter, the construction of the portfolios is explained in detail, together with the process of data selection. The sample comprises US open-end SRI equity domestic mutual funds during the period of January 2001 to September 2014.
First, socially responsible mutual funds are identified through the Social Investment Forum (SIF) from 2001 until 2012. Second, the data set is extracted from the Center for Research in Security Prices (CRSP) Survivor-Bias-Free US Mutual Fund Database. When selecting the funds included in this performance analysis, a number of requirements have been set up. In case the fund has several share classes, only the oldest one is considered. Further, only equity domestic cap-based and style funds are considered in the sample. In this paper, the performance evaluation between institutional and retail funds is compared. Finally, the CRSP’s classification of institutional and retail funds is used to identify the fund type.
For each fund, the following information is considered: monthly net returns, total net asset (TNA) and investment objective. Another important point to mention is that the survivorship biases approach is normally not affected. Each fund is required to have at least 24 monthly observations. Furthermore, funds that have started/ended during the time period or have been inconsistent with the previous reported requirements are excluded from the sample. The funds have been selected this way to achieve data consistency and increase comparability of the funds over the time period.
In total, the sample is composed of 92 SRI funds, but only 79 funds satisfy the previous requirements. Thus, 6 are non-surviving funds, 3 funds do not have the required monthly observations and 4 funds are equity domestic sector funds. The detailed information on the domestic equity funds is provided in the appendix 7.
Five portfolios are constructed; two of them are separately composed by different fund types, i.e. retail (PRET) and institutional (PINS) funds. The PRET portfolio includes 58 retail funds, while the PINS portfolio is composed by 18 institutional funds. Moreover, a portfolio of all the retail and institutional funds (PALL) is built, which includes 73 funds. SRI funds that have both funds types (3 funds) are included in the corresponding fund type portfolio. In addition to the composition of the PINS and PRET investment portfolios, a portfolio of the difference is built, called PDIFF (PRET – PINS), which reflects the differences between the performance of the
This portfolio will be useful to accomplish the main objective of the master thesis. For the construction of the portfolios indicated above, only funds whose monthly mean TNA exceed $10 million were included in this analysis, than the fund size could change the performance. According to the literature, the size of the fund is a relevant factor to consider. For instance, Chen et al. (2004) state that fund size erodes performance due to liquidity and organizational diseconomies, especially funds investing in small and illiquid stocks. The total net asset of $10mil. is used as referenz to identify small funds, as the study of Bollen (2007). The total sample is therefore composed of 73 funds (PALL), because 6 funds are excluded. Finally, a portfolio including all small funds (PSMALL) is constructed, in order to compare them to large funds (PALL).
An equally weighted portfolio and a value-weighted portfolio are taken into account in order to see if there are any differences between the two approaches. One fund cannot be considered in the value-weighted portfolio because it does not have TNA for all months.
The proxy that will be used for the market portfolio is the Standard & Poor’s 500 index 2 since it represents the US market.
Moreover, the other data, such as the 1-month risk free rate, risk premium, SMB factor, HML factor and MOM factor will be extracted from the website of Kenneth R. French3.
The publicly available information variables that will be considered are term spread, short-term rate and dividend yield. This data will be extracted from Datastream. The term spread will be measured through the difference between a constant 10-year US Treasury bond yield and a constant 3-month US Treasury bill yield. The dividend yield is based on the S&P500 Index. Finally, for the short-term rate the yield on a constant-maturity 3-month US Treasury bill will be used.
A potential problem that might appear is the bias resulting from the spurious regressions, because those variables have the tendency to be highly persistent. Therefore, the procedure of Ferson et al. (2003) is used to detrend these variables by 12-moving average. In order to minimise possible scale effects on the results, these series are used in their corresponding mean zero (Bernhardt and Jung, 1979).
2
The returns of the SRI mutual funds extracted from CRSP are already discretely computed, so no change will be done in order to maintain the consistency with the returns extracted from the database of Prof. Kenneth French.
The performance and risk estimates of the sample will be analysed over expansion and recession periods according to the National Bureau of Economic Research4 (NBER). During the period of 2001 and 2014, the National Bureau of Economic Research identifies a recession from March 2001 to November 2001 (8 months) and from December 2007 to June 2009 (18 months). A dummy variable with a value of one in recessions and a value of zero in expansions is included in all the Excel cells for the entire month during the whole time period.
Table 1 reports the main descriptive statistics for the excess returns of the portfolios and the market index. Equally weighted and value weighted portfolios are analysed, as well as the S&P500 index. All portfolios, including the market index, obtained a positive mean value, except for the EW and VW PDIFF. The value-weighted portfolios always have a higher mean excess return than the equally weighted portfolios. Moreover, all the portfolios and the S&P500 exhibit negative skewness and excess kurtosis, except for the VW PDIFF and EW PSMALL portfolios, which has a positive skewness. The normal distribution of the funds is clearly rejected, again except for the VW PDIFF.
The summary statistics for the individual SRI funds are presented in the appendix 1. Similar conclusions can be drawn in relation to the individual funds, except for 16 funds, which do not follow a normal distribution. All funds have a positive mean, negative skewness and excess kurtosis.
Table 1 Summary statistics on fund portfolios and benchmark
This table reports summary statistics for the equally weighted and value weighted portfolios of SRI funds and for the S&P500 index over the period from January 2001 to September 2014. Annualised mean excess returns and standard deviation are expressed in percentage. The results on the skewness, kurtosis, Jarque-Bera test, and the minimum and maximum excess returns are presented.
No Obs. Start date End date Mean SD Skewness Kurtosis JB test JB prob. Max Min
S&P500 165 1/31/01 9/30/14 1.84 16.07 -0.67 4.10 20.57 0.00 0.11 -0.17 EW PALL 165 1/31/01 9/30/14 1.41 13.13 -0.54 5.86 64.14 0.00 0.12 -0.16 VW PALL 165 1/31/01 9/30/14 1.63 14.48 -0.71 4.59 31.24 0.00 0.10 -0.16 EW PRET 165 1/31/01 9/30/14 1.41 13.32 -0.56 5.91 67.00 0.00 0.12 -0.16 VW PRET 165 1/31/01 9/30/14 1.63 14.44 -0.71 4.59 31.41 0.00 0.10 -0.16 EW PINS 165 1/31/01 9/30/14 1.05 10.38 -0.41 5.65 52.96 0.00 0.10 -0.12 VW PINS 165 1/31/01 9/30/14 1.33 16.62 -0.58 4.22 19.60 0.00 0.12 -0.18 EW PDIFF 165 1/31/01 9/30/14 -0.12 3.78 -0.30 5.17 3.48 0.00 0.04 -0.04 VW PDIFF 165 1/31/01 9/30/14 -0.18 4.60 0.28 3.47 3.71 0.16 0.03 -0.04 EW PSMALL 165 1/31/01 9/30/14 1.06 10.11 0.06 6.51 85.01 0.00 0.13 -0.10 VW PSMALL 165 1/31/01 9/30/14 1.65 16.30 -0.70 5.40 52.94 0.00 0.14 -0.19
5. Empirical Results
5.1. Introduction
In this chapter, the results obtained will be presented and analysed. The performance of the sample was analysed both at the individual fund level and at the aggregate level, using equally weighted and value-weighted portfolios for retail and institutional funds, and for both fund categories.
Finally, in the implementation of these linear regression models, the correction of White (1980) in case of existent heteroscedasticity and the procedure of Newey and West (1987) to correct the possible existence of autocorrelation heteroscedasticity were applied.
5.2. Unconditional models
First, the fund performance evaluation is started by using unconditional models. Both the one-factor CAPM model and the Carhart (1997) four-factor model are considered. Those two models do not consider time-varying risk and returns, and thus do not take into account publicly available information about the state of the economy to predict risk and returns (Aragon and Ferson, 2008, p. 118).
Despite the various limitations mentioned in the literature of the one-factor model, this model is still widely used to measure the exposure of a particular portfolio to a benchmark.
Table 2 summarises the CAPM-based performances estimates (alpha), systematic risk (beta) and the adjusted coefficient of determination of equally weighted and value weighted portfolios. The results suggest that equally weighted and value weighted portfolios are not able to outperform the market and exhibit a neutral performance.
Table 2 Performance estimates using the unconditional one-factor model
This table presents regression estimates for equally weighted (panel A) and value weighted (panel B) portfolios of Retail, Institutional funds and both category funds, obtained by the regression of the unconditional CAPM [2] with the S&P 500 market index during the period from January 2001 to September 2014. It reports performance estimates (alpha), systematic risk (beta) and the adjusted coefficient of determination (R2 adj.), expressed in percentage. Asterisks represent statistically significant coefficients at the 10% (*), 5% (**) and 1% (***) significance levels, and are based on the Newey and West (1987) procedure, which adjusts the errors of autocorrelation and heteroscedasticity, and on the White (1980) correction in case of heteroscedasticity.“HC”represents heteroskedasticity consistent and“HAC”represents heteroskedasticity and autocorrelation consistent. Positive (N+) and negative (N-) alphas of the number of individual funds are reported. The square bracket indicates the numbers of funds that are statistically significant.
α0 β0 Adj. R^2 HAC/HC
Panel A: Equally weighted
PALL 4E-05 0.7564*** 85.66% HC
PRET -4E-05 0.7726*** 86.83% HC
N - 58(7)
N + 58(5)
PINS 1E-05 0.5651*** 76.43% HAC
N - 18(0) N + 18(0) PDIFF -0.0014*** 0.2104*** 79.82% HAC Panel B: Value-weighted PALL -1E-05 0.8862*** 96.63% HC PRET -7E-06 0.8836*** 96.59% HC PINS -0.0014 1.0038*** 94.20% HC
According to the portfolio of differences, the EW institutional funds have a better performance than the EW retail funds; this difference is statistically significant at a 1% level. However, the value-weighted portfolio of differences shows no statistically significant alpha, so the hypothesis of the returns of the retail funds portfolio being equal to the returns of the institutional funds portfolio cannot be rejected. All equally weighted and value weighted portfolios (PALL, PRET and PINS) exhibit a neutral performance.
The systematic risk of the EW portfolios is always lower than those of the VW portfolios. Additionally, it is slightly less than 1, except for the PINS portfolio that is over 1. The beta of the EW PINS portfolio is lower than the EW PRET portfolio. However, it is the inverse for the VW portfolios.
The adjusted coefficient of determination is relatively high for equally weighted and value-weighted portfolios, meaning that the explanatory power of the model is high. Moreover, it is also always higher for value-weighted portfolios than for their equally weighted peers. The results suggest that the institutional fund portfolio has a lower adjusted coefficient of determination than the retail fund portfolio.
The individual funds present on average neutral performance, an inference that is consistent with most of the previous empirical evidence. Of the retail funds, 7 funds have a negative performance and 5 other funds have a positive performance. Meanwhile, the institutional funds all have a neutral performance. The fund with the highest adjusted coefficient of determination belongs to the PINS portfolio and has a value of 99.92%. The detailed information on the performance of the individual funds is provided in the appendix 2.
Given that multifactor models characterise better portfolio returns than single-index models (Elton et al., 1996; Carhart, 1997), the Carhart (1997) four-factor model will be used to assess the performance of the PALL, PINS and PRET portfolios. Thus, the application of the Carhart (1997) model is motivated by possible misspecification of the single-factor model.
The unconditional Carhart (1997) four-factor model includes three more risk factors as independent variables to the unconditional one-factor model of CAPM, thus small minus big (SMB), high minus low (HML) and momentum (MOM) factors are added.
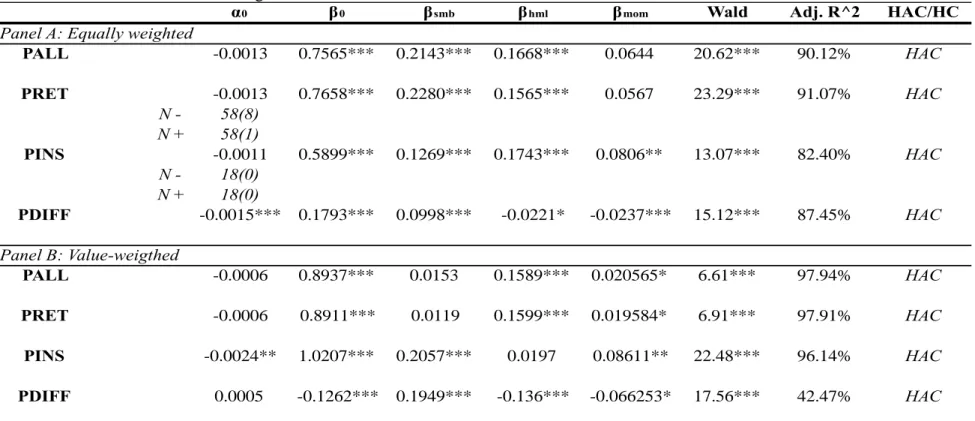
Table 3 Performances estimate using the unconditional four-factor model
This table presents regression estimates for equally weighted (panel A) and value weighted (panel B) portfolios of Retail, Institutional funds and both category funds, obtained by the regression of the unconditional Carhart (1997) [2] with the S&P 500 market index during the period from January 2001 to September 2014. It reports performance estimates (alpha), systematic risk (beta) and the adjusted coefficient of determination (R2 adj.), expressed in percentage. Additionally, the regressions coefficients of Size, Value and Momentum factors are reported. Wald corresponds to the hypothesis of factors additional to the market factor being jointly equal to zero.
Asterisks represent statistically significant coefficients at the 10% (*), 5% (**) and 1% (***) significance levels, and are based on the Newey and West (1987) procedure, which adjusts the errors of autocorrelation and heteroscedasticity, and on the White (1980) correction in case of heteroscedasticity. “HC”represents heteroskedasticity consistent and“HAC”represents heteroskedasticity and autocorrelation consistent. Positive (N+) and negative (N-) alphas of the number of individual funds are reported. The square bracket indicates the numbers of funds that are statistically significant.
α0 β0 βsmb βhml βmom Wald Adj. R^2 HAC/HC
Panel A: Equally weighted
PALL -0.0013 0.7565*** 0.2143*** 0.1668*** 0.0644 20.62*** 90.12% HAC PRET -0.0013 0.7658*** 0.2280*** 0.1565*** 0.0567 23.29*** 91.07% HAC N - 58(8) N + 58(1) PINS -0.0011 0.5899*** 0.1269*** 0.1743*** 0.0806** 13.07*** 82.40% HAC N - 18(0) N + 18(0) PDIFF -0.0015*** 0.1793*** 0.0998*** -0.0221* -0.0237*** 15.12*** 87.45% HAC Panel B: Value-weigthed PALL -0.0006 0.8937*** 0.0153 0.1589*** 0.020565* 6.61*** 97.94% HAC PRET -0.0006 0.8911*** 0.0119 0.1599*** 0.019584* 6.91*** 97.91% HAC PINS -0.0024** 1.0207*** 0.2057*** 0.0197 0.08611** 22.48*** 96.14% HAC PDIFF 0.0005 -0.1262*** 0.1949*** -0.136*** -0.066253* 17.56*** 42.47% HAC
As shown in the table, all portfolios present a neutral performance, except for the VW PINS portfolio, which exhibits a negative statistically significant alpha at a 1% level.
According to the portfolio of differences, EW institutional funds have a better performance than EW retail funds; this difference is statistically significant at a 1% level. However, the value-weighted portfolio of differences shows again no statistically significant alpha, so there is no difference in returns between retail and institutional fund portfolios. There is clearly a difference between PINS and PRET portfolios in relation to the additional risk factors. The HML factor of the EW portfolio of differences is negative and statistically significant, which means that institutional funds invest more in stocks with high book-to-market (value stocks) than retail funds. It may also be noted that the SMB factor of the portfolio of differences is positive and statistically significant, meaning that PINS is more exposed to lower capitalisation than PRET. Additionally, beta three is negative and statistically significant, which means that PINS is more exposed to the momentum factor than PRET.
The EW PRET, PINS and VW PRET portfolios have a neutral performance. However, the VW PINS portfolio has a negative and statistically significant performance.
The null hypothesis of Wald that the SMB, HML and MOM coefficients are jointly equal to zero is rejected for the equally weighted and value weighted portfolios.
The results of the systematic risk maintain that EW portfolios are lower than those of the VW portfolios. Additionally, it is slightly less than 1, except for the PINS portfolio, which is over 1. The beta of the EW PINS portfolio is lower than the EW PRET. However, it is the inverse for the VW portfolio.
The adjusted coefficient of determination is relatively high for equal-weighted and value-weighted portfolios. These values can be considered very high and acceptable, which allows us to draw the conclusion about the explanatory power of the model. After applying the Carhart (1997) model, the adjusted coefficient of determination is always higher for value-weighted portfolios than for their equally weighted peers. The results suggest that the institutional fund portfolio has a lower adjusted coefficient of determination than the retail fund portfolio.