Engineering
ISSN: 1809-4430 (on-line)
_________________________
1 Paraná Federal Institute (IFPR), Foz do Iguaçu-PR, Brazil.
3Federal Technological University of Paraná (UTFPR), Medianeira-PR, Brazil. 4Federal Technological University of Paraná (UTFPR), Santa Helena-PR, Brazil.
TEMPORAL VARIABILITY IN ACTIVE REFLECTANCE SENSOR-MEASURED NDVI IN SOYBEAN AND WHEAT CROPS
Doi:http://dx.doi.org/10.1590/1809-4430-Eng.Agric.v37n4p771-781/2017
HUMBERTO M. BENEDUZZI1, EDUARDO G. SOUZA2*, CLAUDIO L. BAZZI3,
KELYN SCHENATTO4
2*Corresponding author.Western Paraná State University (UNIOESTE), Cascavel - PR, Brazil.
E-mail: [email protected]
ABSTRACT: Optimization of N management is one of the great challenges to be overcome in
grain production, as it is directly related to productivity and can also cause environmental damage. Precision agriculture aims to solve this problem by applying nitrogen fertilizer at varying rates. Reflectance sensors are instruments capable of estimating N needs in various crops, including grain crops. However, it is not clear how these sensors perform under varying solar radiation and cloud cover, due to a lack of research on their temporal variability. Thus, this study examined the temporal variability of the NDVI (normalized difference vegetation index), as measured by an active reflectance sensor, in both soybean and wheat crops. The NDVI data were collected using a GreenSeeker sensor every 15 minutes over 12 or 14 consecutive hours. Incident solar radiation was recorded using an Instrutherm MES-100 pyranometer. In all experiments in soybean and wheat, NDVI was negatively influenced by irradiation, showing higher values at the beginning and end of the day. Changes in cloud cover also affected NDVI values during the experiments.
KEYWORDS: precision agriculture, remote sensing, vegetation index, NDVI
INTRODUCTION
Optimizing N management remains one of the greatest challenges in grain production. Because productivity is directly related to N availability (BARRACLOUGH et al., 2010), N is often applied in excess (DELLINGER et al., 2008, SCHMIDT et al., 2011), causing financial losses and environmental damage due to leaching and groundwater contamination (BURKART & JAMES, 1999; HONG et al., 2007).
Among the technologies used in precision agriculture is the application of fertilizer at varying rates, in which the appropriate amount of fertilizer is identified and applied at each point of the cultivated area (THRIKAWALA et al., 1999; MULLA, 2013; SAPKOTA et al., 2014). This approach can not only increase productivity but also reduce its environmental impact (SCHARF et al., 2011; LI et al., 2014).
Reflectance sensors are a type of instrument that can estimate the N needs of various types of crops, including grain crops (SCHMIDT et al., 2009; WINTERHALTER et al., 2013). These types of instruments have logistical and economic advantages since they can be used to rapidly cover large areas, quickly generating results at a lower cost compared to other techniques (SCHARF et al., 2002, SCHARF et al., 2011).
To confront this challenge, this work investigated the changes in the measurements made by an active reflectance sensor in soybean and wheat crops during different times of day, with consequent variation in solar radiation and cloud cover.
MATERIAL AND METHODS
This research was conducted in soybean and wheat fields at different stages of development in an agricultural area located outside of the city of Céu Azul - Paraná state - Brazil, whose
approximate central geographic location is 25°06'32” S, 53°49'55” W. The average altitude of this area is 752 m, and the area comprises approximately 15.5 ha on a soil classified as a typic Dystroferric Red Latosol (EMBRAPA, 2013). The area has been cultivated using no-till practices for over 10 years in a rotation of soybean, wheat, corn and oat crops grown for commercial purposes.
Data relating to soybean (variety Dom Mario 5958 RR2) were collected in the R1 and R2 stages, while the data for wheat (variety Catuara) were obtained in stages V3, V8 and V10.5. In the soybean, the R1 stage indicates the beginning of the reproductive phase, and this is marked by the beginning of bloom, when plants have at least one open flower at any node. At the R2 stage full bloom occurs, with an open flower in one of the last two stem nodes with fully developed leaf (EMBRAPA, 2007). The wheat in V3 stage presents tillers formed and spiral wound sheets. At the V8 stage the flag leaf is visible, but still curled or rolled up. The V10.5 indicates the end of the heading stage, when the plants presents all the ears outside the sheaths (EMBRAPA, 2014).
To collect normalized difference vegetation index (NDVI) data, a GreenSeeker 505 active optical sensor was used. This sensor detects electromagnetic radiation in the (visible) red wavelength of 656 nm and in the near-infrared at 774 nm (NTECH, 2008). The NDVI is then calculated using the following equation:
(1)
where,
NIR is the radiation reflectance measured by the sensor in the near-infrared wavelength, and
RED is the radiation reflectance measured by the sensor in the red wavelength.
Incident solar radiation (or irradiation) measurements were performed with an Instrutherm MES-100 pyranometer. The incident radiation parameter was used to estimate the influence of clouds in each of the data collection periods. We used the ITI (instantaneous transparency index), proposed by SOUZA et. al. (2006), which aims to indicate the percentage of incident radiation of expected irradiation for a given time.
The ITI was calculated using the methodology developed by SOUZA et al. (2006), according to [eq. (2)]:
(2)
where,
I is the expected theoretical radiation, and
I0 is the real radiation measured by the pyranometer at the same time.
To estimate the theoretical radiation for the date of data collection within each plant growth stage, a polynomial regression function was developed for each day. This function was based on actual radiation values measured during periods without clouds.
(3)
where,
Vn is the normalized value for a particular sample, found by dividing the sample value by the average sample value;
V is the value of the variable in case I, and
j represents the number of cases.
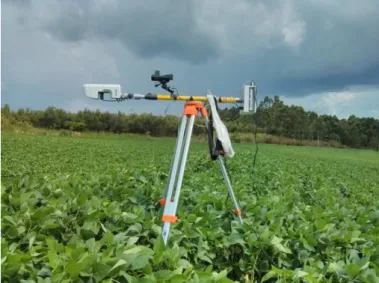
Data were collected using the same methods for both wheat and soybean. Data were collected with a stationary GreenSeeker sensor positioned parallel to the ground, with the same position maintained throughout the day (Figure 1). Preliminary tests were conducted to ensure that the support used did not influence sensor readings. The sensor was maintained at a distance of 80 cm from the crop canopy, which was within the range recommended by the instrument manufacturer (NTECH, 2008).
FIGURE 1. GreenSeeker sensor mounted on soybean in R1 stage
The times used for the beginning and end of data collection took into account the time of year in order to capture the entire insolation period. In soybean, this period was from 7 am to 9 pm, and in wheat, it was 7 am to 7 pm. During each stage researched, measurements were performed every 15 minutes. Thus, the data were always collected at minutes 0, 15, 30 and 45 of each hour. The NDVI values obtained for each sample were composed of the average of 100 readings taken by the GreenSeeker sensor continuously over 10 seconds.
Analyzing the influence of crop row orientation on vegetation indices, SOUZA et al. (2004) concluded that NDVI variability increased when crops were sown in north-south rows. Thus, in this experiment, data collection was carried out on crops growing in north-south rows. The GreenSeeker sensor was positioned over the row, perpendicular to sunrise and sunset, with the front facing north. Soon after data collection with the GreenSeeker, a pyranometer positioned above the sensor was used to measure incident radiation.
Data collected in the field were statistically analyzed through exploratory analysis. Coefficients of variation (CV) were ranked according to PIMENTEL & GARCIA (2002). CVs
≤ 10% were deemed low (homoscedastic), while 10% < CV ≤ 20% was average, 20% < CV ≤ 30%
coefficient of determination (adjusted R2) was used as a selection criterion of the best model among all possible subsets (MONTGOMERY et al., 2012).
The following model (Equation 4) was defined by exploratory analysis conducted using data from soybean, and it assumes that the dependent variable, NDVI, is influenced by the developmental stage of the crop, solar irradiation and irradiation * ITI.
NDVI = a + b*stage + c*irr + d*(irr*ITI) (4)
where,
a, b, c, d are parameters generated by the multiple regression model,
stage represents the developmental stage of the crop,
irr is the irradiance (W m-2), and
ITI refers to the instantaneous transparency index.
The model defined by exploratory data analysis for wheat (Equation 5) indicates that NDVI as a dependent variable is influenced by the stage of development of the crop, solar irradiation, ITI and ITI*ITI.
NDVI = a + b*stage + c*irr + d*ITI + e*ITI2 (5)
where,
a, b, c, d and e are the parameters generated by the multiple regression model,
stage represents the developmental stage of the crop,
irr is irradiance (W m-2), and
ITI is the instantaneous transparency index.
RESULTS AND DISCUSSION
Soybean
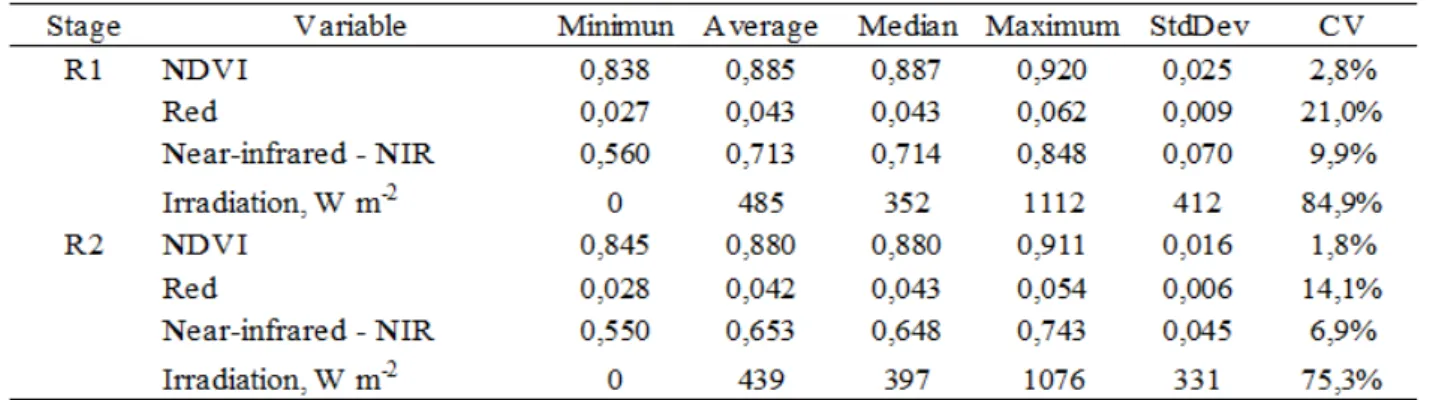
The NDVI coefficients of variation determined in soybean stages R1 and R2 were 2.8% and 1.8%, respectively, which can be considered low (Table 1). The variability of NDVI was significantly smaller than the variability of its constituent bands, what is to be expected (TUCKER, 1979; PINTER et al., 1985). The red band (656 nm) showed a much higher coefficient of variation than that for the near-infrared band (774 nm).
TABLE 1. Descriptive statistics for the data grouped by soybean stage.
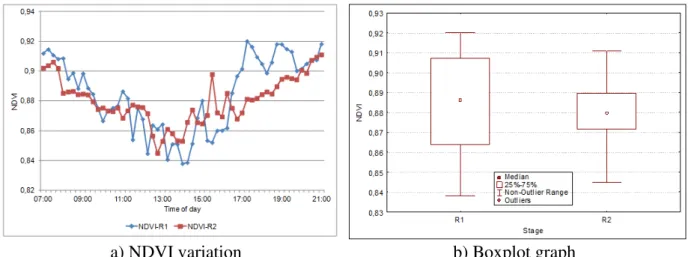
values in the R1 stage than in the R2 stage, which indicates that as crop development continues, NDVI variability decreases (Table 1, Figures 2a and 2b).
a) NDVI variation b) Boxplot graph
FIGURE 2. a) Variation in NDVI throughout the day for each soybean stage; b) Boxplot graphics for NDVI grouped by stage.
The R2 values obtained for the theoretical irradiation fitting curve for the R1 and R2 soybean
stages were greater than 99%. The ITI was calculated as a function of the time of day (Figures 3a and 3b). Irradiation was further reduced by cloud cover during the experiment in R2 stage compared with R1.
a) R1 Stage b) R2 Stage
FIGURE 3. Measured irradiation, theoretical irradiation and instantaneous transparency index (ITI) for R1 (a) and R2 (b) soybean development stages.
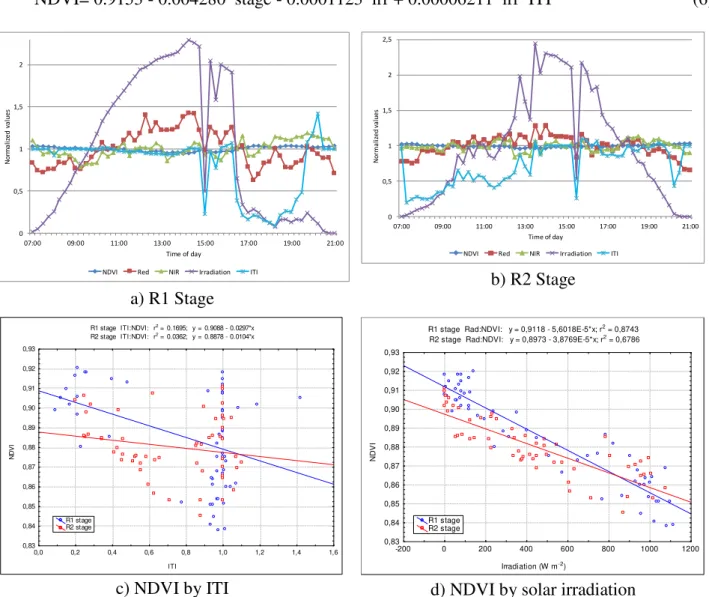
Comparing Figures 2a and 4a, it can be seen that during the experiment on R1 stage, at approximately 15:00, a sharp drop in irradiation occurred, with a simultaneous and marked increase in NDVI, indicating a clear association between these two variables. This can also be seen in the experiment on R2 stage, by comparing the graphs in Figures 2a and 4b, particularly at 15:30, when again, a sharp drop in irradiation occurs together with a peak in NDVI. The variation of the solar radiation throughout the day affected the red band more than the near-infrared band (Figures 4a and 4b). In addition, sudden changes in cloud cover captured by ITI also held more influence over the red band. This response agrees with what SOUZA et. al. (2006) have shown.
The NDVI was inversely correlated with ITI (Figure 4c) and irradiation (Figure 4d), in both
stages. From the model that was produced from regression analysis (Equation 6), the R2 value was
variables suggests that additional research may need to consider other variables, such as temperature and humidity.
NDVI= 0.9153 - 0.004280*stage - 0.0001123*irr + 0.00006211*irr*ITI (6)
0 0,5 1 1,5 2
07:00 09:00 11:00 13:00 15:00 17:00 19:00 21:00
N o rm a li ze d v a lu e s
Time of day
NDVI Red NIR Irradiation ITI
a) R1 Stage
0 0,5 1 1,5 2 2,5
07:00 09:00 11:00 13:00 15:00 17:00 19:00 21:00
N o rm a li ze d v a lu e s
Time of day
NDVI Red NIR Irradiation ITI
b) R2 Stage
R1 stage ITI:NDVI: r2 = 0.1695; y = 0.9088 - 0.0297*x
R2 stage ITI:NDVI: r2 = 0.0362; y = 0.8878 - 0.0104*x
ITI
N
D
V
I
0,0 0,2 0,4 0,6 0,8 1,0 1,2 1,4 1,6 0,83 0,84 0,85 0,86 0,87 0,88 0,89 0,90 0,91 0,92 0,93 R1 stage R2 stage
c) NDVI by ITI
R1 stage Rad:NDVI: y = 0,9118 - 5,6018E-5*x; r2 = 0,8743
R2 stage Rad:NDVI: y = 0,8973 - 3,8769E-5*x; r2 = 0,6786
Irradiation (W m-2)
N
D
V
I
-200 0 200 400 600 800 1000 1200
0,83 0,84 0,85 0,86 0,87 0,88 0,89 0,90 0,91 0,92 0,93 R1 stage R2 stage
d) NDVI by solar irradiation
FIGURE 4. NDVI, red, near-infrared (NIR), irradiation and instantaneous transparency index (ITI) as a function of time of day during R1 (a) and R2 (b) stages of soybean development (normalized data); NDVI as a function of ITI (c); Correlation between NDVI and solar irradiation (d).
Wheat
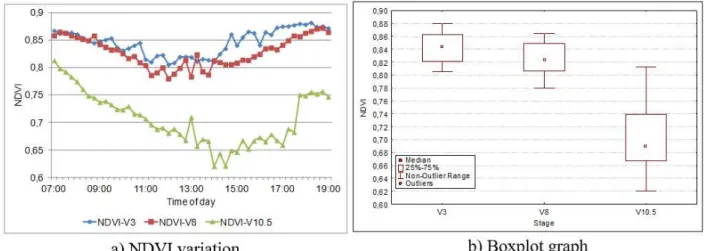
In wheat, the NDVI coefficients of variation recorded in stages V3, V8 and V10.5 were 2.8%, 3.3% and 6.8%, respectively. The rise in variability as the season progressed contrasts with the trend observed in soybean. Furthermore, the average NDVI values were lower in later stages (Table 2, Figure 5b). The decline in NDVI in stage V10.5 can be partially explained by the attenuation of the green tint inherent to a maturing wheat crop, which in turn causes increased reflectance in the red band. Nonetheless, the reason why the NDVI in V8 stage was less than that for V3 was not clear.
TABLE 2. Descriptive statistics for the data grouped by wheat stage.
In all three wheat experiments, the NDVI values were higher at the beginning and end of the day, similar to what was observed in soybean. In stage V10.5, NDVI was well below that recorded in the other two stages; it also fell more quickly with each passing hour, followed by a sharp rise at the end of the day (Figure 5a).
FIGURE 5. a) Variation in NDVI throughout the day for each stage; b) Boxplots for NDVI grouped by wheat stage.
0 0,2 0,4 0,6 0,8 1 1,2 1,4 0 200 400 600 800 1000
07:00 09:00 11:00 13:00 15:00 17:00
In st a n ta n e o u s T ra n sp a re n c y In d e x Ir ra d ia ti o n ( W m -2)
Measured Irradiation Theoretical Irradiation ITI
a) V3 Stage
0,0 0,2 0,4 0,6 0,8 1,0 1,2 0 200 400 600 800 1000
07:00 09:00 11:00 13:00 15:00 17:00
In st a n ta n eo u s Tr a n sp a ren cy In d ex Ir ra d ia ti o n ( W m -2)
Measured Irradiation Theoretical Irradiation ITI
b) V8 Stage
0,0 0,2 0,4 0,6 0,8 1,0 1,2 1,4 0 200 400 600 800 1000
07:00 09:00 11:00 13:00 15:00 17:00
In st a n ta n e o u s T ra n sp a re n c y In d e x Ir ra d ia ti o n ( W m -2)
Measured Irradiation Theoretical Irradiation ITI
c) V10.5 Stage
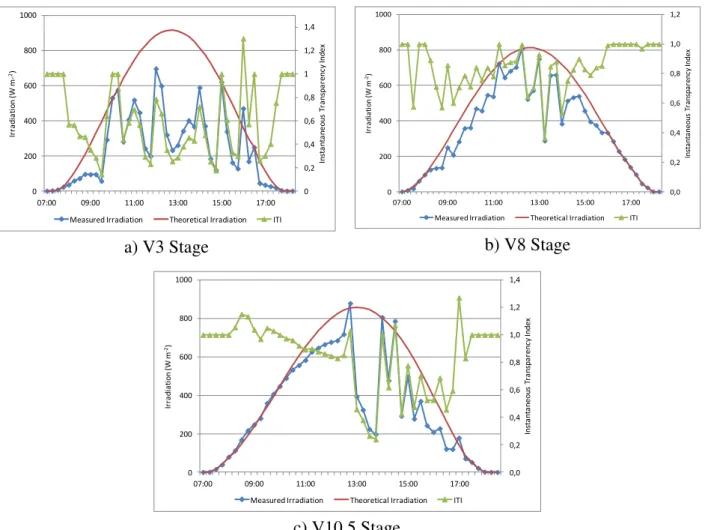
FIGURE 6. Measured irradiation, theoretical irradiation and instantaneous transparency index (ITI) for V3 (a), V8 (b) and V10.5 (c) wheat development stages.
In wheat, the variation in the solar radiation throughout the day also affected the red band more than near-infrared band (Figures 7a, 7b and 7c), similar to what was observed in soybean. Abrupt changes in cloud cover, indicated by the ITI readings, also held more influence over the red band.
The NDVI was inversely correlated with irradiation (Figure 8b) in all three stages, and it showed a direct correlation with ITI only in stage V10.5 (Figure 8a). The regression model (Equation 7) had an R2 value of 0.803; i.e., 80.3% of the variability in NDVI could be explained by the developmental stage of the crop, irradiation and ITI. Again, the fact that the variability of NDVI cannot be explained by these variables indicates the need for studies that also consider other variables, such as temperature and humidity.
NDVI = 0.871578 - 0.076001*stage - 0.000100*irr + 0.231785*ITI - 0.114141*ITI2 (7)
0 0,5 1 1,5 2 2,5 3
07:00 09:00 11:00 13:00 15:00 17:00 19:00
N o rm a liz e d v a lu e s
Time of day
NDVI Red NIR Irradiation ITI
a) V3 Stage
0 0,5 1 1,5 2 2,5
07:00 09:00 11:00 13:00 15:00 17:00 19:00
N o rm a liz e d v a lu e s
Time of day
NDVI Red NIR Irradiation ITI
0 0,5 1 1,5 2 2,5 3
07:00 09:00 11:00 13:00 15:00 17:00 19:00
N o rm a liz e d v a lu e s
Time of day
NDVI Red NIR Irradiation ITI
c) V10.5 Stage
FIGURE 7. Normalized data collected in wheat V3 (a), V8 (b) and V10.5 (c) stages: NDVI, red, near-infrared, irradiation and ITI.
V3 stage ICI:NDVI: y = 0,8366 + 0,012*x; r2
= 0,0261 V8 stage ICI:NDVI: y = 0,8116 + 0,0154*x; r2
= 0,0089 V10.5 stage ICI:NDVI: y = 0,6243 + 0,0942*x; r2
= 0,2431 IT I N D V I
0,0 0,2 0,4 0,6 0,8 1,0 1,2 1,4 1,6
0,60 0,62 0,64 0,66 0,68 0,70 0,72 0,74 0,76 0,78 0,80 0,82 0,84 0,86 0,88 0,90 V3 stage V8 stage V10.5 stage
a) NDVI by ITI
V3 stage Rad:NDVI: y = 0,8641 - 8,5307E-5*x; r2
= 0,5979 V8 stage Rad:NDVI: y = 0,8612 - 0,0001*x; r2
= 0,9498 V10.5 stage Rad:NDVI: y = 0,7376 - 0,0001*x; r2
= 0,2944
Irradiation (W m-2
)
N
D
V
I
-100 0 100 200 300 400 500 600 700 800 900 1000
0,60 0,62 0,64 0,66 0,68 0,70 0,72 0,74 0,76 0,78 0,80 0,82 0,84 0,86 0,88 0,90 V3 stage V8stage V10.5 stage
b) NDVI by solar irradiation
FIGURE 8. NDVI as a function of ITI (a); Correlation between NDVI and solar irradiation (b)
CONCLUSIONS
NDVI values measured by the GreenSeeker sensor on soybean and wheat crops throughout the day were negatively influenced by irradiation and were higher in the early morning and at the end of the day. The NDVI was also affected by changes in cloud cover during the experiments, which had a positive influence on the values for wheat but a negative influence on the values for soybean. Among the variables studied, solar irradiation best explained the variation in NDVI for both crops.
REFERENCES
Barraclough PB, Howarth JR, Jones J, Lopez-Bellido R, Parmar S, Shepherd CE, Hawkesford MJ (2010) Nitrogen efficiency of wheat: genotypic and environmental variation and prospects for improvement. European Journal of Agronomy 33(1):1-11.
Burkart MR, James DE (1999) Agricultural nitrogen contribution to hypoxia in the Gulf of Mexico. Journal of Environmental Quality 28(3):850-859.
Dellinger AE, Schmidt JP, Beegle DB (2008) Developing Nitrogen Fertilizer Recommendations for Corn Using an Active Sensor. Agronomy Journal 100(6):1546-1552.
EMBRAPA - Empresa Brasileira de Pesquisa Agropecuária (2007) Ecofisiologia da Soja. Londrina, Embrapa. (Circular Técnica 48)
EMBRAPA - Empresa Brasileira de Pesquisa Agropecuária (2013) Sistema brasileiro de classificação de solos. Brasília, Embrapa. 3 ed.
EMBRAPA - Empresa Brasileira de Pesquisa Agropecuária (2014) Informações Técnicas para Trigo e Triticale - Safra 2015. Brasília, Embrapa.
Erdle K, Mistele B, Schmidhalter U (2011) Comparison of active and passive spectral sensors in discriminating biomass parameters and nitrogen status in wheat cultivars. Field Crops Research 124(1):74-84.
Hong N, Scharf PC, Davis JG, Kitchen NR, Sudduth KA (2007) Economically optimal nitrogen rate reduces soil residual nitrate. Journal of Environmental Quality 36(2):354-362.
Kipp S, Mistele B, Schmidhalter U (2014) The performance of active spectral reflectance sensors as influenced by measuring distance, device temperature and light intensity. Computers and
Electronics in Agriculture 100:24-33.
Li F, Miao Y, Feng G, Yuan F, Yue S, Gao X, Liu Y, Liu B, Ustin SL, Chen X (2014) Improving estimation of summer maize nitrogen status with red edge-based spectral vegetation indices. Field Crops Research 157:111-123.
Montgomery DC, Peck EA, Vining GG (2012) Introduction to linear regression analysis. New York, John Wiley & Sons, 5 ed. 672p.
Mulla DJ (2013) Twenty five years of remote sensing in precision agriculture: Key advances and remaining knowledge gaps. Biosystems Engineering 114(4):358-371.
NTech Industries (2008) GreenSeeker model 500 series datasheet. Available:
http://www.ssmgps.com/pdf/DataSheet_Model_500_GS_Sensor.pdf. Accessed: Nov 21, 2014.
Oliveira LF, Scharf PC (2014) Diurnal variability in reflectance measurements from cotton. Crop Science 54(4):1769-1781.
Pimentel FG, Garcia GH (2002) Estatística aplicada a experimentos agronômicos e florestais. Piracicaba, Biblioteca de Ciências Agrárias Luiz de Queiroz, 307p.
Pinter PJ, Jackson RD, Ezra CE (1985) Sun-angle and canopy-architecture effects on the spectral reflectance of six wheat cultivars. International Journal of Remote Sensing 6(12):1813-1825.
Sapkota TB, Majumdar K, Jat ML, Kumar A, Bishnoi DK, Mcdonald AJ, Pampolino M (2014) Precision nutrient management in conservation agriculture based wheat production of Northwest India: Profitability, nutrient use efficiency and environmental footprint. Field Crops Research 155:233-244.
Scharf PC, Schmidt JP, Kitchen NR, Sudduth KA, Hong SY, Lory JA, Davis JG (2002) Remote sensing for nitrogen management. Journal of Soil and Water Conservation 57(6):518-524.
Scharf PC, Kitchen NR, Sudduth KA, Lory JA Stevens WG Oliveira LF, Shannon DK Palm H, Davis JG, Vories ED, Dunn DJ, Jones AJ (2010) Precision nitrogen fertilizer management of maize and cotton using crop sensors. In: World Congress of Soil Science, Soil Solutions for a Changing
World, Brisbane. Proceedings…
Scharf, P. C.; Shannon, D. K.; Palm, H. L.; Sudduth, K. A.; Drummond, S. T.; Kitchen, N. R.; Mueller, L. J.; Hubbard, V. C.; Oliveira, L. F. (2011) Sensor-based nitrogen applications out-performed producer-chosen rates for corn in on-farm demonstrations. Agronomy Journal 103(6):1683-1691.
Schmidt J, Beegle D, Zhu Q, Sripada R (2011) Improving in-season nitrogen recommendations for maize using an active sensor. Field Crops Research 120(1):94-101.
Souza EG, Orlando GA, Uribe-Opazo MA, Silva ED, Scharf P (2004) Influência da direção de semeadura do milho nas variáveis reflectância e índice de vegetação verde normalizado. Revista Brasileira de Engenharia Agrícola e Ambiental 8(1):79-84.
Souza EG, Scharf PC, Sudduth KA, Hipple JD (2006) Using a field radiometer do estimate
instantaneous sky clearness. Revista Brasileira de Engenharia Agrícola e Ambiental 10(2):369-373.
Souza EG, Scharf PC, Sudduth KA (2010) Sun Position and Cloud Effects on Reflectance and Vegetation Indices of Corn. Agronomy Journal 102(2):734-744.
STATSOFT. Statistica for windows. V. 12.0. Tulsa, StatSoft. Available: http://www.statsoft.com. Accessed: Sep 10, 2014.
Swindell J (1997) Mapping the spatial variability in the yield potential of arable land through GIS analysis of sequential yield maps. In: European Conference on Precision Agriculture, Warwick.
Proceedings… Oxford, Bios Scientific, p827-834.
Thrikawala S, Weersink A, Gary K, Fox G (1999) Economic feasibility of variable-rate technology for nitrogen on corn. American Journal of Agricultural Economics 81(4):914-927.
Trimble (2013) GreenSeeker system datasheet. Available:
http://trl.trimble.com/docushare/dsweb/Get/Document-475150/022503-11231_GreenSeeker_DS_MarketSmart_USL_0114_LR.pdf. Accessed: Apr 5, 2014.
Tucker CJ (1979) Red and Photographic Infrared Linear Combinations for Monitoring Vegetation. Remote Sensing of Environment 8(2):127-150.