Temporal variation of normalized difference vegetation index (NDVI) and calculation
of the crop coefficient (K
c) from NDVI in areas cultivated with irrigated soybean
Variação temporal do Índice de Vegetação por Diferença Normalizada (NDVI) e obtenção do coeficiente de cultura (Kc) a partir do NDVI em áreas cultivadas com soja irrigada
Thálita Carrijo de OliveiraI Elizabeth FerreiraII
Antônio Augusto Aguilar DantasII
ISSN 1678-4596
ABSTRACT
Vegetation indices obtained by remote sensing products have various applications in agriculture. An important application of the Normalized Difference Vegetation Index (NDVI) is obtaining the crop coefficient (Kc). The aims of this study were
to analyze NDVI temporal profiles and to obtain Kc from the NDVI
vegetation index product MOD13Q1. The analysis is based on the phenological stages of irrigated soybean crops in the municipality of Planura/MG during the 2010/2011 growing season. Areas planted with irrigated soybean were identified through fieldwork. Temporal series of the MOD13Q1 products were used to analyze NDVI, allowing the extraction of NDVI values for all points in the period studied. The NDVI temporal profiles showed a similar pattern to each other and corresponded to the crop cycle. The KcNDVI values for the MOD13Q1 products were well correlated
to the FAO Kc values (r
2=0.72). Thus, NDVI can be used as an
alternative for obtaining crop coefficient (Kc).
Key words: MOD13Q1, phenological stages, temporal profiles.
RESUMO
Os índices de vegetação obtidos a partir de produtos de sensoriamento remoto apresentam várias aplicações na agricultura. Uma importante aplicação do índice de vegetação Normalized Difference Vegetation Index (NDVI) está relacionada à obtenção do coeficiente de cultura (Kc). Assim, o objetivo deste
trabalho foi analisar os perfis temporais de NDVI e obter o Kc
a partir do produto de índice de vegetação NDVI (MOD13Q1), baseado na análise dos estádios fenológicos da cultura de soja irrigada, no município de Planura/MG, safra 2010/2011. A identificação das áreas plantadas com soja irrigada foi feita através de pesquisa de campo. As séries temporais do produto MOD13Q1 foram utilizadas para analisar o NDVI, permitindo a extração dos valores de NDVI para todos os pontos no período estudado. Os perfis temporais de NDVI apresentaram um padrão semelhante entre si e quanto ao ciclo da cultura. Os valores de KcNDVI variaram, em média, de acordo com os valores de Kc FAO,
representando uma correlação linear (r2) de 0,72 para o produto
MOD13Q1. Assim, o NDVI pode ser usado como uma alternativa na obtenção do Kc.
Palavras-chave: MOD13Q1, estádios fenológicos, perfis temporais.
INTRODUCTION
Agricultural surveys are conducted mainly by using conventional methods and information available from government agencies. However, with advances in remote sensing devices, including vegetation index-based sensors such as TERRA/MODIS, the data thus obtained can be used to monitor agricultural areas.
For agricultural applications, the high periodicity provided by these vegetation indices products is of fundamental importance for analysis and monitoring of the phenological cycle of crops such as soybean over large areas (ESQUERDO & ZULLO, 2007; RUDORFF et al., 2007; WARDLOW et al., 2007; EPIPHANIO et al., 2010; PENG et al., 2013), which could vary from 75 to 210 days depending on the cultivar (GARCIA et al., 2007). Nevertheless, because the images are produced with different spatial and temporal resolutions, further studies are needed to assess the
influence of these resolutions in the behavior of
indexes from planting to harvest.
The Brazilian Agricultural Research Corporation (Embrapa) makes available the
IInstituto Federal Goiano (IFG), 75650-000, Morrinhos, GO, Brasil. E-mail: [email protected]. *Corresponding author. IIDepartamento de Engenharia, Faculdade de Engenharia Agrícola, Universidade Federal de Lavras (UFLA), Lavras, MG, Brasil.
vegetation index product called Normalized Difference Vegetation Index (NDVI) with the purpose of facilitating and disseminating the use of TERRA/ MODIS products() (ESQUERDO et al., 2010).
An important application of NDVI is that
it helps determine the crop coefficient (Kc). Thus,
determination of the crop’s evapotranspiration (ETc),
which is based on Kc, on a daily basis is a key requirement
for the adoption of agricultural management and for irrigation (BEZERRA et al., 2010).
Kc is related to phenological crop cycles
and when it is associated to NDVI products, it
provides an alternative in obtaining new Kc values (DUCHEMIN et al., 2006; SINGH & IRMAK, 2009; BERGSON et al., 2010; KAMBLE et al., 2013).
Therefore, the present study aimed to
analyze the temporal NDVI profiles and obtain Kc
values from the NDVI vegetation index product (MOD13Q1), based on analysis of the growth stages of irrigated soybean in the Municipality of Planura/ MG, during the 2010/2011 harvest.
MATERIALS AND METHODS
The study area selected was the municipality of Planura, located in the “Mineiro” Triangle region
(19° 57′ 22″ and 20° 10′ 10″ S, 48° 44′ 39″ and 48° 30′ 45″ W; total area: 318 km²). The municipality has a
plateau relief, covered by a savannah-like vegetation (Brazilian “cerrado”) and irrigated agriculture is common. Climate is humid (B2) with a moisture index of 32.8, which is attributable to the aridity index
(la) of 13.7, according to the climatic classification of
Thornthwaite (CARVALHO et al., 2008).
Areas cultivated with irrigated soybean by
center-pivot sprinkler have been previously identified
by PEREIRA et al. (2011), who conducted field work for the identification and collection of 11 points
(punctual geographic coordinates) by using a GNSS receiver (Table 1), in farms located within the study area. Each point represented data including dates of planting and harvesting, and duration of different crop cycles. This information was then compared with NDVI data obtained from the MODIS sensor.
MOD13Q1 products were obtained from September 2010 to April 2011 (i.e., the 2010/2011 harvest season). These products were obtained from the Bank of MODIS Products supplied by Embrapa, in the Brazilian state basis, for Minas Gerais (ESQUERDO et al., 2010). Technical specifications of the MOD13Q1 products are presented in table 2.
The software Environment for Visualizing Images (ENVI), version 4.8 (VISUAL
INFORMATION SOLUTIONS, 2008), was used
to import the MOD13Q1 products. A time series of MOD13Q1 products was constructed for comprehensive description and analysis of NDVI, thereby allowing determination of NDVI values, for a 16-day composite.
The relationship between Kc and NDVI
values was evaluated by analysis of KcNDVI and Kc FAO values obtained in the FAO56 manual
(ALLEN et al., 1998). Thus, using the simple
linear regression model (Equation 1) created by KAMBLE et al. (2013), it was obtained KcNDVI
values, which were subsequently compared to Kc
FAO data for the analysis of phenological stages of irrigated soybean crop. In addition, according
to KAMBLE et al. (2013), the procedure for quantifying crop coefficients from NDVI data (Equation 1) could find applications in other
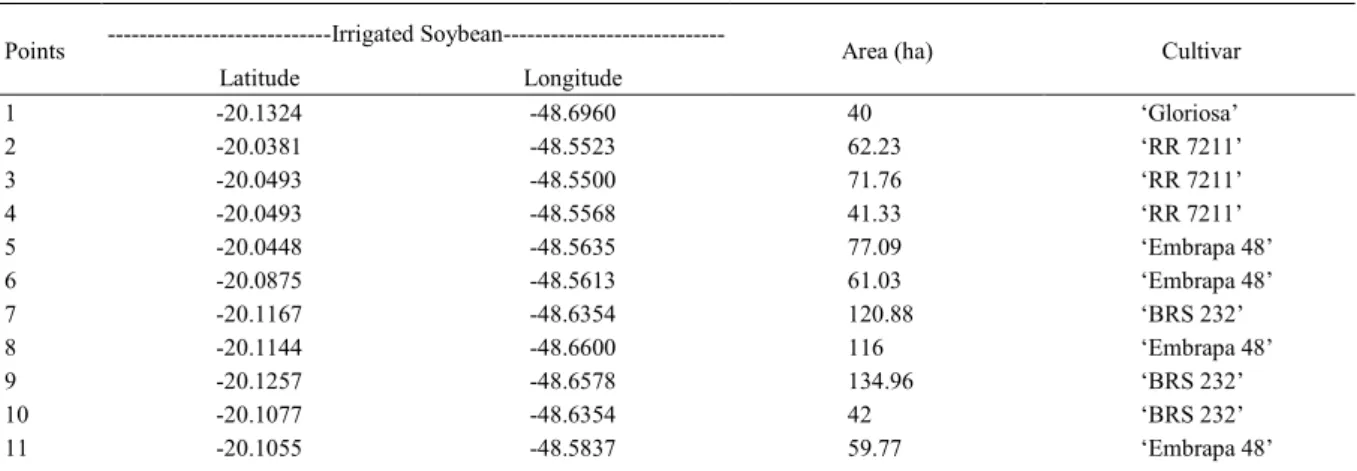
Table 1 - Specifications of points regarding areas cultivated with irrigated soybeans in the municipality of Planura/MG.
---Irrigated Soybean---Points
Latitude Longitude
Area (ha) Cultivar
1 -20.1324 -48.6960 40 ‘Gloriosa’
2 -20.0381 -48.5523 62.23 ‘RR 7211’
3 -20.0493 -48.5500 71.76 ‘RR 7211’
4 -20.0493 -48.5568 41.33 ‘RR 7211’
5 -20.0448 -48.5635 77.09 ‘Embrapa 48’
6 -20.0875 -48.5613 61.03 ‘Embrapa 48’
7 -20.1167 -48.6354 120.88 ‘BRS 232’
8 -20.1144 -48.6600 116 ‘Embrapa 48’
9 -20.1257 -48.6578 134.96 ‘BRS 232’
10 -20.1077 -48.6354 42 ‘BRS 232’
regions worldwide to understand the regional consumption of water for irrigation.
KcNDVI = 1.457 NDVI – 0.1725 (1)
To evaluate the comparison between
calculated (KcNDVI) and tabulated (Kc FAO) data, a
simple linear regression was carried out to NDVI and
Kc FAO. Statistical analyses involved using the t-test, at a 5% significance level (relative standard error,
estimate, standard error, t-value, and p-value) for the
parameters β0 and β1 of the regression equation, as well as for the coefficient determination (r2) analysis.
RESULTS AND DISCUSSION
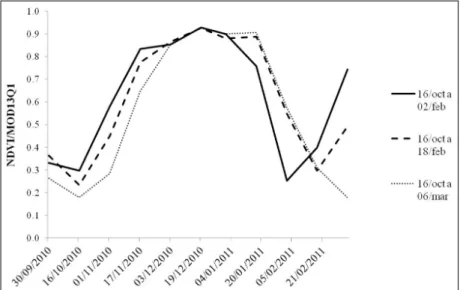
The NDVI temporal profiles of MOD13Q1
products for the irrigated soybean crop during the 2010/2011 harvest were grouped according to cycle duration (Figure 1). The soybean development period continued until November 17 for plots harvested on February 02, 2011, and February 18, 2011, with mean NDVI values of 0.77 and 0.84, respectively. As for the plot harvested on March 06, 2011, the mean NDVI value in the crop development period was 0.85, as on December 03, 2010. The maturation period started on
January 01, 2011, for the plot harvested on February 02, 2011; and on January 17, 2011 for plots harvested on February 18, 2011 and March 06, 2011.
With regard to NDVI analysis of the MOD13Q1 products (Figure 1), it was reported that the duration of the soybean cycle was 109, 125, and 141 days, respectively, for the plots harvested on February 02, 2011; February 18, 2011; and March 06, 2011. According to GARCIA et al. (2007) the soybean cycles can range from 75 to 210 days depending on the crop, which indicated that the variation of soybean cycle observed in this study was within the expected period.
The dates of planting and harvest, and duration of the irrigated soybean cycle, based on the NDVI analysis of MOD13Q1 products were
compared to field data collected by Pereira (2011), for the 2010/2011 harvest (Table 3). Thus, the field
data analysis showed that planting occurred for most points at the end of the second fortnight of October, and NDVI/MOD13Q1 analysis revealed that planting occurred early in the second fortnight of October. The harvest occurred, for most points in February. However, even with the difference between the dates
Figure 1 - NDVI temporal profiles of the MOD13Q1 products used for monitoring irrigated soybean crop during the 2010/2011 harvest season.
Table 2 - Technical specifications of the product MOD13Q1.
Satellite/sensor Imaged range (km)
Spatial resolution (m)
Spectral resolution (nm)
Temporal resolution (days)
Radiometric resolution (bits)
TERRA/MODIS 2330 250 Red (620-670) NIR (841-876) 16 16
of planting and harvesting, the duration of the cycle was similar in both analyses.
Analyses of NDVI temporal profiles
of MOD13Q1 products (Figure 1) revealed little variation among the crops, which possibly indicates
that the temporal profiles of the respective plantations
showed a similar pattern with each other regardless of the difference between the harvest dates and type of crop adopted. This was observed by ESQUERDO & ZULLO (2007) in their analysis of NDVI temporal
profiles that were generated using remote sensing
data for the soybean crop in western Paraná.
Comparisons were made between KcNDVI and Kc FAO in the analysis of phenological stages of
irrigated soybean crop for the MOD13Q1 products.
Thus, the NDVI, KcNDVI and Kc FAO values (Table 4)
are associated with the respective phenological stages of the irrigated soybean crop, based on the analysis of
the MOD13Q1 product temporal profile, considering
the planting from October 16, 2010 to February 02, 2011 (Figure 1). The stages were characterized on the basis of methodology proposed in the FAO-56 report (ALLEN et al., 1998). During the growth stage (stage
II), Kc varied between 0.6 and 1.1, increasing up to stage III. After maturation (stage IV), Kc decreased
until harvest (stage V), with values of 0.2 and 0.4,
respectively, for KcNDVI, and Kc FAO. When NDVI showed high values, Kc values ranged between 1 and
1.2 on average, which showed that the maximum evaporation (ETc) can be higher than the reference
Table 3 - Comparison among dates of planting and harvesting, and duration of the irrigated soybean cycle in the analysis of field data and NDVI of the MOD13Q1 products.
---Field Data--- ---Analysis of NDVI/MOD13Q1---Points
Planting Harvest Cycle duration Planting Harvest Cycle duration
1 10/10/2010 27/02/2011 140 16/10/2010 18/02/2011 125
2 21/10/2010 17/02/2011 119 16/10/2010 18/02/2011 125
3 21/10/2010 16/02/2011 118 16/10/2010 18/02/2011 125
4 12/10/2010 05/02/2011 116 16/10/2010 02/02/2011 109
5 14/10/2010 31/01/2011 109 16/10/2010 02/02/2011 109
6 22/10/2010 06/02/2011 107 16/10/2010 18/02/2011 125
7 27/10/2010 21/02/2011 117 16/10/2010 06/03/2011 141
8 22/10/2010 10/02/2011 111 16/10/2010 18/02/2011 125
9 27/10/2010 19/02/2011 115 16/10/2010 06/03/2011 141
10 27/10/2010 24/02/2011 120 16/10/2010 18/02/2011 125
11 24/10/2010 18/02/2011 117 16/10/2010 18/02/2011 125
Table 4 - Phenological stages of irrigated soybean and their values of NDVI, KcNDVI and Kc FAO, for the planting from October 16, 2010 to
February 02, 2011, of the MOD13Q1 products.
---Period---Stages
Initial Intermediary Final
NDVI KcNDVI Kc FAO
I Planting 16/10/2010 - - 0.30 0.26 0.30
- 01/11/2010 - 0.58 0.68 0.70
II 10 to 80% do VD*
- 17/11/2010 - 0.84 1.04 0.70
- 03/12/2010 - 0.85 1.07 1.00
III 80 to 100% of VD*
- 19/12/2010 - 0.93 1.18 1.00
- 01/01/2011 - 0.90 1.14 0.70
IV Maturation
- 17/01/2011 - 0.76 0.93 0.70
V Harvest - - 02/02/2011 0.25 0.20 0.40
evapotranspiration (ET0), defining the well irrigated
crop condition. This was observed by KAMBLE et al. (2013) in the analysis of Kc for irrigated crops
in the state of Nebraska-USA.
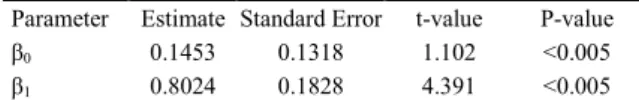
Table 5 shows the statistics of the
linear regression fit to NDVI and, Kc FAO, for the
MOD13Q1 products.
Analyses by the t-test revealed that all
parameters were statistically significant P<0.05),
although the standard deviation was relatively high. This can be explained by the existence of several factors that directly affect the determination of
Kc, such as relative humidity, wind speed, type of
cultivar used, as well as the conditions that affect soil evaporation (ALLEN et al., 1998).
The coefficient of determination (r2)
was 0.79. This result corroborated those obtained
by SINGH & IRMAK (2009) and KAMBLE et
al. (2013), in the correlation between NDVI and
Kc values for irrigated soybean with an r
2 value
of 0.9 and 0.81, respectively, which highlighted
the adequacy of the method to represent NDVI variation in the Kc data set.
CONCLUSION
These results showed that despite the low spatial resolution of the MODIS sensor, it was possible to follow the phenological cycle of the irrigated soybean crop, based on the analysis
of the NDVI temporal profiles of the vegetation index. Thus, the NDVI temporal profiles of the
MOD13Q1 products showed similar patterns to each other and regarding crop cycle.
Comparing KcNDVI and Kc FAO values
in the analysis of the phenological stages of the irrigated soybean crop, we reported that the
calculated Kc values (KcNDVI) varied, on average, according to the tabulated values of Kc (Kc
FAO) and the coefficient of determination (r2) has showed that variations in the Kc data set are
explained by variations in NDVI. Therefore, NDVI may be used as an alternative tool for
obtaining the crop coefficient (Kc).
ACKNOWLEDGEMENTS
In the Fundação de Amparo à Pesquisa de Minas Gerais (FAPEMIG), CAG-APQ 01560-12 process.
REFERENCES
ALLEN, R.G. et al. Crop evapotranspiration: guidelines for computing crop water requirements. Rome: FAO, 1998. 300p. (FAO. Irrigation and Dranaige Paper, 56).
BEZERRA, B.G. et al. Real actual evapotranspiration obtained through the relationship between the fao-56 crop dual coefficient and ndvi. Meteorology and Climatology, v.25, n.3, p.404-414, 2010. Available from: <http://dx.doi.org/10.1590/S0102-77862010000300012>. Accessed: Jun 10, 2015. doi: 10.1590/ S0102-77862010000300012.
CARVALHO, L.G.DE. et al. Clima. In: SCOLFORO, J.R.S. et al.
Zoneamento ecológico-econômico do Estado de Minas Gerais:
componente socioeconômico. Lavras: UFLA, 2008. Cap.4, 14p. Available from: <http://www.zee.mg.gov.br/pdf/componentes_ geofisico_biotico/4clima.pdf>. Accessed: Oct 23, 2013.
DUCHEMIN, B. et al. Monitoring wheat phenology and irrigation in Central Morocco: On the use of relationships between evapotranspiration, crops coefficients, leaf area index and remotely-sensed vegetation indices. Agricultural
Water Management, v.79, p.1-27, 2006. Available from:
<http://ac.els-cdn.com/S0378377405001046/1-s2.0-S0378377405001046-main.pdf?_tid=91218622bea411e5853 e00000aab0f01&acdnat=1453205152_51af5ba1e4d60622ac 445d03bdb143d4>. Accessed: Jun 06, 2015. doi: 10.1016/j. agwat.2005.02.013.
EPIPHANIO, R.D.V. et al. Estimating soybean crop areas using spectral - temporal surfaces derived from MODIS images in Mato Grosso, Brazil. Pesquisa Agropecuária Brasileira, v.45, p.72-80, 2010. Available from: <http://dx.doi.org/10.1590/S0100-204X2010000100010>. Accessed: Nov. 22, 2013. doi: 10.1590/ S0100-204X2010000100010.
ESQUERDO, J. et al. Desenvolvimento do banco de produtos MODIS na base estadual brasileira. Campinas, SP: Embrapa Informática Agropecuária, 2010. 7p. (Embrapa Informática Agropecuária. Comunicado Técnico, 100).
ESQUERDO, J.; ZULLO JÚNIOR, J. Geração automática de perfis temporais de NDVI a partir de imagens AVHRR/ NOAA e SPOT/Vegetation. In: SIMPÓSIO BRASILEIRO DE SENSORIAMENTO REMOTO, 13., 2007, Florianópolis, SC.
Anais eletrônicos... Florianópolis: INPE, 2007. 1 CD-ROM.
GARCIA, A. et al. Instalação da lavoura de soja: época, cultivares, espaçamento e população de plantas. Londrina, PR: Embrapa Soja, 2007. 12p. (Embrapa Soja. Circular Técnica, 51).
KAMBLE, B. et al. Estimating crop coefficients using remote sensing-based vegetation index. Remote Sensing, v.5, p.1588-1602, 2013. Available from: <http://dx.doi.org/10.3390/ rs5041588>. Accessed: Jun. 19, 2015. doi:10.3390/rs5041588.
PENG, Y. et al. Remote estimation of gross primary productivity in crops using MODIS 250 m data. Remote Sensing of Environment, v.128, p.186-196, 2013. Available from: <http://
Table 5 - Statistics of the linear regression fit to NDVI and Kc
FAO data, for the MOD13Q1 products.
---MOD13Q1 (Relative Standard Error =
13.02%)---Parameter Estimate Standard Error t-value P-value β0 0.1453 0.1318 1.102 <0.005
dx.doi.org/10.1016/j.rse.2012.10.005>. Accessed: Oct. 20, 2013. doi:10.1016/j.rse.2012.10.005.
PEREIRA, R.M. Validação de mapas de uso e cobertura do solo do município de Planura/MG. 2011. 47f. Monografia. (Graduação em Agronomia) – Curso de graduação em Agronomia, Universidade Federal de Lavras, MG.
RUDORFF, C. de M. et al. Spectral-temporal response surface of MODIS sensor images for soybean area classification in Rio Grande do Sul State. Ciência Rural, v.37, p.118-125, 2007. Available from: <http://dx.doi.org/10.1590/S0103-84782007000100019>. Accessed: Oct 05, 2013. doi:10.1590/S0103-84782007000100019.
SHIMABUKURO, Y. E.; RUDORFF, B.F.T. Dados do sensor MODIS para o mapeamento e monitoramento da cobertura vegetal e uso da terra. In: SIMPÓSIO DE GEOTECNOLOGIAS NO
PANTANAL, 2006, Campo Grande, MS. Anais... Campo Grande: INPE, 2006. p.929-938.
SINGH, R.; IRMAK, A. Estimation of crop coefficients using satellite remote sensing. Journal of Irrigation and Drainage Engineering, v.135, p.597-608, 2009. Available from: <http://
dx.doi.org/10.1061/(ASCE)IR.1943-4774.0000052>. Accessed: Mar 03, 2015. doi: 10.1061/(ASCE)IR.1943-4774.0000052.
VISUAL INFORMATION SOLUTIONS. Environment for visualizing images. Boulder, 2008. Version 4.6.1.