Received 6/17/2013 Accepted 8/20/2013 (006119)
1 Consejo Nacional de Investigaciones Científicas y Técnicas – CONICET, Av. Rivadavia, 1917, (C1033AAJ), Buenos Aires, Argentina, e-mail: [email protected]; [email protected]
2 Grupo de Investigación en Preservación y Calidad de Alimentos – GIPCAL, Facultad de Ingeniería, Universidad Nacional de Mar del Plata – UNMdP, Mar del Plata, Buenos Aires, Argentina
*Corresponding author
Analysis of applicability of Peleg model to the cooking-infusion of mackerel
(
Scomber japonicus
) slices
Gerardo CHECMAREV1,2*, María Rosa CASALES1,2, María Isabel YEANNES1,2
1 Introduction
Osmotic dehydration (OD) is one of the commonly used methods for food preservation. It consists of water removal by soaking the food in a hypertonic solution with the aim of producing water flow from the product to the hypertonic solution. The driving force for mass transfer is the difference in osmotic pressure (OCHOA MARTINEZ; AYALA APONTE, 2005). Since the cell membrane acts as a semi-permeable film, two main fluxes occur simultaneously and in opposite direction: the diffusion of water out of the tissue into the osmotic solution and the uptake of solute from osmotic solution to the product (CORZO; BRACHO, 2009; URIBE et al., 2011). Other flow is the leaching out of the food tissue’s own solutes (sugars, organic acids, minerals, and vitamins) into the solution. This last flow is unimportant due to the low solids loss, but it can modify some properties such as sensorial characteristics (CORZO; BRACHO, 2009). Different mathematical models have been applied for adjusting OD processes’ experimental results in order to predict the behavior of food products. Models based on solution of Fick’s second law have generally been used to describe OD process (CASALES; CAPACCIONI; YEANNES, 2009; CORZO; BRACHO, 2007; GERLA; RUBIOLO, 2003; GOU; COMAPOSADA; ARNAU, 2003; GRAIVER et al., 2006; RODGER et al., 1984; TELIS et al., 2003 among others). This model assumes that the solution concentration remained constant, the external resistance is negligible compared to the internal resistance, and the sample geometry is as simple as, for example, an infinite slab. Another alternative for modeling the osmotic dehydration process is the use of empirical models based on mathematical representations of the observed data, covering some of the Fick model inaccuracies. The use of the diffusive model depends on the estimation or experimental determination
of equilibrium values. The estimation of these values can be performed with empirical models, but its experimental determination needs long immersion times that can lead to food tissue changes (SCHMIDT; CARCIOFI; LAURINDO, 2009). Some of the empirical models were developed from polynomial adjustments, while others were developed from mass balances and relationships between process variables (OCHOA MARTINEZ; AYALA APONTE, 2005; CORZO; BRACHO, 2009). One of the most widely used empirical models to predict water loss/gain and salt gain in different foods is the equation proposed by Peleg (SCHMIDT; CARCIOFI; LAURINDO, 2009; CORZO; BRACHO, 2006; CZERNER; YEANNES, 2010; TURHAN; SAYAR; GUNASEKARAN, 2002). According to these authors, the Peleg model is able to represent satisfactorily the transfers of water and salt during osmotic treatments. Mass transfer kinetics in cherry tomato in different hypertonic NaCl solutions (with or without sucrose) was modeled according to Peleg, Fick, and Page equations (AZOUBEL; MURR, 2004). In addition, mathematical modeling of mass transfer during the osmotic dehydration of strawberries in a solution of sugar (40 °Brix) has been performed applying Newton, Henderson–Pabis, Page, and Weibull models (NUÑEZ-MANCILLA et al., 2011). The diffusive model, Azuara’s model, Peleg’s model, and an exponential (Weibull-type) model were used in the mathematical modeling of water gain/loss and salt gain by chicken breast cuts immersed in saline solutions (SCHMIDT; CARCIOFI; LAURINDO, 2009). In fish products, water loss, and acid and salt gain have been modeled using Fick, Peleg, Weibull, and Zugarramurdi & Lupín models (CORZO; BRACHO, 2009; CASALES; CAPACCIONI; YEANNES, 2009; CORZO; BRACHO, 2007; RODGER et al., 1984; TELIS et al.,
Abstract
Mass transfer kinetics in osmotic dehydration is usually modeled by Fick’s law, empirical models and probabilistic models. The aim of this study was to determine the applicability of Peleg model to investigate the mass transfer during osmotic dehydration of mackerel (Scomber japonicus) slices at different temperatures. Osmotic dehydration was performed on mackerel slices by cooking-infusion in solutions with glycerol and salt (aw = 0.64) at different temperatures: 50, 70, and 90 °C. Peleg rate constant (K1) (h(g/gdm)
–1) varied with temperature variation from 0.761 to 0.396 for water loss, from 5.260 to 2.947 for salt gain, and
from 0.854 to 0.566 for glycerol intake. In all cases, it followed the Arrhenius relationship (R2>0.86). The E
a (kJ / mol) values
obtained were 16.14; 14.21, and 10.12 for water, salt, and glycerol, respectively. The statistical parameters that qualify the goodness of fit (R2>0.91 and RMSE<0.086) indicate promising applicability of Peleg model.
2.2 Infusion solution
The composition (w/w) of the infusion solution was as follows: 54% glycerol (Biopack, Zárate, Buenos Aires, Argentina, 99.5 g/100 g of purity), 38.3% water, 7% sodium chloride (Biopack, 99 g/100 g of purity),and 0.7% potassium sorbate (DQI, Medellín, Colombia, 99 g/100 g of purity). The aw of cooking-infusion solution was 0.64. The ratio fish:solution was 1:10 (w/w) in order to minimize significant changes in the concentration of the osmotic solution as a result of water loss and solute uptake.
2.3 Cooking-infusion
The osmotic dehydration of mackerel slices was carried out in the aforementioned infusion solution at the following temperatures: 50±1, 70±1 and 90±1 °C until equilibrium was reached (a maximum immersion time of 3 hours).
The slices were thawed under refrigeration until they reached 8 °C and placed in the infusion solution at the fixed temperatures. At specified time intervals (5, 10, 15, 20, 25, 40, 60, 80, 120, 150, and 180 minutes), the samples were removed for physicochemical analysis. The slices were drained, superficially rinsed with distilled water, dried with absorbent paper, and weighed. Three slices were removed at each sampling time and each temperature tested.
Two runs were performed for the three temperatures tested. 2003; CORZO; BRACHO, 2006; CZERNER; YEANNES, 2010;
CORZO; BRACHO, 2005; ZUGARRAMURDI; LUPÍN, 1977; ZUGARRAMURDI; LUPÍN, 1980).
Our research group has developed a new product with mackerel, with the aw reduction as the principal hurdle to microbial growth. A ternary solution with glycerol and salt was used to reduce the aw value. In the scientific literature, information available about the application of empirical models for the osmotic dehydration of different kinds of food in solutions with glycerol and salt is very scarce, and no information has yet been reported regarding fish products.
Therefore, the aim of this study was to determine the applicability of Peleg model to investigate the mass transfer during osmotic dehydration of mackerel (Scomber japonicus) slices at different temperatures in a hypertonic solution containing glycerol and salt.
2 Materials and methods
2.1 Raw materials
Mackerel (Scomber japonicus) caught in Mar del Plata, Argentine, in the months of October and November and stored at –18 °C was used in this study. The skin, head, tail, and viscera were removed from frozen samples. The trunk was cut into slices of 0.72±0.05 cm thick and 5.15±0.15 cm diameter.
software Origin Pro 8.0 (OriginLab, Northampton, MA). The determination coefficient (R2) and root mean square error
(RMSE, Equation 4) were used to evaluate the goodness of fit of the model to the experimental data.
=
=
∑
− 21 1
( )
n
ip i
i
RMSE X X
n (4)
where Xi and Xip are the experimental data and the values predicted by the model, respectively, and n the number of data pairs.
3 Results and discussion
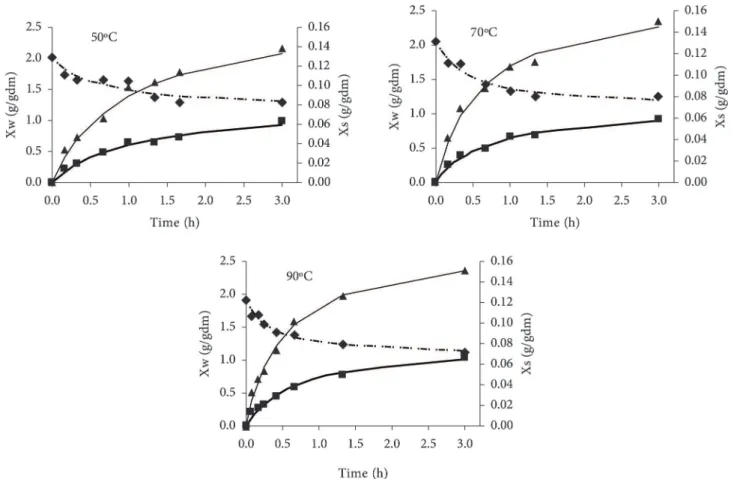
Peleg model parameters and equilibrium values for water, salt, and glycerol at the different temperatures tested are shown in Table 1.
Peleg rate constant (K1) decreased from 0.761 to 0.396
h(g/gdm)–1 for water loss; from 5.526 to 2.947 h(g/gdm)–1 for
salt gain; and from 0.944 to 0.566 h(g/gdm)–1 for glycerol gain,
respectively, with increasing temperature from 50 to 90 °C. Since the inverse of K1 (Peleg rate constant) (Equation 2) is related
to mass transfer rate, both water loss and solute gain increased with temperature. Similar behavior for water loss and salt gain was found by Corzo and Bracho (2006) in sardine sheets and by Turhan, Sayar and Gunasekaran (2002) in chickpea. There is no information available on glycerol gain in the literature. The increase in temperature promoted faster water loss and faster solute gain probably due to swelling and plasticizing of the cell membranes. It also led to faster water diffusion within the product and improved water transfer characteristics on the product surface due to lower viscosity of the osmotic solution (TORTOE, 2010). In addition, the higher solid gains at higher temperatures may be due to the destruction of cell membrane structure (CORZO; BRACHO, 2006).
Peleg capacity constant (K2) did not show a clear pattern
with respect to the process temperature for salt and glycerol or water. Corzo and Bracho (2006) found similar results for OD of sardine sheets for water loss and salt gain.
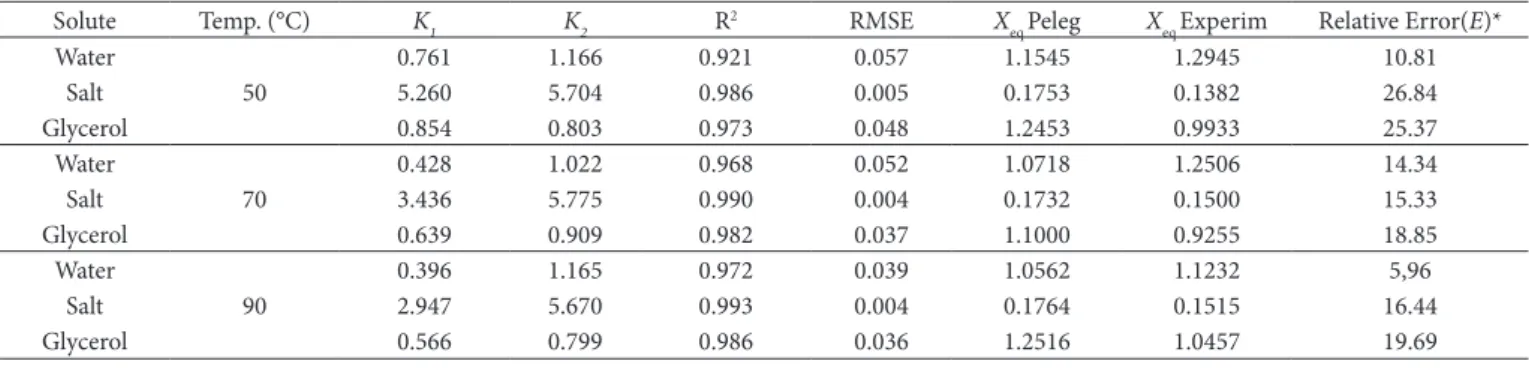
The determination coefficient (R2) ranged from 0.90 to
0.99 for water loss and glycerol and salt gain. RMSE values were <0.09 in all cases. According to the statistical parameters
2.4 Physicochemical analysis
The water content was determined at 105 °C until constant weight (ASSOCIATION..., 1990) using a drying oven (Marne, 644, Córdoba, Argentina); sodium chloride content was determined using the Mohr method adapted to food (KIRK; SAWYER; EGAN, 1996); glycerol was determined using an enzymatic UV method (BoehringerMannheim/R-Biopharm, Darmstadt, Germany); and aw was determined using an Aqualab hygrometer (Decagon, CX-2T, Pulman, WA, USA).
All analyses were performed in triplicate.
2.5 Peleg Model
Peleg (1988) proposed a two-parameter sorption equation:
= ± +
0
1 2
t
t X X
K K t (1)
where X0 and Xt are content of water, salt, and glycerol (expressed
as g on a non-salt and non-glycerol dry matter basis, g/gdm) at time 0 and time t, respectively. K1 is the Peleg rate constant
(h(g/gdm)–1),and K
2 is the Peleg capacity constant ((g/gdm)
–1).
In Equation 1 “±” becomes “+” for salt and glycerol gain and “–” for water loss. K1 is related to the mass transfer rate at the
beginning of the OD process (Equation 2). K2 is related to water, salt, or glycerol contents at time t→ ∞ (Equation 3).
= ±1 1 t
dX dt K (2)
= ±
0 1 2
eq
X X K (3)
where Xeq is water, salt or glycerol contents in the equilibrium (t→ ∞).
The major advantage of the Peleg model is to save time by predicting the kinetics sorption of osmotically dehydrated foods, including equilibrium values (Equation 3), using short-time experimental data (TURHAN; SAYAR; GUNASEKARAN, 2002; PELEG, 1988).
2.6 Statistical analysis
The fitting of the model to the experimental data was performed by nonlinear regression analysis using the
Table 1. Peleg model parameters.
Solute Temp. (°C) K1 K2 R2 RMSE X
eq Peleg Xeq Experim Relative Error(E)*
Water
50
0.761 1.166 0.921 0.057 1.1545 1.2945 10.81
Salt 5.260 5.704 0.986 0.005 0.1753 0.1382 26.84
Glycerol 0.854 0.803 0.973 0.048 1.2453 0.9933 25.37
Water
70
0.428 1.022 0.968 0.052 1.0718 1.2506 14.34
Salt 3.436 5.775 0.990 0.004 0.1732 0.1500 15.33
Glycerol 0.639 0.909 0.982 0.037 1.1000 0.9255 18.85
Water
90
0.396 1.165 0.972 0.039 1.0562 1.1232 5,96
Salt 2.947 5.670 0.993 0.004 0.1764 0.1515 16.44
Glycerol 0.566 0.799 0.986 0.036 1.2516 1.0457 19.69
(*) i ip100 i
X X E
X
−
The plot of the logarithm of the Peleg rate constant vs. 1/T
would result in a straight line with the negative of the slope equal Ea/R and intercept equal ln(K0). The linearity of the data
(R2>0.86) indicated that the Peleg rate constants for water
loss and salt and glycerol gain as a function of temperature represent an Arrhenius-type relationship (Table 2). Higher Ea
value indicated greater temperature sensitivity of Peleg rate constant. The rate constant for water loss was found to be more temperature sensitive (Ea = 16.14 kJ/mol) than the rate constant for salt (Ea = 14.21 kJ/mol) and glycerol gain (Ea = 10.12 kJ/mol).
Ea value was similar to the values obtained by other authors for osmotic dehydration processes of fishery products (CORZO; BRACHO, 2006; FAVETTO; CHIRIFE; BARTHOLOMAI, 1981).
that qualify the goodness of fit (RMSE and R2), the Peleg model
adequately described the kinetics of water loss and solute gain in the osmotic dehydration of mackerel slices.
The fitting of the model to the experimental data is shown in Figure 1 for water loss and glycerol and salt gain at 50, 70, and 90 °C.
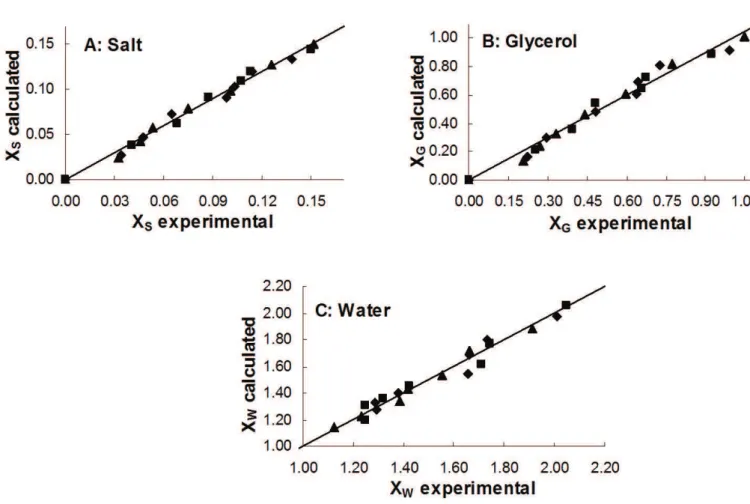
The predicted and experimental data for water loss and salt and glycerol gain at the three temperatures tested are shown in Figure 2. It is observed that, for most of the conditions analyzed, the differences between the data and the values predicted by the model were small, which was verified by the statistical parameters R2 and RMSE (Table 1).
The predicted equilibrium values obtained from Equation 3 are shown in Table 1. Peleg model underestimated the equilibrium water content and overestimated the equilibrium salt and glycerol content compared with the experimental equilibrium values.
The dependence of the Peleg rate constant on temperature is represented by the linearized Arrhenius equation (Equation 5):
= −
1 0
ln(K) ln(K ) Ea RT (5)
where K1 is the Peleg rate constant (h(g/gdm)–1), K
0 is a constant
(h(g/gdm)–1), E
a is the activation energy (kJ/mol), R the
universal gas constant (8.314 J/mol K), and T is the absolute temperature (K).
Figure 2. Comparison between experimental and Peleg-estimated data A: Salt, B: Glycerol and C: Water: 50 °C (♦), 70 °C (■), 90 °C (▲).
Table 2. Activation energy for Peleg rate constant during osmotic dehydration of mackerel slices.
Parameter Water loss Salt gain Glycerol gain
Ea (kj/mol) 16.14 14.21 10.12
K0 (h(g/gdm)–1) 0.0017 0.025 0.019
GERLA, P. E.; RUBIOLO, A. C. A model for determination of multicomponent diffusion coefficients in foods. Journal of Food Engineering, v. 56, p. 401-410, 2003. http://dx.doi.org/10.1016/ S0260-8774(02)00213-3
GOU, P.; COMAPOSADA, J.; ARNAU, J. NaCl content and temperature effects on moisture diffusivity in the Gluteus medius muscle of pork ham. Meat Science, v. 63, p. 29-34, 2003. http://dx.doi.org/10.1016/ S0309-1740(02)00048-7
GRAIVER, N. et al. Diffusion of sodium chloride in pork tissue.
Journal of Food Engineering, v. 77, p. 910-918, 2006. http://dx.doi. org/10.1016/j.jfoodeng.2005.08.018
KIRK, R.; SAWYER, R.; EGAN, H. Composición y Análisis de Alimentos de Pearson. 2. ed. Editorial Continental S.A. México; 1996.
NUÑEZ-MANCILLA, Y. et al. Modeling mass transfer during osmotic dehydration of strawberries under high hydrostatic pressure conditions. Innovative Food Science and Emerging Technologies, v. 12, p. 338-343, 2011. http://dx.doi.org/10.1016/j.ifset.2011.03.005 OCHOA MARTINEZ, C.; AYALA APONTE, A. Modelos matemáticos de transferencia de masa en deshidratación osmótica. Ciencia y Tecnología Alimentaria, v. 43, p. 330-342, 2005.
PELEG, M. An empirical model for the description of moisture sorption curves. Journal of Food Science, v. 53, p. 1216-1219, 1988. http:// dx.doi.org/10.1111/j.1365-2621.1988.tb13565.x
RODGER, G. et al. Diffusion properties of salt and acetic acid into herring and their subsequent effect on the muscle tissue.
Journal of Food Science, v. 49, p. 714-720, 1984. http://dx.doi. org/10.1111/j.1365-2621.1984.tb13194.x
SCHMIDT, F.; CARCIOFI, B.; LAURINDO, J. Application of diffusive and empirical models to hydration, dehydration and salt gain during osmotic treatment of chicken breast cuts. Journal ofFood Engineering, v. 91, p. 553-559, 2009. http://dx.doi.org/10.1016/j. jfoodeng.2008.10.003
TELIS, V. et al. Salting kinetics and salt diffusivities in farmed pantanal caiman muscle. Pesquisa Agropecuaria Brasileira, v. 38, p. 529-535, 2003. http://dx.doi.org/10.1590/S0100-204X2003000400012 TORTOE, C. A review of osmodehydration for food industry. African
Journal of Food Science, v. 4, p. 303-324, 2010.
TURHAN, M.; SAYAR, S.; GUNASEKARAN, S. Application of Peleg model to study water absorption in chickpea during soaking. Journalof Food Engineering, v. 53, p. 153-159, 2002. http://dx.doi. org/10.1016/S0260-8774(01)00152-2
URIBE, E. et al. Mass transfer modelling during osmothic dehydration of jumbo squid (Dosidicus jigas): influence of temperature on diffusion coefficients and kinetic parameters. Food Bioprocess Technology, v. 4, p. 320-326, 2011. http://dx.doi.org/10.1007/ s11947-010-0336-2
ZUGARRAMURDI, A.; LUPÍN, H. Studies on anchovy salting II. Dynamics of the process. Latin American Journal of Chemical Engineering and Applied Chemistry, v. 7, p. 25-38, 1977. ZUGARRAMURDI, A.; LUPÍN, H. A model to explain observed
behavior of fish salting. Journal of Food Science, v. 45, p. 1305-1311, 1317, 1980.
4 Conclusions
The Peleg model can be used to describe the OD process of mackerel slices in the range between 50 and 90 °C. It can be used for predicting equilibrium values. Temperature in the range between 50 and 90 °C influences the mass transfer phenomena during the OD process of mackerel slices immersed in a solution of glycerol (54% w/w ) and salt (7% w/w).
Acknowledgements
The authors are grateful for the financial support provided by Universidad Nacional de Mar del Plata Project ING330/11 and CONICET PIP 0403.
References
ASSOCIATION OF OFFICIAL ANALYTICAL CHEMISTS - AOAC.
Official Method of Analysis. 15th ed. Washington: AOAC, 1990. AZOUBEL, P. M.; MURR, F. Mass transfer kinetics of osmotic
dehydration of cherry tomato. Journal of Food Engineering, v. 61, p. 291-295, 2004. http://dx.doi.org/10.1016/S0260-8774(03)00132-8 CASALES, M. R.; CAPACCIONI, M. E.; YEANNES, M. I. Obtainment of equilibrium times and diffusion coefficients of acid and salt to design the marinating process of Engraulis anchoita fillets. Ciência e Tecnologia Alimentos, v. 29, n. 4, p. 933-937, 2009. http://dx.doi. org/10.1590/S0101-20612009000400035
CORZO, O.; BRACHO, N. Osmotic dehydration kinetics of sardine sheets using Zugarramurdi and Lupin model. Journal ofFood Engineering, v. 66, p. 51-56, 2005. http://dx.doi.org/10.1016/j. jfoodeng.2004.02.033
CORZO, O.; BRACHO, N. Application of Peleg model to study mass transfer during osmotic dehydration of sardine sheets.Journal of Food Engineering, v. 75, p. 535-541, 2006. http://dx.doi. org/10.1016/j.jfoodeng.2005.05.001
CORZO, O.; BRACHO, N. Water effective diffusion coefficient of sardine sheets during osmotic dehydration at different brine concentrations and temperatures. Journal of FoodEngineering, v. 80, n. 2, p. 497-502, 2007. http://dx.doi.org/10.1016/j.jfoodeng.2006.06.008 CORZO, O.; BRACHO, N. Aplicación del modelo de Weibull
normalizado en la deshidratación osmótica de láminas de sardina. Revista Científica FCV-LUZ, v. 23, n. 4, p. 400-407, 2009. CZERNER, M.; YEANNES, M. I. Brining kinetics of different cuts
of anchovy (Engraulis anchoita). International Journal of Food Science and Technology, v. 45, n. 10, p. 2001-2007, 2010. http:// dx.doi.org/10.1111/j.1365-2621.2010.02361.x