IUL School of Social Sciences
Department of Political Economy
The Impact of the Income Inequality on the Sovereign Credit Risk
A panel approach for 26 European Countries during 2005-2010Dissertation submitted as partial requirement for the conferral of
Master in Monetary and Financial Economics
by
Andreia Patrícia Ferreira Dias dos Santos
Supervisor:
Doctor Sérgio Miguel Chilra Lagoa, Assistant Professor ISCTE – University Institute of Lisbon
First and foremost I would like to express my gratitude to my supervisor Doctor Sérgio Lagoa (ISCTE-IUL), who kindly provided his extensive knowledge, support, guidance and advices he was always willing to give me despite the distance. As part of this thesis was done while I was an intern under the ERASMUS Programme at the Institute of Finance – University of Ulm, I deeply appreciate my adviser Ph.D. Eva Eisele for all the knowledge shared, inspiration and also for helping me to set the empirical foundations for my dissertation. Last but not least, many thanks to Doctor Posh, who welcomed me in its team in the Institute of Finance who made my stay in Ulm very pleasant. On a personal side, I wish to extend my heartfelt thanks to all my friends and to my family for their kind support, motivation and friendship during this year. Special thanks to Aiste Kuodyte.
The aftermath of the financial crisis that had its beginning in 2007 has put to the fore the increase of the public debt in OECD countries. Global economic recessions and public bailouts of banks have resulted in a significant concern about the sovereign default risk mainly on the Eurozone countries facing structural economic imbalances. Using Credit Default Swaps (CDS) as a measure of sovereign credit risk, the purpose of this study is to analyze the link between sovereign default risk and income inequality for a broad panel of 26 European countries over the years 2005 to 2010. Applying the System GMM techniques the findings support the hypothesis that income inequality is a significant predictor of the sovereign credit risk. The empirical results also show that income inequality has more impact on the dynamics of the CDS spreads in times of economic downturns.
Key words
׃
Sovereign Credit Risk, Credit Default Spreads, Income Inequality, Fixed Effects, Arellano-Bond GMM estimatorA recente crise financeira que teve origem no início de 2007 expôs o aumento da dívida pública em alguns países da OCDE. Os desequilíbrios macroeconómicos e a vulnerabilidade do sistema financeiro global estão associados ao risco de falência soberano principalmente nos países da Zona Euro desprovidos de mecanismos autónomos de política monetária. O objetivo deste estudo é analisar a relação existente entre o risco de falência soberano medido através dos spreads dos CDS e a desigualdade de rendimento para um painel de 26 países Europeus ao longo do período de 2005 a 2010. Utilizando o estimador GMM-System como metodologia econométrica, os resultados do trabalho empírico suportam a hipótese de partida de que a desigualdade de rendimento constitui um importante determinante no risco de crédito soberano. Como principal evidência empírica a retirar deste estudo, sublinha-se que a desigualdade de rendimento tem maior impacto na dinâmica dos CDS em períodos de recessão económica.
Palavras-chave
׃
Risco Soverano, Credit Default Spreads, Desigualdade de Rendimento, Modelo de Efeitos Fixos, Estimador GMM Arellano-BondI
I. Introduction ... 1
II. Literature Review ... 4
2.1 Income Inequality ... 4
2.1.1 Income Inequality and Sovereign Credit Risk ... 4
2.1.2 Inequality and Redistribution ... 6
2.1.3 Income Inequality and Growth ... 7
2.2 Sovereign Credit Risk ... 8
2.2.1 Determinants of the Sovereign Credit Risk ... 9
2.2.2 Mechanics of the Sovereign CDS Market ... 11
2.2.3 Government Public Debt and Macroeconomic Implications ... 13
2.3 The European Economic Context ... 14
2.3.1 The Sovereign Debt Crisis ... 14
2.3.2 Distribution of Income and Government Public Debt ... 15
III. Data and Methodology ... 17
3.1 Source of Data ... 17
3.2 Description of variables ... 19
3.2.1 Key Independent Variable ... 19
3.2.2 Dependent Variable ... 24
3.2.3 Control Variables ... 25
3.2.4 Descriptive Statistics ... 28
3.3 Econometric Methodology ... 30
3.3.1 Fixed and Random Effects ... 32
3.3.2 The Fixed Effect Equations ... 32
3.3.3 The Arellano-Bond GMM Estimator ... 33
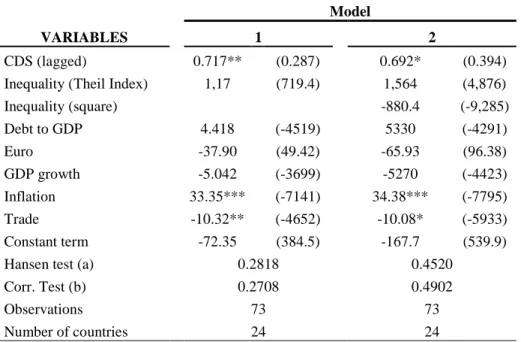
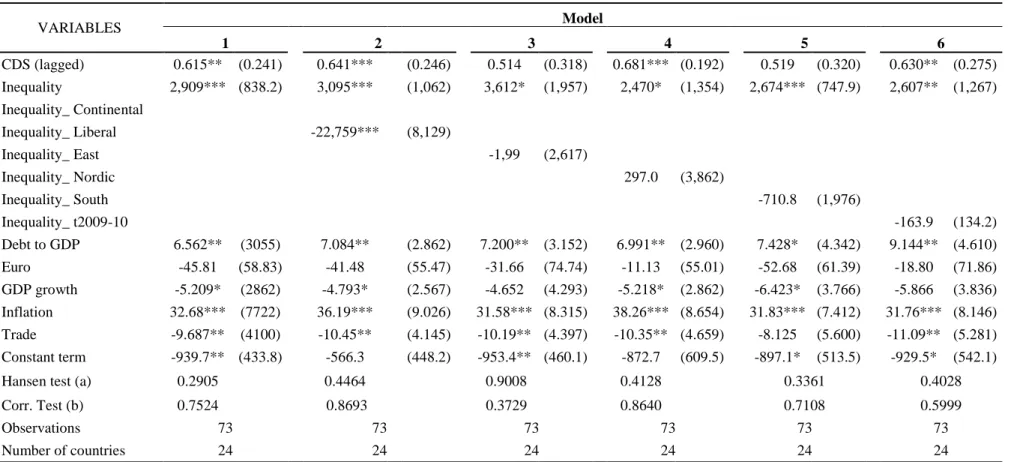
IV. Empirical Results ... 36
4.1 The Baseline Empirical Model ... 36
4.2 Controlling for the Endogeneity ... 40
4.3 Robustness Checks ... 44
III
Figure 2.1 CDS payment mechanism ... 12
Figure 2.2 European Sovereign CDS spreads 2005-2010 ... 15
Figure A.1 CDS spreads for 26 European sovereigns ... 68
List of Tables
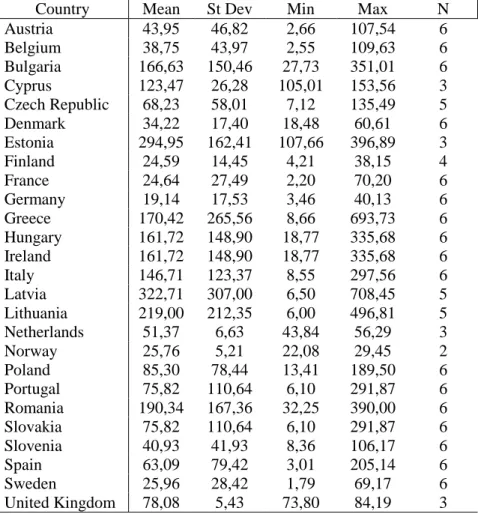
Table 3.1 Sovereign CDS spreads individual countries - Descriptive statistics ... 28Table 3.2 Variables of the analysis - Descriptive statistics ... 30
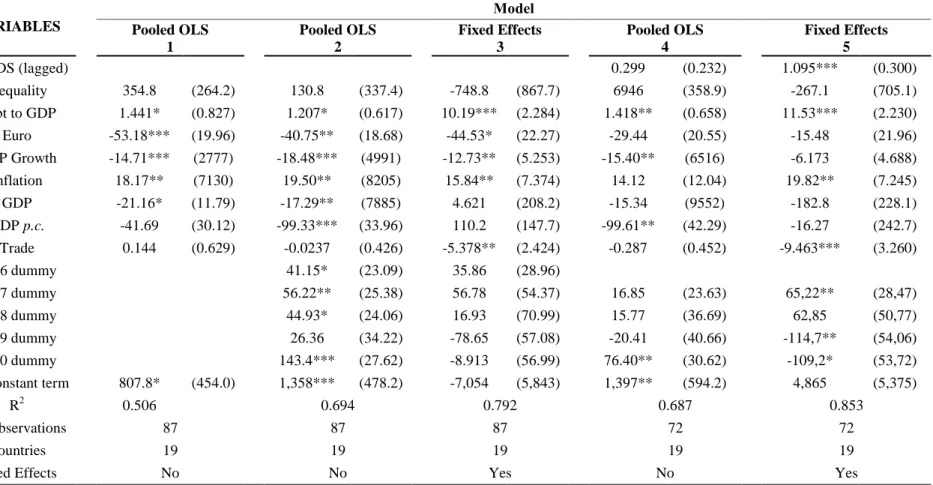
Table 4.1 Pooled OLS and Fixed Effects Regressions ... 40
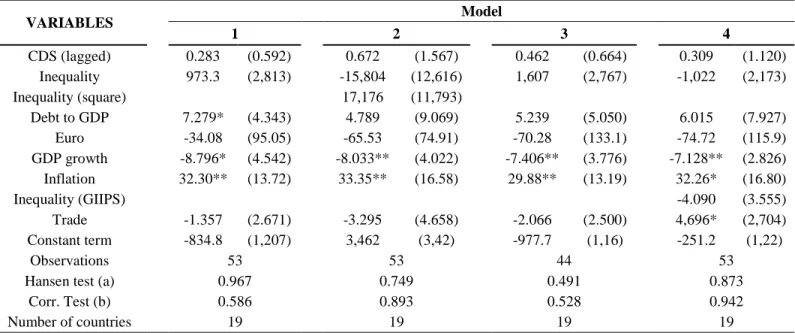
Table 4.2 Panel dynamics estimations 1 - System GMM estimations ... 42
Table 4.3 Panel dynamics estimations 2 - System GMM estimations ... 45
Table 4.4 Panel dynamics estimations 3 - System GMM estimations ... 49
Table A.1 Description of the variables ... 59
Table A.2 Details on data available (CDS spreads) ... 60
Table A.3 Income Inequality by country (own calculation) ... 61
Table A.4 Correlation analysis ... 62
Table A.5 Robustness Checks 3: Pooled OLSand Fixed Effects Regressions ... 63
Table A.6 Robustness checks 4: System GMM estimations ... 64
IV
% percent
CDS Credit Default Swaps
EAMS Euro-area Member States
ECHP European Community Household Panel
EU- EMU Members States of the European Monetary
Union
EU-SILC Statistics on Income and Living Conditions
FE Fixed Effects
i.e. idest (that is)
ISDA International Swaps and Derivatives
Association
GDP Gross Domestic Product
GIIPS Group of peripheral European Countries
(Greece, Italy, Ireland, Portugal and Spain)
GMM Generalized Method of Moments
LDC Less Developed Countries
LSDV Least Squares Dummy Variable Model
OECD Organisation for Economic Co-operation and
Development
OLS Ordinary Least Squares
R2 R-square (coefficient of determination)
S&P 500 Standard & Poor's 500 (Stock Market Index)
VAT Value Added Tax
VIX index Volatility Index Market (Chicago Board
Options Exchange)
1
I.
Introduction
The financial crisis that began in 2007 has brought to the surface a considerable number of issues and turned into the worst economic crisis since the Great Depression. In the light of this economic turmoil OECD countries faced growing public debt, while at the same time some European countries have severely violated the criteria drawn up in the Maastricht Treaty, which stipulates a threshold for the public debt of 60% of the national GDP. By 2010, the attention was on the heterogeneity of the sovereign risk perceived, and the challenges faced by the GIIPS group (Greece, Ireland, Italy, Portugal, and Spain) in adjusting their fiscal budgets in the context of a sovereign debt crisis (Caceres et al., 2010).
This study seeks to exploit explanations and causes for the European countries sovereign debt or credit risk based not only in financial indicators but also in structural features of the economies such as the income inequality. The motivation of this research is in line with Berg and Sachs (1988) empirical evidence, which states that “countries with high income inequality had a
significant greater likelihood, ceteris paribus, of having rescheduled their debts than did countries with low income inequality”. By considering the recent European economic context
which put into the fore economic issues as the sovereign debt and sovereign credit risk, it is formulated the following research question: is income inequality a significant determinant of the sovereign credit risk of European countries? This thesis turn to be an important research topic since it exploits an innovative view regarding the determinants of the sovereign credit risk alternative to the financial or macroeconomic indicators. The selection of the explanatory variable income inequality as a channel of influence of the sovereign credit risk provides an important link between the measure of sovereign risk and a social and political indicator. Therefore, given this assumption it is assessed whether income inequality constrains the mechanism through which policymakers take their policies towards attaining fiscal sustainability in the context of high government indebtedness and sovereign credit crisis.
From a theoretical viewpoint, inequality and the resulting distributive policies may affect economic growth, contribute to inflationary crises, and lead to massive capital flight (Berg and Sachs, 1988). The main argument of the thesis is hypothesized by Alesina and Rodrik (1994) and Person and Tabellini (1994) stating that higher income inequality creates a greater political
2
demand for redistributive policies, and politicians influenced by the (relatively poorer) median voter opt for (short-sighted) distortionary policies. Given this assumption, McColliste and Karayalçin (1994) developed a theoretical framework assuming that in unequal societies the redistributive policies are partially financed by foreign borrowing as government tends to respond to the voters pressures for redistribution. This in turn may lead to an increasing of default risk as international lenders limit the credit extent to these countries leading borrowing countries to invest less and grow at a slower pace. Following the same approach, Kim (2008) finds evidence supporting the hypothesis that the sovereign’s willingness to pay is highly influenced by the level of inequality of a country.
In contrast to these studies which focus on the linkage of the external debt crisis and income inequality of developing countries, this research seeks to exploit the recent economic context of developed countries which face increasing sovereign debts and evaluate the impact of income inequality as a determinant of the sovereign credit risk. The most common indicator to assess the income inequality derives from the “equivalised disposable income” (eg. Niehues, 2008; Stiglitz et al., 2009). Nonetheless, the introduction of the gross component adjusted by an equivalent scale enables to depict the role of the government redistribution on income. Therefore, I use in this analysis the “equivalised gross income” as main explanatory variable. This indicator is calculated from the EU Statistics on Income and Living Conditions (EU-SILC) enabling the construction of different inequality indexes based on microdata of European Countries. Another important difference is the adoption of a sample of countries encompassing different historical, political and economic realities such as the ex-USRR countries. Additionally, this study contributes for the literature by adding the credit derivatives contracts – Credit Default Swaps (CDS) – as an indicator of sovereign risk default.
The validity of the hypothesis that income inequality influences the size of a country sovereign debt and credit risk is tested by using a dynamic panel approach with 26 European countries and a time period from 2005 until 2010. As in Fontana and Scheicher (2010) study, the indicator adopted to represent the sovereign debt is the sovereign CDS spreads. On the other hand, the explanatory variable addressing income inequality is given by the Gini and Theil coefficients. Additionally, variables related with the macroeconomic considerations such as public debt, inflation, GDP and GDP growth are included in the analysis control variables. The econometric methodology starts with OLS models. Even though this method displays limitations in panel
3
studies, it serves as a clear starting point. In a further approach, fixed-effects models are used in order to control for all time-invariant differences between the countries. Additionally, the Arellano-Bond Generalized Method of Moments (GMM) estimator is used to deal with the issue of reverse causality in a dynamic panel design. This specification enables to evaluate the impact of income inequality on the sovereign credit risk by considering the explanatory variables income inequality and debt to GDP as endogenous variables.
The empirical results provided by the GMM estimator support the main hypothesis that income inequality plays a significant influence on the sovereign CDS euro spreads whereby the results are statistically and economically significant. However, results are sensitive to the choice of the inequality indicator.
The remainder of this thesis is organized as follows. Chapter 2 presents an overview of the available literature on sovereign credit risk and also on income inequality. Furthermore, this section describes the literature review based on the link between income inequality and sovereign default risk. The chapter concludes with the description of the development of the European economy focusing on the macroeconomic implications of the recent sovereign debt crisis and the main findings which attempt to assess the influence of the debt crisis on income distribution. Chapter 3 outlines the econometric methodology used in the regression analysis along with the approach to deal with possible econometric issues as heterogeneity and endogeneity of the explanatory variables. The second part of this chapter provides an overview of the data used in the empirical models and a statistical analysis of the variables. Chapter 4 presents the results of the analysis derived from different econometric specifications. The discussion of the results and the concluding remarks can be found in the Chapter 5, while it is also presented directions for further research on this topic.
4
II.
Literature Review
This section intends to identify the appropriate academic and professional fields of literature followed by the description of the main themes that are important for this study. It is worth to highlight that there has been yet not much published research on the interplay of debt sovereign with inequality income indicators.
2.1 Income Inequality
2.1.1 Income Inequality and Sovereign Credit Risk
Political economic literature has traditionally focused on studying income distribution as a consequence of macroeconomic performance and government policies (Barro, 2000). However, in the recent literature many empirical findings are indeed concerned with the reverse causality, i.e., how income inequality can explain macroeconomic performance. Although the present issue is not extensively studied in the literature, there are nevertheless some empirical studies that focus on the causality from income inequality to risk sovereign debt. Hence, the core of this issue dates back to the debt crisis in the 70´s and 80´s in Latin American countries where these countries faced huge external deficits while at the same time displayed a highly skewed income distribution. Berg and Sachs (1988) were the pioneers to state this issue, analyzing the association of the debt rescheduling of less developed countries (LDC) and the structural variables of the economy. This relationship is empirically tested by employing a cross-section probit model, based on a sample of 35 countries over the period 1977-1985 whose dependent variable relies upon the probability of rescheduling and non-rescheduling of debt of the countries. The intent of the model is to relate this variable with the degree of openness of the economy and social variables (level of income inequality, share of agriculture in GDP and the level of GDP per
capita). Further, the authors also aim at explaining the value of the debt in the secondary markets
in the year of 1987 in order to put forward this variable as an indicator of the credibility of the financial sector. The results from their models show that all the variables considered display a positive effect on debt rescheduling of the countries. Furthermore, their findings provide evidence that higher income inequality, as well as political and social instability is considered significant predictors of a higher probability of debt rescheduling in the context of external
5
financial crisis. This situation arises because income inequality decreases credibility of political stability, which is crucial for a successful macroeconomic management.
Also McColliste and Karayalçin (2004) developed a political-economic model based on the sovereign debt in the frame of the median voter theorem1. The central idea of this theorem concerns with the assumption that distributional policies affect the preferences of the majority of population, and thereby, influences political decisions (Alesina and Rodrik, 1994). This model states that foreign borrowing can be reallocated for two purposes: either public investments or transfers to the population. Governments take their decisions according to the population preferences. Hence, it is hypothesized that in more unequal societies, governments face higher demand for redistribution coming from popular pressures of agents with less than average incomes - the median voters - as they prefer redistribution policies rather than an increase of taxes proportional to income. The impact of pronounced demands for redistribution implies less investment as governments will use foreign debt to finance redistribution of income (higher current transfers) at the expense of lower public investment. On the other hand, countries with unequal distributions of income tend to redistribute more and, as a consequence, invest less because governments will tend to use the foreign loans to redistribute income rather than to invest in the public domain lowering the future income. In case a government opts to default, lending countries will impose a fraction of the countries income as a penalty. The sanctions or the repayment of debt required by the creditors’ countries is collected by leaving a proportional income tax. As the majority of population in countries with more unequal distributions of income prefers to receive higher transfers payments rather than paying a proportional tax, there will be more redistribution and less public investment leading to less income in the future. Therefore, governments which face less income in the future decrease the cost of sanctions that foreign creditors require in case of default as the creditors punishment will be lower due to lower levels of income. This effect will in turn increase the probability of default since creditors might anticipate that borrowing countries with less income will opt to default instead of paying its external debts. Following this assumption, international lenders impose credit ceilings leading the sovereign borrowers again to invest less and as consequence to grow slower.
1
Following the assumptions of Alesina and Rodrik (1994), the application of the median voter theorem should be interpreted as a proxy of the political process itself instead of considering all its assumptions literally.
6
These ideas are further examined by Kim (2008), whose findings rely on the demonstration of the influence of the sovereign default of a country and it relationship with the “willingness-to-pay” of a government and income inequality. The author uses the framework development by Meltzer and Richard (1981) stating that agents with lower income in relation to the average incomes, i.e., median income agents, will prefer that governments invest less and redistribute more. As external borrowing has to be repaid with future income taxes, median income agents will prefer that government incurs in default and redistribute rather than to pay future income taxes in order to pay the external debt. Therefore, given this, in economies with skewed income distribution, agents demand for default is subsequently higher resulting in a higher probability of default risk. Empirically findings are reached through a panel data model based on random-effects logistic regression to assess the effect of income inequality on the probability of default occurrence in 51 developing countries over the period of 1971 and 2003. Accordingly, his findings provide strong evidence that the probability of a country default follows an inverted U-relationship in which highly unequal democracies are less likely to “actually” default. Under this assumption, the author stresses that countries with more skewed income distribution are more likely to have denied access to foreign loans (and so they are less likely to default). Indeed, in more unequal countries, the risk of default is higher which in turn implies a higher probability of the borrowing country do not honor with its promise to repay the credit. Thus, through a simple model game the author asserts that rational creditors do not have the incentive to lend to countries with structural problems (corruption, inefficiency, irresponsibility). On the other hand, highly equal countries are also less likely to default because the sovereign’s willingness to pay is higher. Kim (2008) shows empirically a non-monotonic pattern relationship between the sovereign’s willingness to pay and the sovereign default. His findings support the assumption that democracies with intermediate income inequality are more likely to default than highly unequal or highly equal democracies. 2.1.2 Inequality and Redistribution
Empirical literature shows that higher income inequality entails more redistribution policies (to name a few, Bertola, 1993; Alesina and Rodrik, 1994; Person and Tabellini, 1994). Alesina and Tabellini (1989) are among the supports that have demonstrated that the more unequal is the level of income in society; the lower is the rate of economic growth. What accounts for the link of these two components are the redistributive policies. Essentially, the core of this assumption is that the level of taxation in a society is determined through a process of political participation of
7
the voters, reflecting their preferences for income redistribution. Following this argument, Meltzer and Richard (1981) depicted a theoretical model based on the median voter theorem asserting the agent preferences’ on redistributive policies. This model stresses the agent preferences’ trade-off between the benefits from redistribution (transfers) and their implicit costs (higher taxes). The rationale behind this model is that if the median income of the voter is below the average income, thus higher social demand for redistribution will be required by this agent through voting process. Given that, the median agent preferences play a crucial role on government fiscal policies decisions. Hence, given this mechanism, in more unequal countries is higher the demand for redistribution that is financed partly by distortionary taxes, which in turn implies lower rates of investment, and consequently, growth (Bertola, 1993; Alesina and Rodrik, 1994; Persson and Tabellini, 1994; Aghionet et al., 1999).
2.1.3 Income Inequality and Growth
The first approach to assess this issue was introduced by Kuznets (1955) which attempts to explain how the level of income affects income distribution in the long run. Most precisely, the author hypothesizes that structural changes in economies lead by the transition from agriculture to industry and services sectors is responsible for the increase of income inequality. The process of transition from an agricultural-rural economy, assuming lower and more equally distributed incomes, to an industrial-urban economy leads to an increase of income inequality in the earlier stages of economic development. However, as the level of output per capita of the economy grows reflected in the widespread of the new technologies and equalization of returns across sectors, income inequality tends to decrease (Kuznets, 1955). Under these conditions, the author assumes an inverted U-relationship between the degree of income inequality and the level of income.
Further research has been developed to test the relationship of economic growth and income inequality. Using cross-country datasets on income distribution, empirical findings have resembled that inequality can indeed harm economic growth (Alesina and Rodrik, 1994; Bertola,
1993; Bénabou, 1996; Persson and Tabellini, 1994; Perotti, 1996). Moreover, there are some theoretical researches that have assessed the question how different levels of inequality may lead to growth at different stages of development. Barro (2000) test this hypothesis focused on the impact of income inequality on economic performance conveyed in growth investment. His
8
findings rely on a panel random effect model using cross country regressions of 100 countries over the period of 1960-19952. The results from his study show little evidence on the assumption of a linear relationship between inequality and growth. However, using the same sample of countries but splitting it into poor and rich countries, the author points out the ambiguity of the effects of inequality on economic and investment growth. Thus, in poor countries inequality seems to have a harmful effect on the growth of the economy, whereas it appears to have a positive impact on countries with higher incomes. According to Barro (2000), one possible interpretation of this result is the credit market restrictions observed in poor countries. On the other hand, there are some other empirical evidences showing the inverse reasoning3. In conclusion, empirical literature partly provides different results related with the ultimate effect of income inequality on growth, showing positive, negative or not significant link. Hence, conflicting evidence in these studies appears to derive from different econometric methods employed, and data specifications.
2.2 Sovereign Credit Risk
The sovereign credit risk plays a significant role on the interplay of the financial markets. As a consequence, it affects directly the ability of investors to diversify the risk of sovereign’s debt portfolios influencing the capital movements across countries (Longstaff et al., 2011). The “credit risk” is broadly defined as the risk of loss resulting in the event of “default”. There are many factors that might contribute for the risk of loss, however these risks do not account for the perception of “credit risk”. The practical reason which leads to the inclusion of the “default” in this concept is due to the possibility of predicting default events thought historical data (Tavakoli, 2001). A sovereign default occurs when sovereign borrows announce their inability or willingness to honor their principal or interest payments, a restructuration or renegotiation of the repayment schedule, or a combination of the two events. In short, these scenarios imply that the main indicators whether a sovereign defaults or not are the debt payment on the due date and the rescheduling arrangement of the external debt (Rajan et al., 2007).
2
In this panel-data random effect model, Barro (2000) considers that the average growth rates over periods of ten years (1965-1975, 1975-1985 and 1985-1995), are dependent on the initial level of inequality in the years 1960, 1970 and 1980 respectively.
3
For example, Li and Zou (1998) and Forbes (2000) have showed that inequality can indeed foster economic growth.
9
2.2.1 Determinants of the Sovereign Credit Risk
In assessing the determinants of default of a sovereign, Reinhart and Rogoff (2009) identified five main drivers that might be in the root of a sovereign credit crisis, namely: (i) the amount of domestic debt; (ii) banking crisis; (iii) the external government debt; (iv) inflation outbursts, and (v) the currency crashes. Additionally, Standard &Poor’s (2012) credit rating agency has underlined a methodology to assess the sovereign credit risk analysis based on the following key factors: (1) economic structure and growth prospects; (2) institutional effectiveness and political risks; (3) fiscal performance and flexibility, as well as debt burden; (4) external liquidity and international investment position, and (5) monetary flexibility. The first element refers to the level of income as well as the economic growth accounting for the economic diversity and volatility. The second one considers the effects of the government institutions and policymaking on the sovereign credit risk. Moreover, it also emphasizes the role of the economic reaction to external shocks as well as the reliability and transparency of the data provided by sovereign institutions. The fiscal performance is based on the sovereigns’ fiscal and deficit positions along with the debt burden displayed by each country. The following determinant accounts for the international position of a sovereign’s currency in the context of international markets and external debt and also of the external liquidity. The last indicator of credit risk sovereign considers the assumption of the effectiveness of monetary policies decisions in light of the sovereigns’ ability to implement monetary policies as an instrument to promote fiscal sustainability.
Much of the existing empirical and theoretical research based on the determinants of credit sovereign risk is focused on the external debt of emerging economies (Berg and Sachs, 1988; Eichengreen and Mody, 2000; Longstaff et al., 2011). However, since the outbreak of the global financial crisis in 2008 a new body literature on the determinants of the sovereign debt default based on the CDS spreads has emerged focusing mainly on the euro-area countries. One thing that these studies have in common is the adoption of the CDS spreads as a measure of the market pricing of sovereign default risk.
Aizenman et al. (2011) develop an empirical model attempting to explain the pricing of risk related in the sovereign debt crisis using as main explanatory variable the “fiscal space” (debt/tax; deficits/tax) and macroeconomic determinants as control variables. This relationship is
10
tested by conducting a cross-country study of 60 countries over 5 years (2005-2010) and fixed effects, clustered standard errors, and GMM models. The authors find strong support for the hypothesis that an increase of the market pricing of CDS spreads may be significantly influenced by higher levels of sovereign debt and the fiscal position (past or current deficits/debts) in relation to the tax revenue. Further, through in-sample and out of-sample predictions Aizenman et al. (2011) also find evidences that the CDS spreads for five European peripheral countries were “underpriced” before the onset of the financial crisis whereas “overpriced” during the economic turmoil specially in the peak of the European sovereign debt crisis (in the year of 2010)4.
In the same line of the previous study, also Fontana and Scheicher (2010)5 seek an empirical work focused on the determinants of the credit default risk based on sovereign CDS by using data for 26 developed and developing countries from 2000 to 2010. Their results suggest that “global factors” such as the US stock market returns and high-yield markets as well as the volatility risk premium reflected in the VIX6 index has more impact on explaining the determinants of the CDS than the country-specific determinants, e.g., the equity returns, exchange rate, and foreign reserve. Additionally, following the Pan and Singleton (2008) model on decomposing the CDS spreads into default risk components and risk premium, the authors find evidence that the risk premium (on average) accounts for just one-third of the total credit spread. Other factors contributing for the nature of default implicit in the term structures of sovereign CDS spread are the country-specific and regional economic risks as well as the variations of investors’ appetites for credit exposure at a global level.
More recently a new strand of literature provides findings that the instability in the banking sector has been an important driver of sovereign credit risk in advanced economies. The mechanism underlying to this theory relies on the assumption that some banks are too important/big-to-fail, therefore governments injected big amounts of capital in order to guarantee liabilities on the banking system (Kallestrup, 2012).
4
The countries included in the sample are the following: Greece, Ireland, Italy, Portugal, and Spain.
5
Also Pan and Singleton (2008) suggest his empirical findings that variations in CDS spreads in Mexico, Turkey, and Korea were due to global factors such as the investors’ preferences for credit exposure rather than considerations of the state of the local economy of these specific economies.
6
The VIX index refers to the Chicago Board Options Exchange Market Volatility Index and is used as a measure of the implied volatility in the U.S. stock market (S&P 500 index).
11
All in all, the factors described above provide an explanation of the credit risk through the lens of fiscal and macroeconomic variables.
2.2.2 Mechanics of the Sovereign CDS Market
Since CDS are commonly used to assess credit risk, in this section I describe their mechanics. The credit derivatives were firstly launched at the meeting of the International Swaps and Derivatives Association (ISDA) in 1992. The global credit derivatives has shown a massive annual growth since then whereby they had reached its peak in January 2008 with the total notional amount outstanding of $62 trillion estimated by International Swaps and Derivative Association7.
A credit default swap (CDS) enables the contracting parties to trade or hedge the risk of a certain entity defaults – it can take the form of a corporate or a sovereign borrower8. A CDS contract is traded over the counter. These credit derivatives are defined as a bilateral agreement between two parties: a protection buyer agrees to pay a yearly premium to the seller for losses that might be incurred in the case of default of the reference credit entity (Bomfim, 2005). According to ISLA there are six important credit events (ISDA, 2001):
Bankruptcy: not relevant for sovereigns but only for corporate entities
Failure to pay: occurs when the reference entity fails to pay principal or coupon when they are due
Obligation default: regards to the technical default
Debt repudiation: takes the form of compensation and addresses actions by sovereign lenders
Restructuring of debt: in the case of restructuring or reduction of the due debt in order to restore the liquidity
Obligation acceleration: means when the payment becomes due before the expected expiration data
7
The gross notional value of the CDS spreads resembles the sum of CDS contracts bought from all counterparties accounting each trade once.
8
Although there are many channels thought which CDS spreads play an important role, this section will focus on the assumption CDS as a measure of credit risk.
12
The mechanism thought which the CDS market is based on is the following: one party, the protection buyer acquires a yearly premium - “default insurance” - until the occurrence of any specified credit events until the maturity of the contract. On the other hand, the protection seller agrees to make a payment to compensate the buyer in case the underlying CDS contract incur in default or the reference borrow cannot commit with its obligations due to its insolvency (Figure 1.1).
Figure 2.1 CDS payment mechanism
Source: Weistroffer (2009)
A CDS contract reassembles to an insurance policy, in which one party assumes the risk while the other part pays an underlying insurance premium. The (insurance) premium is agreed upon between the two parties in the beginning of the contract remaining usually constant until the contract reaches its maturity and it compensates the seller of bearing the underlined credit risk of a default. It calculation is given by the following formula:
CDS premium = PD * (1-RR)
Where the CDS premium represents the amount necessary to cover the expected loss of the reference entity. The parameter PD resembles the probability of default, whereas RR is the recovery rate. Generally the CDS premium is determinate on an annual basis; nonetheless its payment is done in quarterly terms. The Sovereign CDS spreads are quoting conventionally in basis points. For example a spread of 100 basis points, against 10,000,000 USD in sovereign debt for 5 years means that 1% of the notional amount has to be paid each year, so 0.01 x 10 million = $100,000 per year. Moreover, these financial derivatives quotes are represented by the investors’ perception of the sovereign credit risk and their willingness to bear the underlined risk (Fontana and Scheicher, 2010).
13
2.2.3 Government Public Debt and Macroeconomic Implications
Movements in the spreads of CDS can have significant macroeconomic consequences. On the monetary side, a rise in sovereign yields tend to lead to an overall increase in long-term interest rates in the rest of the economy, distressing both investment and consumption decisions. Whereas on the fiscal side, a rise in sovereign CDS spreads tends to be accompanied by a widespread increase of fiscal deficits and government debt. While in situations of economic turmoil central banks can expand monetary policy by using the interest rate as an instrument, in the euro-area countries policymakers face the lack of an independent self-governing monetary policy. This implies that in case of need to rebalance fiscal deficits the national authorities put all weight of the adjustment on fiscal measures (Bassanini and Scarpetta, 2003).
In the light of this, an enormous pressure from international markets was placed on the euro-area countries in order to make them pursue policies to stabilize the economy. In order to prevent a fall in the demand side and a further increase of pricing of the sovereign debt in European countries, fiscal interventions via debt restructuring and fiscal austerity were placed aiming to restore the international investors’ confidence. Fiscal policy settings may have an impact on the output in the medium run and also over the business cycle. In particular, if governments decide to finance the government expenditure through a raise of “distortionary” taxes (eg. direct taxes) may distort incentives affecting the level of output (Bassanini and Scarpetta, 2003). On the other side, higher spreads of CDS requires larger debt-servicing costs which indeed raise funding costs. Most specifically, if investors believe a default event might happen, they will demand higher default risk premium, implying higher interest rates. This could also entail an increase in rollover risk, i.e. repaying the public debt by issuing new debts, implying the payment of this debt in the future at extraordinarily high costs (Wright, 2011).
In a complementary analysis, when a government faces a high level of debt and at the same time displays a budget deficit, it is expected a decrease of national savings and a trade deficit, imposing the necessity to finance it through international lending. Given this linkage, the effects on the government debt are twofold. First, the high levels of public debt leads international investors to be aware of the possibility of non-payment and consequently the default of borrowing governments. The result of this assumption is a decrease of the demand of national assets in the international markets, and consequently a restrain of its international lending. On the
14
other hand, a large government debt induces a decrease of the credibility and plays influence in matters of international affairs (Mankiw, 2007).
2.3 The European Economic Context
2.3.1 The Sovereign Debt Crisis
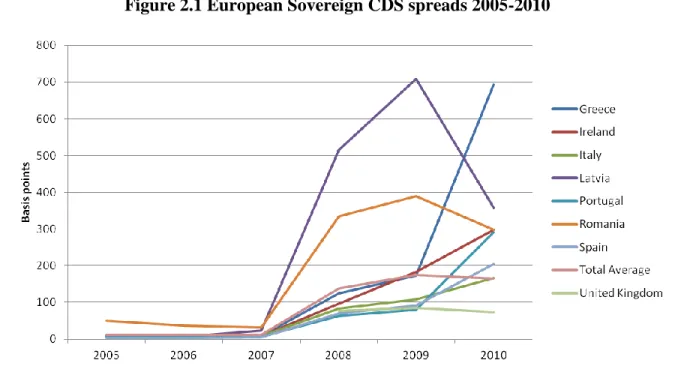
Since the onset of the global economic crisis in 2007 also known as the Great Recession (2007-2009), the sovereign risk premium differentials of European euro-area countries have showed an unprecedented increase (cf. Figure 1 in the Appendix). From this viewpoint, the observed rise of sovereign spreads might well reflect financial markets’ concerns about not only the state of national banking systems but also the credibility of the fiscal sustainability. This macroeconomic scenario of significant large government debts and budget deficits implied subsequently the engagement of restructuring plans and commitments to long-run fiscal discipline along the euro-area countries. During this period, the public debt to GDP of most of the advanced economies has increased from 70 percent in 2007 to about 100 percent in 2010 (IMF Fiscal Monitor, 2012). Similarly, the global financial crisis and its aftermath have put to the fore structural imbalances of a set of Europeans countries. At the core of the recent sovereign debt crisis are the Peripheral euro-area countries, namely Ireland, Portugal, Spain, Italy and Greece whose sovereign debt fragilities along with systemic financial problems9. For these countries, the macroeconomic consequences were more severe thereby their public debt reached in 2010, on average, about 134 percent of the GDP. By 2010 the CDS spreads of Italy, Ireland, Greece, Portugal and Spain reached their highest values and there were also the downgrades of their sovereign debt ratings (Figure 1.2). In this context, international markets have differentiated country risk across the government’s issuers, which in turn implies higher overall sovereign default risk premiums for most of the countries with fiscal fragilities.
Although there is a common fiscal framework for European countries designed to exert pressure among all state members states, regarding the establishing of targets for the national public debts, some EMU member economies have severely violated the criteria drawn up in The Stability and Growth Pact (SGP) in which the government budget deficit and Government national debt should
9
In particular, Greece, Ireland and Portugal were subject to external aid under financial assistance from the European Union (EU), the International Monetary Fund, the European Central Bank and other UE members in order to attain fiscal sustainability by reducing the public deficits and sovereign debt burdens.
15
be less than 3% of GDP and 60% of GDP, respectively. The countries that signed the Maastricht Treaty towards the creation of an Economic and Monetary Union (EMU) not only have lost their national authority in terms of monetary policy, but also have limited independency on the policy (fiscal), which is restrained by the fiscal requirements of the SGP that seeks to guarantee a sustainable fiscal equilibrium while promoting economic growth
Figure 2.1 European Sovereign CDS spreads 2005-2010
Source: Bloomberg
2.3.2 Distribution of Income and Government Public Debt
In the literature there is no generalized consensus around the link of causality of the fiscal consolidation followed by indebted governments and the skewing income distribution (eg. Ball et al., 2013). There is, however, empirical evidence showing that income inequality indeed displays a significant increase in periods of fiscal consolidation. To assess this issue, Agnello and Sousa (2011) pursue an analysis of eighteen global economies during the period 1978-2009. Their findings are in line with the assumption that in periods of economic distress, the income distribution is affected following the implementation of fiscal measures to reduce the public deficit. Additionally, it is assessed that the impact of fiscal consolidation varies according to the size of the consolidation program as a proportion of GDP, ie., austerity programs larger than 0,77
16
p.p. of GDP induce a higher impact on inequality. Furthermore, the inequality in income appears to amplify in the period following the crisis namely in the aftermath of a banking crisis.
In the OCDE the overall redistribution impact is attained though the transfer systems, that is, the expenditure side of the government budget, whereas the tax systems pays a smaller role on income redistribution side. One of the main significant consequences of fiscal consolidation is the rise of unemployment by affecting wage earners at a greater extent than others economic agents, which may lead to a persistent and continuous increase in inequality in the long-run. In this context, to balance the costs of fiscal measures against the potential rise of unemployment, and consequently the income inequality, it is preferred to implement such measures at a slow pace jointly with policies to promote economic growth, such as incentives to job creation (Ball et al., 2013).
The magnitude of the impacts of contractionary policies on the distribution of income depends to a large extent on the progressivity and weight of the consolidation instrument. These instruments are fiscal policies designed to reduce the public deficit or limit its growth (eg. cuts in benefits or public pensions, increased income taxes and/or reduced tax concessions, increased worker social insurance contributions, increased property taxes and increased standard rate of VAT).
Secondly, policy measures associated to debt consolidation through spending costs generally drives to a deterioration of the economic activity and to a subsequent increase of unemployment. This effect in turn might entail a declining wage share, which in turn exacerbates income inequality (Ahrend et al., 2011).
Past fiscal consolidations have showed that contractionary policies result in an increase of income inequality through two channels. The first one relies on the impact of debt consolidation on the level and progressivity of tax, while the second mechanism on the consequences of a decline of the output leading to an increase of unemployment. Accordingly, the consolidation of government debts usually takes the form of expenditure policies, revenue policies or a mix between the two. On the expenditure side, the adoption of measures to reduce government transfers implies nevertheless an increase of income inequality. This effect arises due to the progressive feature of the transfers thereby a decrease of this component generally lead to an increase of income inequality. (Christensen et al., 2011).
17
III. Data and Methodology
This chapter describes the sources of the dataset used in this analysis as well as the variables and their specifications as an input for the empirical study. Additionally, it is outlined the methodology along with the econometric techniques employed to test the main hypothesis of this analysis. The last part of the chapter provides an outlook of the descriptive analysis of the CDS spreads sorted by country and also of the overall variables of the study.
3.1
Source of Data
The data used to analyze the level of income inequality across countries and over time in this study is based on micro data derived from the household survey European Union Statistics on Income and Living Conditions (EU-SILC). This dataset aiming at provide cross sectional and longitudinal data relying on multidimensional microdata in the field of income, poverty and social exclusion. The EU-SILC survey was implemented in 2003 in six European countries, whereby in 2005 was launched in all of the 25 Member States, being extended afterwards to Bulgaria, Romania and Malta when they join the European Union10. EU-SILC dataset was preceded by the European Community Household Panel (ECHP), which was the main source of primary data on income and living conditions in the European Union used by the Eurostat during the period of 1994-2001. Considering some shortcomings displayed by this survey namely the income definition that was not in harmony with the international practice (according to the Canberra recommendations)11, the launch of the EU-SILC was of the upmost importance to introduce several new components and methodologies. Therefore, the EU-SILC displays several advantages as a tool for analyzing household income and living conditions when compared with other sources of data. First and contrary to its predecessor it provides more flexibility to the Member States on adopting their own sample designs and data compilation. The “target”
10
More specifically, the first launch of data (relating to the year 2004) embarrasses information on 13 Member States (Austria, Belgium, Denmark, Estonia, Finland, France, Greece, Ireland, Italy, Luxembourg, Portugal, Spain and Sweden), plus Norway and Iceland. By 2005, Germany, the Netherlands and the United Kingdom took part in the survey, along with the rest of the new member states (Cyprus, Czech Republic, Hungary, Latvia, Lithuania, Poland, Slovakia and Slovenia). Finally, from 2007 onwards, the EU-SILC assessing all 27 Member States, further includes Turkey, Switzerland Norway and Iceland as non-members.
11
Further details about the Canberra recommendations on:
18
variables are set out and follow the common procedures, guidelines and concepts set in the Framework Regulation. Second, the survey design differs markedly from the ECHP as the EU-SILC takes form of a rotating panel instead of a pure panel survey allowing the introduction of new members each year in the sample and also reducing the panel duration generally from 8 years to 4 years. Additionally, this survey reports cross sectional and longitudinal data, which in turn does not have to be connected. Finally, and one of the most important points to recall is the definition of the household income according to the Canberra recommendations. Hence, new components are introduced in the household income definition namely: transfers paid to other households, tax adjustment/tax on wealth, interest paid on mortgage loans, imputed rent, non-cash employee income, value of goods produced for own consumption, and employers social insurance contributions. Moreover, it is accounted the negatives values of self-employment while in the ECPH were set to 0.
One of the main advantages of the EU-SILC database when compared with other datasets is that enables to provide information relying on the total gross income (individual income components such as earnings, self-employment income, transfers are reported as gross values) and the total disposable household income before transfers. Whereas, the ECHP dataset records solely provides income components net of income tax and social insurance contributions, the EU-SILC reports net and gross income components.
The pricing data of CDS spreads and the government bond spreads used in this analysis are obtained from Bloomberg. The series are based on an annual average of daily values corresponding to ten-year maturation titles embarrassing a sample of 26 European countries (cf. Table 1.2 in the Appendix). The time period covered in the sample is January 2005 to December 2010. The period and the country selection are in line with the data available collected from the EU-SILC for the purpose of income inequality analysis12. Sovereign CDS instruments initially began to be traded in the over-market-counter just in 2004, and there is a significant lack of data especially until the year of 2007 in which the majority of countries display sovereign CDS quoted in the international markets. Additionally, the ten-year horizon is chosen as the one that reveals most liquidity and also because it is the most common period referred in the literature. It is
12
19
important to highlight, nevertheless, that as in the case of the income inequality indicators, not all countries are included in the sample for the full period13.
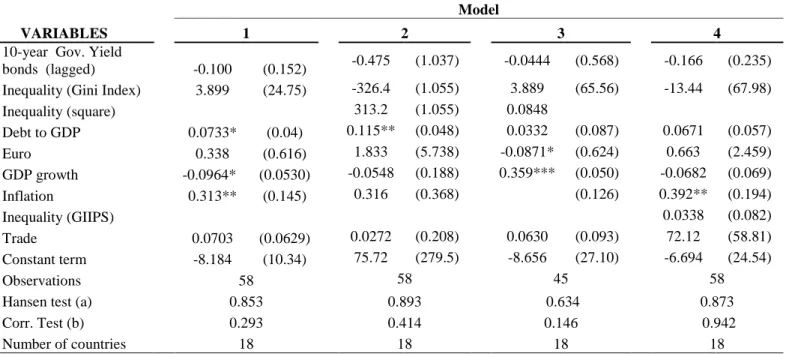
Additionally, as robustness check, to assess the impact of income inequality on the sovereign credit risk, a sample panel model of the spread between the yield on ten-year sovereign bonds of eighteen OECD countries14 and Germany is estimated over the period January 2005 to December 2010. The data are based on the annual average of monthly values from Bloomberg corresponding to ten-year maturity titles embarrassing the sample of 19 European countries used in the present analysis. As a consequence of using German bond yields as a benchmark its observations are not included in the analysis.
The remaining control variables used in the empirical analysis with the exception of the dummies variables were retrieved from the World Development Indicators (WDI) from the World Bank Group and also from the Eurostat database.
3.2
Description of variables
153.2.1 Key Independent Variable
The main independent variable in which empirical models are based on is represented by the income inequality over the period of 2005-2010 and across different countries16.The selection of countries and time period is in accordance with the micro data available in the household survey European Union Statistics on Income and Living Conditions (EU-SILC) provided by the Eurostat in October 2012, which was used to obtain income inequality in gross terms. In approaching the question of income inequality, a set of methodological questions have to be accounted in order to allow a cross-country and intertemporal comparability of the data with maximum consistency and avoiding biased estimates (Deininger and Squire, 1996).
13
Luxemburg and Malta do not display sovereign CDS therefore were excluded from the analysis.
14
From the data sample of this analysis, 19 are currently member countries of the OECD. This subsample encompasses the following countries: Austria, Belgium, Check Republic, Denmark, Finland, France, Germany, Greece, Hungary, Ireland, Italy, Netherlands, Norway, Poland, Portugal, Slovakia, Slovenia, Spain, Sweden, Switzerland, and United Kingdom.
15
Variables are described in Table A.1 in the Appendix.
16
The countries included in this study are: Austria (AT), Belgium (BE), Germany (DE), Denmark (DK), Cyprus (CY), Czech Republic (CZ), Spain (ES), Estonia (EE), Finland (FI), France (FR), Greece (GR), Hungary (HU), Ireland (IE), Italy (IT), Latvia (LV), Lithuania (LT), Netherlands (NE), Poland (PL), Portugal (PT), Romania (RO), Sweden (SE), Slovakia (SK), Slovenia (SI) and United Kingdom (UK).
20
Traditionally, income inequality can be measured on a net or on a gross basis. The starting point of the definition of the income according the EU-SILC methodology corresponds to the original income17. This source of income includes income from state funded pensions. The stage number two of the analysis regards the definition of the gross income thereby it is obtained by the sum of original income and cash benefits. The cash benefits include the unemployment, old-age, survivor', disability, sickness benefits; plus the family/children, education-related and housing allowances; plus the benefits for social exclusion or those not elsewhere classified. At last, the disposable income is given through the deduction of the direct taxes and regular inter-household cash transfers paid to gross income. Thus the disposable income includes all monetary incomes received from any source by each member of the household (including income from work, investment and social benefits) plus income received at the household level and deducting direct taxes (tax on income and social insurance contributions, regular taxes on wealth) and regular inter-household cash transfers paid (Eurostat, 2009).
Deininger and Squire (1996) emphasize the importance of differentiate disposable (or net) income and gross income among countries analysis. Their recommendations lie on the assumption that gross income should be chosen over net income as it reflects the taxation redistribution from richer to the poorer. In light of this, it is argued that what contributes for the difference among gross and net income across countries is the effectiveness and progressivity of their tax system. Hence, these differences might be of higher importance in developed countries considering the significant role of redistributive taxation in these countries. If one considers the Scandinavian countries (Sweden, Norway, Iceland, and Denmark) might expect a more remarkable gap between net and gross income inequality whereby redistribution policies play an important role on their political decisions. Nonetheless, also Germany and United Kingdom show a relatively high discrepancy between levels of gross and net incomes (Jauch and Watzka, 2012). These examples are important to demonstrate at what extent the different income components may affect the magnitude of unequal income distribution interpretation. Also Persson and Tabellini (1994) adopt the concept of “personal income before tax” as the most suitable indicator
17
The original income from market encompasses employee cash or near cash income, non-cash employee income, cash benefits from self-employment, value of goods produced for own consumption, income from rental of a property or land, regular inter-household cash transfers received, interest, dividends, profit from capital investments in unincorporated business, income received by people aged under 16, pensions from individual private plans and old age benefits.
21
of income inequality. Kim (2008) also prefers gross income over net income. On the other hand, Stiglitz et al. (2009) shows that the most adequate income concept towards the measurement of income inequality is the household disposable income also known as “adjusted household
disposable income”18
, once it has been adjusted for publicly-provided in-kind transfers. Similarly, the empirical studies of income inequality based on the Luxemburg Income Study (LIS) (Voitchovsky, 2005) and ECHP datasets (Nieuhs, 2008) also report income inequality on a net basis by using the disposable income. Although there is not a generalized consensus around which concept of income inequality is the most adequate, in some empirical findings both components are applied. For example, in Barro´s (2000) and Jauch and Watzka (2012) analysis, the net and gross income is transformed in dummies variables to measure income inequality. Considering the availability of the EU-SILC database on providing information relying on the total gross income (individual income components such as earnings, self-employment income, transfers are reported as gross values), the gross income will be chosen over net income as a measure of income inequality. The use of gross income allows having a better idea of the effort that is required to the government in terms of social transfers and taxes to reduce inequality. For instance, two countries with the same net income inequality may have different gross income inequalities. The country with larger gross inequality has to do larger social transfers and impose larger distortionary taxes (Aghion et al, 1999) to reduce inequality, which may reduce its growth prospects and affect sovereign risk. This is why I argue that gross income is a better indicator to assess sovereign risk. This indicator is named in this study as the gross equivalised income as it refers to the gross income indicator accounted for the differences in the households’ composition and the underlined economies of scales resulted from such structural differences within them. Given that, the adoption of the income inequality indicator in gross terms will emphasize the role of the redistribution on the government’s redistributive policies by providing a clearer picture of the income inequality on the analysis.
The criteria used in the EU-SILC survey to deal with the income distribution data in based on the following assumptions (Eurostat, 2005):
The period over which income is measured is in the accordance of the Canberra Group recommendations taken a year as a reference. The length of the reference period reflects
18
22
the natural accounting period for sources of income related with the self-employment income or income tax data.
The unit of observation and the income recipient unit in analysing income can be based on the distribution of income across households or rather on individuals. In the EU-SILC dataset the income distribution is measured considering the total household members income. A broader income recipient unit such as the household distribution income is traditionally preferred to gauging the living conditions of populations once it captures the overall situation of the living standards of the individuals in terms of their household income.
Another important point to be considered in the income distribution analysis is the adjustment of the size and composition of different households. For this purpose, it is used the “modified OECD” equivalence scale, thereby the total household income is divided by its equivalent size. This scale assigns a weight of 1.0 to the head adult of a household, 0.5 to all remaining adults aged 14 or more and 0.3 to each child less than 1419. The results obtained by using the “modified OECD” equivalence scale is therefore a consistent measure of welfare of each member in society defining the equivalent income of the household in terms of individual members.
Since Eurostat only offers information on the net income Gini index, I was forced to calculate the Gini index from micro data (cf. Table A.3 in the Appendix).
Measures of Income Inequality
To account for the income inequality variable two well-known measures of inequality of a distribution are used: the Gini coefficient and the Theil’s first measure. In the literature, the Gini coefficient is generally used as the main reliable indicator to measure income inequality. Nevertheless, in order to complement the analysis the Theil index is adopted mainly due to its property of additive decomposability (Nieuhes, 2008).
Furthermore, these two measures derive from the Generalized Entropy (GE) family, which in turn assess different approaches regarded with income distributions (Fields, 2001). Although different measures imply differences views, there are four main criteria that any equality measure should
19
The ‘modified OECD’ equivalence scale of [1 + (0.5 × number of additional adults) + (0.3 × number of dependent children)].
23
possess: (i) the anonymity, which implies that individuals’ specific identities should not be accounted for the income inequality (ii) population independence, which requires independence of the measure of inequality towards population changes (iii) income scale independence, which assumes that income inequality does not vary according to income scale, i.e from the units of income and their magnitude; (iv) Pigou-Dalton transfer sensitivity, rely on the assumption that an income transfer from higher-income person to lower income person (with no other changes in the income distribution) conveys an reduction of income inequality.
(i) Gini Coefficient
The Gini (1914) coefficient is commonly interpreted through the concept of the Lorenz Curve, thereby this cumulative frequency curve graphs the distribution of a variable (income, in this case) towards an uniform distribution that embodies equality. The graphical interpretation of the Lorenz Curve depicts the cumulative proportion of income on the vertical axis versus the cumulative proportion of household on the horizontal axis. Given that, the Gini coefficient can be obtained through the ratio of the area between the 45-degree line and the Lorenz Curve (concentration area) to the area of maximum concentration. Whereas the maximum concentration area is represented by one distribution where only one individual owns the total income, the 45-degree line (equidistribution line) represents a concentration area equals to zero, which means perfect equality. Formally, assuming a population of n individuals (or households), where i = 1, …n, with xi as the income of the person i, the Gini coefficient equals:
∑ ∑
(1)
However, the measure addressed in this analysis to compute income inequality is based on the standard of the Gini coefficient given by:
∑ ∑
(2)
Given that, in the case in which the standard Gini coefficient equals to zero the distribution faces the maximum equality, if on the other hand it corresponds to one, means complete income inequality (one single individual or household possesses all the income and the others receive none). Concerning to the sensitivity to changes in the shape of the distribution, the Gini
24
coefficient reacts mostly to the transfers in the middle of the distribution. Despite this indicator is the most widely used as a measure of income inequality, also has some limitations. As an example, this coefficient remains unchanged even if a significant change in the distribution of income occurs (e.g. a demographic change). Similarly, although some economies display similar incomes and Gini coefficients does not mean they have similar income distributions.
(ii) Theil Index
Contrary to the Gini coefficient, Theil’s index (T1) reacts mainly to changes at the bottom end of
the distribution. Considering the average income ̅ of the overall population n, the Theil Index is given by:
∑
̅
̅ (3)
The Theil index ranges from zero, with zero assuming a perfect equal distribution and infinity, whereas higher values mean higher levels of inequality.
3.2.2 Dependent Variable
The indicator adopted in the present study to measure the market perception of sovereign default risk is the ten-year spreads on sovereign CDS. Many indicators are generally used as measures of the sovereign credit risk such as the sovereign bond spreads, the sovereign credit ratings, or the interest rate spread of sovereign debt, only to name a few. From a theoretical point of view, the differences between sovereign bonds spreads and CDS spreads should be approximately equal to zero under perfect market conditions (Packer and Suthiphongchai, 2003). Nevertheless, Fontana and Scheicher (2010) have proved that the difference between CDS prices and the spreads on the underlying government bond, also known as “basis”, was substantially different from zero in the Eurozone CDS markets during the financial distress in 2010. The main factors that contributed for these differences were the global risk appetite and local specific factors.
Additionally, there are other reasons seeking to explain the reasons behind the differential on the “basis” driven mainly by technical factors, interbank lending, and counterparty risk. For instance, the maps of cash flows of the CDS and bonds contracts do not match exactly leading to differences in their spreads. The CDS as indicators of credit perception do not include funding, whereby the variation of their prices is less sensitive to liquidity considerations when compared