ASSOCIAÇÃO DE POLITÉCNICOS DO NORTE
(APNOR)
INSTITUTO POLITÉCNICO DE BRAGANÇA
NATIONAL, REGIONAL OR INDUSTRIAL EXPLANATION FOR BUSINESS DEMOGRAPHY IN THE EUROPEAN UNION SINCE 2010 UNTIL 2014 – A SHIFT-SHARE
APPLICATION
Kseniia Shinkarenko
Final Dissertation submitted to
Instituto Politécnico de Bragança
to obtain the Master Degree in Management, Specialisation in Business Management
Supervisors:
Alcina Maria de Almeida Rodrigues Nunes
Tatiana Khvatova
ASSOCIAÇÃO DE POLITÉCNICOS DO NORTE
(APNOR)
INSTITUTO POLITÉCNICO DE BRAGANÇA
NATIONAL, REGIONAL OR INDUSTRIAL EXPLANATION FOR BUSINESS DEMOGRAPHY IN THE EUROPEAN UNION SINCE 2010 UNTIL 2014 – A SHIFT-SHARE
APPLICATION
Kseniia Shinkarenko
Supervisors:
Alcina Maria de Almeida Rodrigues Nunes
Tatiana Khvatova
i
Abstract
Among the main concepts of business demography there are the concepts of business births (creation) and deaths (closure), whose importance for the business cycle is well recognized in the specialised literature. Indeed, firms’ entry and exit are critical for the continued dynamism of modern economies (Cavallari, 2015; Klapper & Richmond, 2011). Traditionally, creation and closure of new firms and its variations across regions have been associated with regional factors. Still, a region can have an aggregate rate of activity that differs from that of the nation because it has a different mix of industries and/or because it enjoys comparatively more favourable local conditions for that activity (Fotopoulos & Spence, 2001). Thus, business demography in a given spatial area and during a particular time period may be driven by the business cycle, industrial composition, as well as regional advantage (Cheng, 2011). With the previous framework in mind, the research work is dedicated to analyse each of the three factors that may have driven business demography in European Union countries between 2010 and 2014 (a 5 year period), and to find out which of them has/have been the most important one(s). For this purpose, a shift-share decomposition analysis of business creation and business closure will
be applied. The impact of the macroeconomic framework, the industrial composition, and the regional influence was computed to identify the share of impact of each component. The results of the study proved that regional component had the highest influence on both firms’ births and deaths during the studied period of time for almost all countries included in the analysis. Only for few countries and in specific industries the most influential factor was the industrial composition of the economic activity, and even for less the national macroeconomic path. Since the applied methodology is just exploratory and not explanatory, the results allow only generating ideas and hypotheses that may be important in order to uncover the relations between firms’ births and deaths and regional characteristics, industrial mix, and national economy growth.
ii
Resumo
Entre os principais conceitos de demografia empresarial encontram-se os conceitos de nascimento (criação) e morte (encerramento) de empresas, cuja importância para o ciclo económico é reconhecida na literatura especializada. De facto, a entrada e a saída de empresas nos mercados constituem-se como fatores críticos para o dinamismo contínuo das economias modernas (Cavallari, 2015; Klapper & Richmond, 2011). Tradicionalmente, a criação e encerramento de novas empresas e respetivas variações têm sido associadas a fatores regionais. Ainda assim, uma região pode apresentar uma taxa agregada de atividade que difere daquela da economia porque possui uma combinação diferente de indústrias/atividades e/ou porque goza de condições locais comparativamente mais favoráveis para o exercício de uma determinada atividade (Fotopoulos & Spence, 2001). Assim, a demografia empresarial num determinado espaço e durante um determinado período de tempo pode ser impulsionada pelo ciclo económico, composição industrial e vantagem regional (Cheng, 2011). Face ao exposto, o trabalho de investigação dedica-se a analisar cada um dos três fatores acima mencionados que podem impulsionar a demografia empresarial nos países da União Europeia entre 2010 e 2014 (um período de 5 anos) e descobrir qual/quais deles foi/foram o(s) mais importante(s). Para o efeito, será aplicada uma análise estatística shift-share que decompõe os valores observados para a criação e encerramento de empresas em três componentes. O impacto da conjuntura macroeconómica, da composição industrial e da influência regional será calculado para identificar a parcela de impacto de cada componente. Os resultados do estudo provam que a componente regional possui maior influência tanto nos nascimentos como nas mortes das empresas durante o período de tempo estudado para quase todos os países incluídos na análise. Apenas para um conjunto reduzido de países, e para um conjunto de indústrias específicas, o fator mais importante foi a composição industrial da atividade económica. O mesmo se verifica para a tendência macroeconómica observada na União Europeia durante o período. Uma vez que a metodologia aplicada é apenas exploratória e não explicativa, os resultados permitem apenas gerar ideias e hipóteses que podem ser importantes para descobrir qual a relação existente entre os nascimentos e mortes das empresas, as características regionais de cada economia, a combinação industrial prevalecente e o crescimento do bloco económico europeu.
iii
Реферат
Основными понятиями в бизнес-демографии являются открытие (рождение) и закрытие (смерть) бизнеса. Важность этих процессов для экономического цикла общепризнана в специализированной литературе. Традиционно, процессы открытия и закрытия фирм, а также их разнообразие по регионам, связывались с региональными факторами. Тем не менее, регион может отличаться по совокупному уровню деятельности от страны в целом в связи с тем, что он располагает определенным набором отраслей промышленности и/или потому, что условия в регионе более предпочтительны для отдельной отрасли промышленности. Таким образом, бизнес-демография в данной отдельной области (регионе) в течение определенного временного периода может быть обусловлена экономическим циклом, набором отраслей промышленности или региональными преимуществами. Данная исследовательская работа посвящена анализу каждого из этих трёх факторов, повлиявших на бизнес-демографию в странах Европейского Союза в период с 2010 по 2014 годы (5 лет). Основная задача состоит в том, чтобы выяснить, какие из этих факторов имели наибольшее влияние на процессы открытия и закрытия фирм. Для достижения поставленной цели был применен анализ структурных сдвигов и региональной конкурентоспособности (shift-share анализ). Результаты
исследования подтверждают тот факт, что региональный фактор имел наибольшее влияние на процессы как открытия, так и закрытия фирм практически для всех анализируемых стран в течение исследуемого периода времени. Только для небольшого количества стран в определенных отраслях промышленности наиболее важным фактором являлась промышленная составляющая, в то время как национальный фактор играл важнейшую роль в процессах открытия и закрытия фирм лишь в очень редких случаях. Поскольку используемая методология не ставит своей задачей объяснить причины отдельных событий, полученные результаты позволяют лишь выдвигать идеи и гипотезы, которые, тем не менее, могут быть важны в попытке выявить связи между открытием/закрытием бизнеса и характеристиками региона, набором отраслей промышленности и ростом национальной экономики.
iv
v
Acknowledgements
I would like to thank all those who were beside me during this period of my life for all the help, support and inspiration.
At first, I would like to give special thanks to Erasmus+ International Credit Mobility Programme (ICM) for giving me the opportunity to study management in a Master Programme in the Instituto Politécnico de Bragança (IPB), to graduate and be awarded with a double master diploma.
I would like to thank also my two universities – Peter the Great St. Petersburg Polytechnic University (SPbPU) and Instituto Politécnico de Bragança – and all my professors for interesting lectures and
knowledge transmission.
In special, I would like to express my gratitude to my supervisors: Alcina Nunes (IPB’s supervisor), for her excellent guidance and supervision, useful comments and relevant suggestions, as well as constant availability and engagement through the whole process; and Tatiana Khvatova (SPbPU’s supervisor) for her effort, advices and encouragement even from far away.
Warmest thanks to my family for their belief, motivation and constant support not only throughout this work period, but in all my life. I will be grateful forever for your love.
Finally, I would like to thank my friends and colleagues, who were part of my academic life.
vii
Abbreviations and/or Acronyms
AUT – Austria BEL – Belgium BGR – Bulgaria CYP – Cyprus
CZE – Czech Republic DEU – Germany
EIP – Entrepreneurship Indicators Programme ESP – Spain
EST – Estonia
Eurostat – European Statistics FIN – Finland
FRA – France
GBR – United Kingdom HUN – Hungary
IM – Industrial mix component IRL – Ireland
ITA – Italy LVA – Latvia LTU – Lithuania LUX – Luxemburg NLD – Netherlands
NS – National share component
OECD – Organisation for Economic Cooperation and Development POL – Poland
PORDATA – Portugal Database PRT – Portugal
ROU – Romania
RS – Regional shift component SVK – Slovakia
SVN – Slovenia SWE – Sweden
viii
Table of Contents
List of Figures ... ix
List of Tables ... xi
Introduction ... 1
1. Business demography: literature review on the concept ... 4
1.1. Firm demography: definitions and applications ... 4
1.2. Business creation: premises and conditions ... 5
1.3. Business closure: premises and conditions ... 8
1.4. National, regional and industrial analysis of firm creation and closure ... 10
2. Research methodology: shift-share analysis ... 12
2.1. Objective of the study ... 12
2.2. Variables and databases ... 12
2.3. Shift-share analysis methodology ... 14
3. Presentation and analysis of the shift-share empirical results ... 17
3.1. Descriptive characterisation of the data ... 17
3.2. Shift-share results and analysis ... 23
3.2.1. Firms’ births ... 23
3.2.2. Firms’ deaths ... 36
Conclusions, limitations and future research lines ... 47
References ... 50
Appendix A1. Shift-share decomposition of the growth rate in firms’ births between 2010 and 2014, by country ... 56
ix
List of Figures
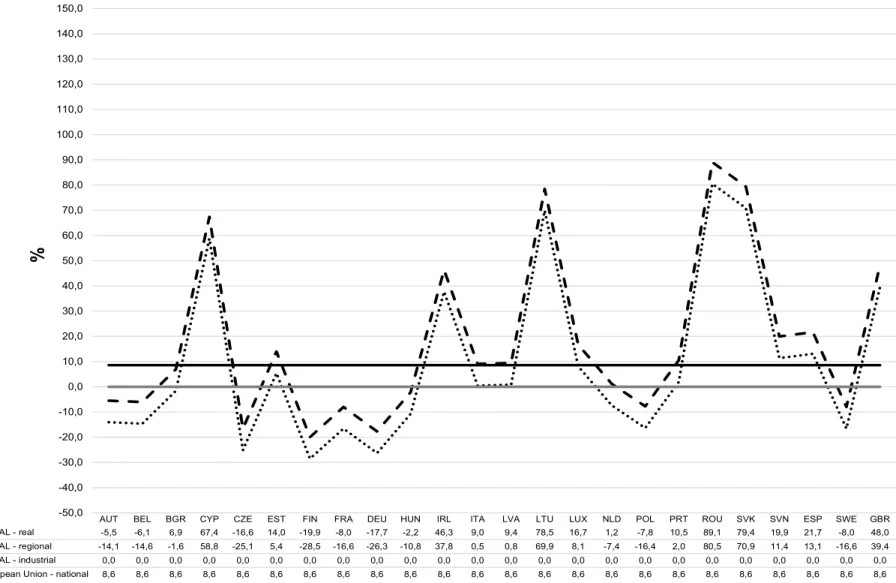
Figure 1. Shift-share decomposition compared with the real growth rate of firms’ births for all sectors of activity, between 2010 and 2014, by country ... 26
Figure 2. Shift-share decomposition compared with the real growth rate of firms’ births for the manufacturing sector, between 2010 and 2014, by country ... 27
Figure 3. Shift-share decomposition compared with the real growth rate of firms’ births for the construction sector, between 2010 and 2014, by country ... 28
Figure 4. Shift-share decomposition compared with the real growth rate of firms’ births for the services sector, between 2010 and 2014, by country ... 29
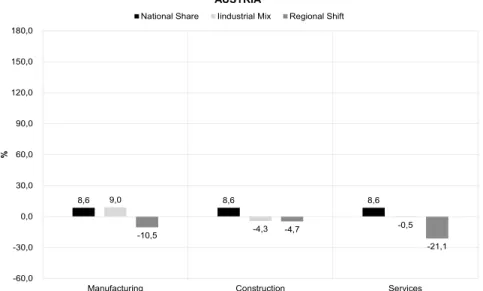
Figure 5. Shift-share decomposition of the growth rate in firms’ births between 2010 and 2014, in Austria ... 31
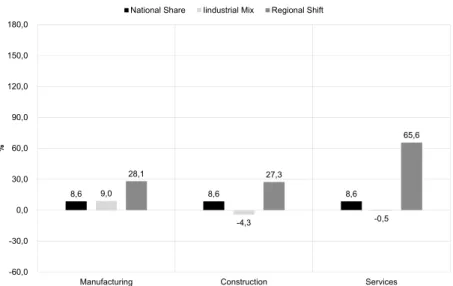
Figure 6. Shift-share decomposition of the growth rate in firms’ births between 2010 and 2014, in Romania ... 31
Figure 7. Shift-share decomposition of the growth rate in firms’ births between 2010 and 2014, in Cyprus ... 32
Figure 8. Shift-share decomposition of the growth rate in firms’ births between 2010 and 2014, in the Netherlands ... 33
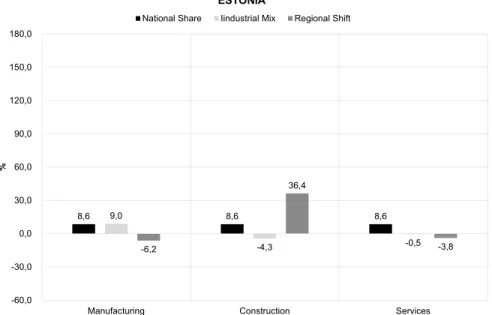
Figure 9. Shift-share decomposition of the growth rate in firms’ births between 2010 and 2014, in Estonia ... 34
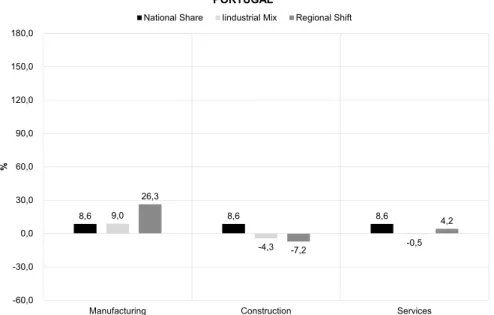
Figure 10. Shift-share decomposition of the growth rate in firms’ births between 2010 and 2014, in Portugal ... 35
Figure 11. Shift-share results by component in total compared with the real growth rate of firms’ deaths between 2010 and 2014, by country ... 38
Figure 12. Shift-share results by component for the manufacturing sector compared with the real growth rate of firms’ deaths between 2010 and 2014, by country ... 39
Figure 13. Shift-share results by component for the construction sector compared with the real growth rate of firms’ deaths between 2010 and 2014, by country ... 40
x
Figure 15. Shift-share decomposition of the growth rate in firms’ deaths between 2010 and 2014, in Lithuania ... 43
Figure 16. Shift-share decomposition of the growth rate in firms’ deaths between 2010 and 2014, in Bulgaria ... 43
Figure 17. Shift-share decomposition of the growth rate in firms’ deaths between 2010 and 2014, in Ireland ... 44
Figure 18. Shift-share decomposition of the growth rate in firms’ deaths between 2010 and 2014, in France ... 45
xi
List of Tables
Table 1.Types of business exit ... 9
Table 2. Number and percentage variation of the number of firms’ births by sector of activity and by European Union country, between 2010 and 2014 ... 18
Table 3. Number and percentage variation of the number of firms’ deaths by sector of activity and by European Union country, between 2010 and 2014 ... 21
Table 4. Growth rate of firms’ births regarding the national, industrial and regional shift-share components and real growth rates, by country and activity ... 24
1
Introduction
Business demography is one of many possible applications of the whole demography concept. It studies births and deaths and evolution of firms as three key events that determine the population (Schrör, 2008; Van Dijk & Pellenbarg, 1999), as well as firms’ age, change in size, growth and decline, mergers and spin-offs (Van Wissen, 2002; Van Dijk & Pellenbarg, 1999) that also can be viewed as important events in firm demography. However, the main concepts of business demography are still business creation (births) and closure (deaths).
New business formation, which is a creation of a new company as a combination of production factors, as agreed by many researches in the field of entrepreneurship and business demography, plays an important role in the process of economic development. It leads to changes in market structure and competition environment, it as well may result in shifting of national competitive advantage, and industrial restructuring (Cheng, 2011). New firms provide new ideas and innovation to an economy which in a large extent contribute to a long term economic growth (Baptista, Escária & Madruga, 2008). Business closure or the end of firm’s activity, despite being usually referred to as negative event, has the main goal of resources reallocation (Havila & Medlin, 2012) and can be beneficial on both macroeconomic level, providing business opportunities for new and more efficient businesses, as well as on microeconomic level, ensuring personal development (Schutjens & Stam, 2006). The importance of firm creation and closure for the business cycle is well recognized (Cavallari, 2015). Firm entry and exit is critical for the continued dynamism of modern economies (Klapper & Richmond, 2011). According to Schumpeter (1954) industries evolve through a process of ‘creative destruction’ where new firms can threaten the survival of existing ones.
2
comparatively more favorable local conditions for that activity (Fotopoulos & Spence, 2001). Therefore, not only regional advantage, but business cycle and industrial composition as well may drive business demography in a given spatial area and time period (Cheng, 2011).
Having in attention the importance of the concepts previously explained and their business context, the main research objective is to analyze factors such as macroeconomic environment (business cycle), industrial composition and regional advantage that have driven business demography, in particular business creation and closure, in European Union countries in a period between 2010 and 2014 – the recent five years period for which published comparable statistical information exists for three different dimensions: national, regional and sectorial - and to understand which of them has/have been the most important one(s) regarding the establishment of new firms and the death of others.
To reach the objective proposed, the study analyses two variables – firms’ births and firms’ deaths – using quantitative statistical data on the annual number of births and deaths of enterprises, which is publicly available on PORDATA, in three main economic sectors of activity – manufacturing, construction and services – in 24 countries of the European Union: Austria, Belgium, Bulgaria, Cyprus, Czech Republic, Estonia, Finland, France, Germany, Hungary, Ireland, Italy, Latvia, Lithuania, Luxembourg, Netherlands, Poland, Portugal, Romania, Slovakia, Slovenia, Spain, Sweden, United Kingdom.
The study results will be obtained by applying the statistical method of shift-share decomposition analysis – quick, simple and inexpensive (this is considered pivotal) research tool for investigating structural changes that occur in regional space during a given period of time (Sobczak, 2012). Traditional shift-share analysis decomposes economic changes in a region into three additive components: national share (business cycle), industrial mix (industrial composition), and regional shift (regional advantage) (Stimson, Stough & Roberts, 2006). The three components sum to the total shift, which is, specifically for this research, the actual growth or decrease in firms’ demography if analysing firms’ births or deaths, respectively. This methodology is not explanatory, thus, it does not give the answers to what are the exact reasons of occurrence of certain events in business demography, but is an important exploratory statistical method. In the case of this research work, it allows identifying key aspects that require special attention as well as generating ideas and hypothesis to uncover the relations between firms’ births and/or deaths and regional characteristics, industrial mix and national economy growth. Moreover, allows to understand the subject of business demography by European Union economy, the regions in a major economic space, and over time.
3
kind of analysis in terms of firms’ closure. Thus, this research work is of significant value in this field of knowledge and provides substantial contribution to the future research on the topic.
4
1. Business demography: literature review on the concept
1.1. Firm demography: definitions and applications
The term demography derives from two ancient Greek words: demos, that means people, and grapheria, that means description or measurement (Markowicz, 2014). Demography is, therefore, a
statistical study of populations. Although, traditionally, it is concerned with populations of humans in a wider sense it can be considered as a study dealing with demographic processes (inflow, outflow, ageing or internal change) of any population (Van Wissen, 2002). Thereby, demography of firms is one of the many possible applications of the demography concept.
Literature provides many variants of demography of firms such as organizational demography, business demography, corporate demography or firmography (Carroll & Hannan, 2000; Garcia-Posada & Mora-Sanguinetti, 2015; Van Dijk & Pellenbarg, 2000; Wiersema & Bird, 1993), which, in general, can be considered the same. In this research work the expression “firm demography” will be used for greater convenience.
Firm demography is a new and developing scientific discipline (Markowicz, 2014). It is a multidisciplinary research field that includes economics, sociology and economic geography (Van Wissen, 2002). It studies births and deaths and evolution of firms as three key events that determine the population (Schrör, 2008; Van Dijk & Pellenbarg, 1999). Firms’ age, change in size, firms’ growth and decline, mergers, and spin-offs (Van Dijk & Pellenbarg, 1999; Van Wissen, 2002) can be viewed also as important events in its demography.
5
the fact that firms are shaped to a large degree by the circumstances existing at the time of their founding. Moreover, economic, political or natural events have a strong effect on firm behaviour and overall performance. Therefore, the economic cycle (the calendar time) is one important factor to consider - it is easier to start a firm, acquire new customers and survive in a growing market rather than in declining one. Size is also an important indicator of firm demography, as it is the major form of heterogeneity in firms’ performance and there are important interactions between a firm’s size and age. First of all, they are highly positively related since the older the firm is, the larger in size it tends to be. Secondly, there is a negative relation between firm growth (change in size) and age since the growth rate is lower for older firms rather than for younger ones. Third, this interaction is quite complex in regards to firm mortality; numerous studies have shown that for smaller firms the risk of mortality increases with age. Finally, the firm’s environment (its location) has a major impact on its behaviour and performance. Firms can operate at local, regional, national or international levels and in all these locations exists a competitive environment and they have to deal with many stakeholders (customers, workers, suppliers, competitors, government) (Van Wissen, 2002).
In the particular case of this research, the focus of analysis will be placed on the concepts of business creation (birth) and closure (death). Such concepts will be discussed in more detail in following sections.
The business demography is a new and developing scientific discipline that is proving its importance. According to Eurostat (2017a), firm demography delivers key information for policy decision-making and for monitoring the progress of different programs and measures that support business activity, namely entrepreneurship policies. The obtained data can be used to analyse the dynamics and innovation of different markets. For instance, in terms of the propensity to start a new business or the contribution of newly-born enterprises to the creation of jobs. Simultaneously, being a relatively new field of scientific research, there are still many problems that need to be considered and solved regarding the structure of firms demography and methodology of data collection and analysis. Nevertheless, firm demography provides data that can contribute to better understanding processes within population of firms and future consequences of certain events on a local, regional, and (inter)national scale.
1.2. Business creation: premises and conditions
According to Eurostat (2017b), enterprise birth is the creation of a combination of production factors with the restriction that no other enterprises are involved in the event. So, births do not include entries into the population due to mergers, break-ups, split-off or restructuring of a set of enterprises. It does not include, also, entries into a sub-population resulting only from a change of activity.
6
(Klapper & Richmond, 2011). Small firms also ensure the competitiveness of the economy as they create a competitive environment and give the economy the flexibility, mobility and ability to perform rapid changes (Krekova, Shevchenko, Shchinova, Zelinskaya & Akhmadeev, 2016). Indeed, new firms are the platform for introducing new ideas and innovation to an economy. These are considered as keystone elements for long term economic growth (Baptista et al., 2008). New firms that survive in the competitive environment displace incumbent firms that do not present new ideas and do not innovate (Klapper & Richmond, 2011). That is why the effect of new businesses creation on economic development is sometimes called “creative destruction” (Changoluisa & Fritsch, 2014), following the idea introduced by the seminal work of Schumpeter (1954).
7
2016). Previously, entrepreneurship research has been focused only on examining the opportunity seeking behaviour. However, nowadays, the transformative nature of entrepreneurship (helping the poor get out of poverty) has been recognized which led to a new stream of research (Sahasranamam & Sud, 2016). Opportunity entrepreneurs are attracted by a promising idea and act appropriately to pursue an opportunity, while necessity entrepreneurs are forced into self-employment by external factors when they see no better alternative of earning money (Deli, 2011). According to Zali, Faghih, Ghotbi & Rajaie (2013) a business which has been set up to exploit a market opportunity is more likely to have a greater propensity to grow than a business for which the main drivers are push factors (e.g. unemployment or job dissatisfaction).
Traditionally, business creation and its variations across regions have been associated with regional factors, although it also can be influenced by macroeconomic fluctuations, industrial structures, and regional characteristics (Cheng, 2011).
Devece et al. (2016) point out that the macroeconomic environment and economic crises are important push factors to start a new business due to the lack or absence of viable alternatives. Nofsinger and Reca (2014) argue that government efficiency and the legal system are positively related with firm birth rates1. Francis, Hasan and Wang (2008) support that new firms are generally small and they, in most
cases, heavily depend on the credit provided by the banking system for their start, survival and continuous growth. Finally, Burrows (2015), relying on the work of many authors, states that entrepreneurial culture2 – the social context in which entrepreneurial behaviour is encouraged – has an
influence on new firm formation.
Authors like Piacentino, Bono, Cracolici and Giuliani (2017) demonstrate that new business formation (and its determinants) show a significant dependence on place or region where the new firm is located. In addition, according to Fotopoulos (2014), there are six primary processes that affect business creation on a regional level: (1) local demand, since at the time of formation (and for at least first period of operation) many new firms tend to serve local markets; (2) urbanization/agglomeration because large cities are still very attractive for people who want to start business3; (3) unemployment, although
it has ambiguous effect on new firm formation4; (4) personal household wealth since, according to
1 Business policies that impose burdens on large companies stimulate formation of new small businesses but at the same time
can lead to failure of existing firms, increasing firm deaths rates.
2 Entrepreneurial culture includes both the attitude to risk-taking and orientation of political, educational and financial institutions
towards entrepreneurship.
3 Firms at the beginning prefer to be located in more highly urbanized areas (Piacentino et al., 2017) due to the easier access to
important resources such as knowledge and highly qualified labour (Knoben, Ponds & van Oort, 2011). Thus, population density and urbanization have significant positive effect on new firm formation activity. Nevertheless, there are as well several downsides, such as possible raise in land and labour cost due to increased competition for these resources that can lead to decreasing in start-up rates (Knoben et al., 2011)
4 On one hand, unemployment can increase the supply of potential entrepreneurs as people are pushed to start their own
8
Fairlie (2013), personal wealth may be used both as financial capital for business start and as collateral for business liabilities and guarantees in case a person decides to use bank loans; (5) small firm presence because individuals working in small firms have a wide range of task experience, they are familiar with the entire spectrum of operational processes and have greater familiarity with market conditions increasing their probabilities to be entrepreneurs (Burrows, 2015); and (6) public regional policy which can affect business creation in different ways (creating barriers for entry or on the contrary making the process simpler)5.
An additional factor influencing firm formation is the industrial restructuring that, nowadays, is associated with either shift from manufacturing to services or a shift to higher level of technology, or a reduction in both firm and plant size. Shift to services may increase firm birth rate, while domination of large firms in the region may result in decrease on new firm formation (Armington & Acs, 2002). As was mentioned above, knowledge is one of the key factors of new firm formation. Knowledge is acquired by incumbent firms and research organizations, such as universities, and spilled over, generating entrepreneurial opportunities for new startups (Cheng & Li, 2012). Knowledge spillovers contribute to the economic growth through entrepreneurship (Knoben et al., 2011). Another deriving finding is that regions with more knowledge generating organizations and capacity have higher rates of entrepreneurship (Knoben et al., 2011).
It is observed in many cases that births of new firms are caused by deaths of the existing ones. The death of firms allows the replacement and release of resources that can be used in more productive ways (Brown, Lambert & Florax, 2013). Due to this fact, the phenomenon of business death will be examined in the following section.
1.3. Business closure: premises and conditions
The term ‘business closure’ is applied to define the end of an activity. However, the term has several synonymous in the literature as ‘enterprise death’, ‘firm death’, ‘firm closure’, ‘firm exit’ or ‘business exit’.
Eurostat (2017b) provides the following definition of an enterprise death: “a death amounts to the dissolution of a combination of production factors with the restriction that no other enterprises are involved in the event. Deaths do not include exits from the population due to mergers, take-overs, break-ups or restructuring of a set of enterprises. It does not include exits from a sub-population resulting only from a change of activity. An enterprise is included in the count of deaths only if it is not reactivated within two years. Equally, a reactivation within two years is not counted as a birth”.
On a firm-level, exit behaviour is specific to the firm and driven by an intra-firm process such as productivity development. At the same time, it is exogenous to the firm and specific to the economy
9
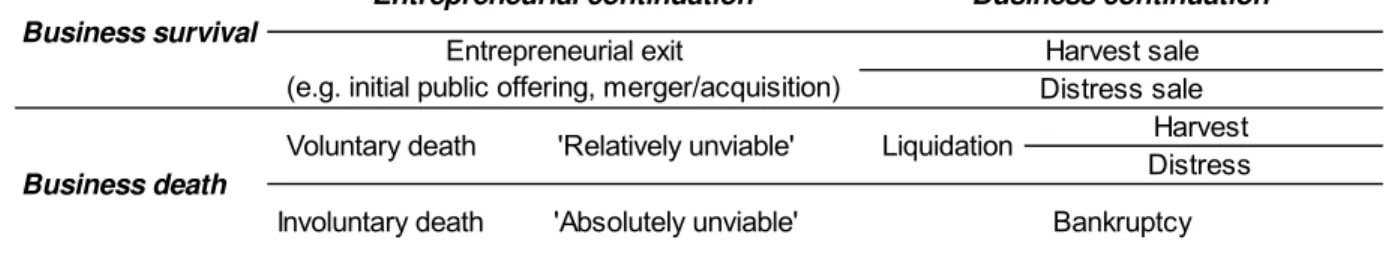
(Schröder & Sørensen, 2012). The main goal of business closure is the reallocation of resources (Havila & Medlin, 2012). Table 1 presents the types of business exits.
Table 1.Types of business exit
Source: Coad, 2014, p. 723
Entrepreneurial exit, when business continues operations under new management or with new investors should not be considered as business death6. According to Coad (2014), business exits can
be successful or unsuccessful depend on whether the decision was made voluntary (when business is ‘relatively unviable’ due to existence of better outside opportunities or personal reasons) or involuntary (when business is ‘absolutely unviable’ and the entrepreneur is forced into closure by banks or other creditors). Voluntarily business closure is usually made out of anticipation of failure and refers to either a ‘harvest’ liquidation of a profitable business or a ‘distress’ liquidation of a firm under financial or economic distress; at the same time, involuntary business closure always relates to bankruptcy. In a perfect world economically distressed companies should exit through liquidation with opportunity to pay off all creditors in full and rearrange resources for more productive use; however, if sales proceeds cannot cover all firm’s liabilities, it exits through court procedures that in most of the cases result in bankruptcy. The probability of going bankrupt rather than follow voluntary liquidation process is higher for older and larger companies (Balcaen, Manigart, Buyze & Ooghe, 2012).
According to Geurts and Van Biesebroeck (2016), exit rates are declining with age and size. The main determinant of firm exit is size. Small firms have much higher exit rates than large ones (Klapper & Richmond, 2011)7. Young and mature firms have different reasons and procedures of exit. The
business dynamic pattern shows that young firms may either survive with very rapid net growth or exit quickly for several reasons such as: (i) inability to reach a given level of productivity that will allow them to cover costs of entry in a short period of time; (ii) failure to get access to finance resources; (iii) lack of knowledge, among others (Balcaen et al., 2012). Apart from economic difficulties, there is also a
6 As follows from the definition of ‘business death’ given by Eurostat, presented above.
7 For instance, Cavan (2016) highlights the reasons for business closure in retail industry where firms are basically small in size.
Retail stores close due to underperformance, trade area alignments, retailer bankruptcy, or opportunity realization.
Business continuation
Liquidation Distress Harvest
Bankruptcy Distress saleHarvest sale
Involuntary death 'Absolutely unviable'
Business death Business survival
Entrepreneurial continuation
Entrepreneurial exit
10
variety of noneconomic reasons such as ageing or health issues of managers (owners) (Harada, 2007). Although mature firms have reached high level of productivity, have learned from the past experience and have built up a resource base, they exit because of worsen competitive position on the market (Balcaen et al., 2012).
Wasileski, Rodríguez and Diaz (2011) point out that one of the reasons for business closure that should be taken into account are natural disasters such as earthquakes, tornado, tsunami, etc. The impact is twofold: physical damage to business infrastructure (e.g. building, equipment) and lifeline disruption (damage of services such as communication, electricity, transportation etc.). The determinants of business vulnerability to natural disasters that can lead to business closure are the type of business sector, size of a business, financial condition, and preparedness behaviour.
It is important to note, that business closure involves and affects company-internal (e.g. employees) and company-external (e.g. suppliers or customers) parties. Thus, earlier experiences of ending, understanding of different types of commitment and the interdependence between them are important to foresee issues in a closure and handle with it in a proper way (Havila & Medlin, 2012).
Although business closure is usually referred to as negative event, it can be beneficial on both macroeconomic level, providing business opportunities for new and more efficient businesses, as well as on microeconomic level, ensuring personal development (Schutjens & Stam, 2006).
1.4. National, regional and industrial analysis of firm creation and closure
The importance of firm creation and closure for the business cycle is well recognized (Cavallari, 2015). Klapper and Richmond (2011), for example, refer that firms’ entry and exit are critical for the continued dynamism of modern economies. According to Schumpeter (1954), industries evolve through a process of ‘creative destruction’ where new firms can threaten the existence of existing ones.
As abovementioned, start-ups are affected by both macroeconomic fluctuations and industry-specific characteristics (Klapper & Richmond, 2011) as well as by characteristics of regions in which they operate. Several studies show that the more diverse is the industrial base in the region, the higher is the rate of new firm formation in that region. Such an observation can be explained by the idea that a high degree of diversification provides a higher variety of available skills and experiences which can enhance entrepreneurial choice and opportunity (Fotopoulos, 2014).
11
recently, Bradley and Klein (2016) state that country-level characteristics even if appear stable over time, depend on constant changes in political and legal conditions, social and cultural norms that affect entrepreneurial activity.
According to Cheng (2011), new firm formation varies significantly in different industrial sectors and across regions with various industrial specializations. Thus, industry-specific characteristics are one of the sources of firm births. New firm formation varies between industries due to different patterns in demand changes, different innovations and different levels of barriers to entry (Fotopoulos, 2014). Most studies confirm that the majority of new firm founders establish businesses in the industry in which they already worked and have experience. However, industries differ at their ease of entry, which makes it logical to assume that industries with high barriers to entry will have lower new firm formation rates (Burrows, 2015).
Grek, Karlsson and Klaesson (2011) found that firms’ deaths negatively relate to employment rate and level of education: the higher se last rates are the lower is firm’s exit rate in all sectors of economy. Moreover, they state that there is a significant positive impact of small firms presence on firms’ deaths in all sectors: the higher the share of small firms the higher is the exit rate of firms. Varum and Rocha (2012) studied the effect of crises on firms’ exit and concluded that recession serves as a catalyst of firms’ exit and has more impact on it than crisis itself. They also found that there is a moderating effect of the firm size: large firms have a greater increase in exit hazard than smaller ones during recession as well as in crisis due to the fact that large size may be the reason for inertia and inability to adapt fast to a changing environment. Carree, Verheul and Santarelli (2011) consider a ‘domino effect’ in connected industries, when high level of exits in one sector will lead to the same results in others; this effect is industry-specific and typical, for example, for services.
12
2. Research methodology: shift-share analysis
2.1. Objective of the study
The main research objective is to calculate and analyse the impact of factors such as business cycle, industrial composition and regional advantage that may drive business demography, in particular business creation and closure, in the European Union countries in a recent period of five years between 2010 and 20148 which was characterised by a general financial, economic and political
instability. The main idea is to understand which of these factors has/have been the most important one(s) regarding their impact on the establishment of new firms and the death of others.
2.2. Variables and databases
In the analysis two variables were used: firm birth and firm death.
According with the definition of Eurostat (Eurostat, 2017b), used in the Entrepreneurship Indicators Programme (EIP), a firm birth is ‘the creation of a combination of production factors with the restriction that no other enterprises are involved in the event. Births do not include entries into the population due to mergers, break-ups, split-off or restructuring of a set of enterprises. It does not include, also, entries into a sub-population resulting only from a change of activity’.
Firm death is ‘the dissolution of a combination of production factors with the restriction that no other enterprises are involved in the event. Deaths do not include exits from the population due to mergers, take-overs, break-ups or restructuring of a set of enterprises. It does not include exits from a sub-population resulting only from a change of activity. An enterprise is included in the count of deaths only if it is not reactivated within two years. Equally, a reactivation within two years is not counted as a birth’ (Eurostat, 2017b).
13
Quantitative statistical information on numbers of births and deaths of enterprises is publicly available on PORDATA9 (PORDATA, 2017). In this research the information will be analysed regarding new
firms’ formation and firms’ closure in three main economic sectors of activity – manufacturing, construction and services – in 24 countries of the European Union.
According, with the metadata from Eurostat, an activity takes place when resources such as equipment, labour, manufacturing techniques, information networks or products are combined, leading to the creation of specific goods or services. So, according with the statistical definition, an activity is characterized by an input of products (goods and services), a production process and an output of products. Therefore, an industry consists of a group of local kind-of-activity units engaged in the same, or similar, kind-of-activity (PORDATA, 2017).
According to Eurostat (Eurostat, 2017d), manufacturing includes “both cottage industries (crafts) and large-scale industrial production of: food, drinks and tobacco; textiles; leather and leather goods; paper and paper products, including printing and publishing; timber and wooden furniture; chemicals; artificial fibres; rubber and plastics; non-metallic mineral products; metal products. Excluded from manufacturing are mining and extraction; building and civil engineering; energy and water”. Construction is “a structure connected with the ground which is made of construction materials and components and/or for which construction work is carried out. In this respect, the preparation of soil, planting or sowing, etc. for agricultural purposes are not regarded as constructions” (Eurostat, 2017c). Finally, services are “activities performed by an enterprise for another enterprise and/or the public administration. They include: technical services (engineering, architecture and technical studies); computer services (software design and database management); other professional services (legal, accounting, consultancy and management services)” (Eurostat, 2017e). In this particular research data for services includes wholesale and retail trade; transport and storage; accommodation, catering and similar; real estate activities; consulting, scientific and technical activities; administrative and support services activities.
The European Union countries considered in the analysis are: Austria, Belgium, Bulgaria, Cyprus, Czech Republic, Estonia, Finland, France, Germany, Hungary, Ireland, Italy, Latvia, Lithuania, Luxembourg, Netherlands, Poland, Portugal, Romania, Slovakia, Slovenia, Spain, Sweden, United Kingdom, - for which data is obtainable for the investigated period of time which is since 2010 till 2014. Croatia, Denmark, Greece and Malta were excluded from the analysis due to absence of required
9 Pordata is a database of contemporary Portugal created in 2009 and organized and developed by the Francisco Manuel dos
14
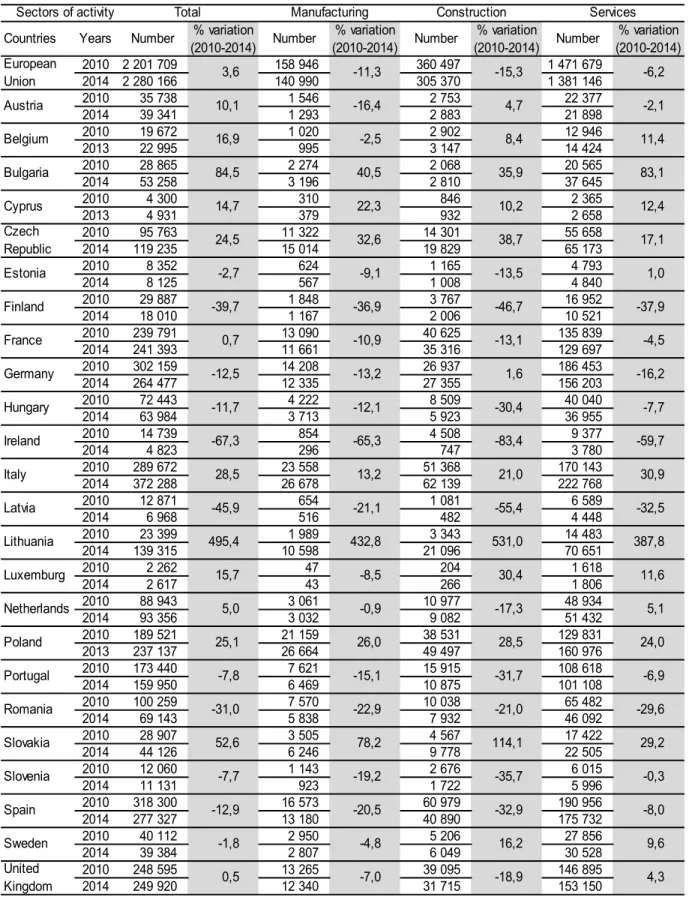
information. In case of firm deaths, for Belgium, Cyprus and Poland there is no information available for 2014 which is why for these countries the analysis was made for the time period since 2010 till 2013. It is important to notice that for some countries data consist of approximate figures as it is hard to collect the exact information on amount of born and dead firms. Moreover, for Services as they contain
several sub-sectors (wholesale and retail trade; transport and storage; accommodation, catering and similar; real estate activities; consulting, scientific and technical activities; administrative and support services activities) in each country final figures were obtained by simply adding the data available for all sub-sectors. Data for European Union10 was as well acquired by summing up numbers for each
country included in the analysis.
2.3. Shift-share analysis methodology
Shift-share analysis was introduces in 1960 by Dunn (Davis & Rodriguez, 2014; Dunn, 1960). It is the research technique for investigating structural changes that occur in regional space during given period of time (Sobczak, 2012). Thus, shift-share analysis organize data using three dimensions such as geography, sectors of activity, and time (Artige & van Neuss, 2014). This is a quick and inexpensive tool widely used for analysis of competitiveness of region’s various industries relative to a nation’s general level of economic development; it can help evaluate the performance and composition of local economy (Dogru & Sirakaya-Turk, 2017).
Shift-share analysis is used to explain economic change (growth or decline) as combination of three factors that influence it: national – ‘share component’, sectoral (industrial) and regional (local) – ‘shift components’. It presents a dynamic picture of the contribution of each factor to the local growth: the driving effect of national growth, specific mix of industries and its growth rate compared to national average, and relative competitive advantage/disadvantage of the regional industries (Goschin, 2014). Shift-share analysis is widely used by planners, geographers and regional scientists in political economy, retail analysis, migration analysis, regional growth analysis etc. (Knudsen, 2000).
There is a vast body of research literature using shift-share analysis in different areas of study. For example, analysis of trade and industries’ competitiveness is made in works of Alias, Radam, Fen, Yacob and Alam (2014), Chen and Xu (2014), Cheptea, Fontagné and Zignago (2014), Dogru and Sirakaya-Turk (2017), and many others. Employment change and workforce structure are analyzed by Artige and Neuss (2014), Cirillo and Guarascio (2015), Esteban (2000), Herath, Schaeffer and Gebremedhin (2013), Sobczak (2012). Labour productivity is examined by Polyzos, Tsiotas and Sdrolias (2013). Goschin (2014) analyses a regional growth by the means of shift-share analysis. Firm demography, which is the main focus of this paper, is analyzed in works of Armington and Acs (2002), Cheng (2011) and Fotopoulos and Spence (2001).
10 Note that although in this analysis the designation of European Union is used for the set of countries, that set of countries do
15
The essential idea of the shift-share analysis is to find out the extent to which the difference in growth between each region and the national average is due to the region performing uniformly better than average on all industries or to the fact that the region happens to be specialized in fast growing sectors (Esteban, 2000).
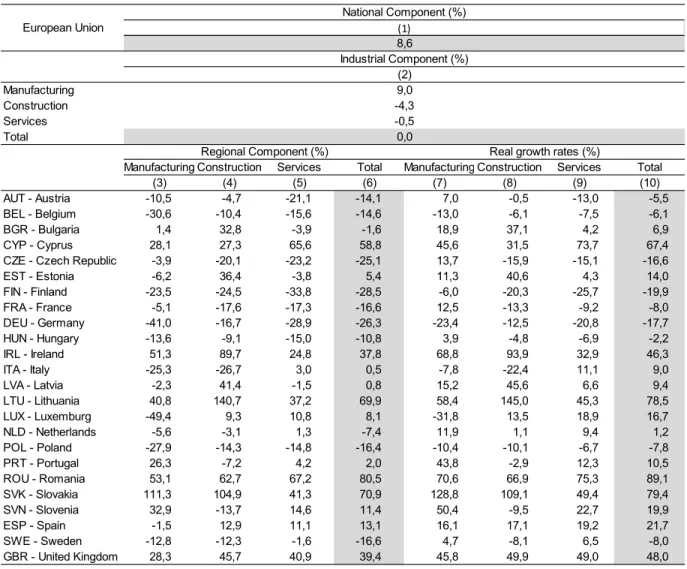
According to Cheng (2011) and Stimson et al., 2006 traditional shift-share analysis decomposes economic changes in a region into three additive components: national share (business cycle), industrial mix (industrial composition), and regional shift (regional advantage). The three components sum to the total shift, which is, specifically for this research, the actual growth (or decrease) in firms formation and closure.
TS = NS + IM + RS [1]
Using the mathematical formulations presented in the work of Cheng (2011), he formulas for each component will be represented and explained below.
The national share component (NS) measures the regional change in an analysed variable, in this
case the absolute and relative change in the number of firm’s births and deaths, that could have occurred if regional change was at the same rate as the national economy.
NS = ∑ ∗ [2]
gn = (Ent* - Ent)/Ent [3]
where Eirtis the number of (born and dead) firms in sector i of region r at the beginning of a time interval t (in this case, the year 2010), gn is the overallnational rate of firm growth in the time interval from t to t* (t* being the end of the time interval, that, in this work, is the year 2014), and Ent* and Ent are respectively the number of establishments in the nation at time t* (2014) and t (2010). In this particular
research data about firm births and deaths in the European Union as a whole (or, in this case, 24 countries with available information) is used for calculations of national share in the analysis.
The industry mix component (IM) measures proportional shift due to a difference in industry growth
between the region considered (each one of the European Union countries selected) and the national economy (the European Union as a whole), and is represented by the following formulas:
IM = ∑ [4]
gin = (Eint* - Eint)/Eint [5]
where ginis the national rate of firms growth (in terms of their births and deaths) in industry i during the same time interval from t to t* (from 2010 to 2014), and Eint* and Eint are respectively the number of establishments in sector i in the nation at time t* and t. In this research, industry mix component
16
The regional shift component (RS) measures the differential shift due to differences in rates of growth
of the same industry between the region and the national economy as a result of various factors (national resources, other comparative advantages or disadvantages, leadership and entrepreneurial ability, the effects of regional policy, among others). The formulas for this component are presented below:
RS = ∑ [6]
gir = (Eirt* - Eirt)/Eirt [7]
where gir is the rate of firm growth in the same time interval from t to t* in industry i in region r, and Eirt* and Eirt are respectively the number of firms in sector i in region r at time t* and t. Countries of the European Union are considered as regions in this research. There are in total 24 countries such as Austria, Belgium, Bulgaria, Cyprus, Czech Republic, Estonia, Finland, France, Germany, Hungary, Ireland, Italy, Latvia, Lithuania, Luxembourg, Netherlands, Poland, Portugal, Romania, Slovakia, Slovenia, Spain, Sweden, and United Kingdom.
The main benefit of using the shift-share analysis is its simplicity since there is no need for primary data collection which is costly and time-consuming (Shi & Yang, 2008). By the means of shift-share analysis it is possible to easily identify within the region the problematic industries that can require future attention (Maťátková & Stejskal, 2012). Moreover, it allows to assess a country’s international competitive position and its fluctuations over time (Alias et al., 2014).
17
3. Presentation and analysis of the shift-share empirical results
3.1. Descriptive characterisation of the data
As explained in the previous section, in this work the shift-share decomposition of two business demography variables in three components – national industrial and regional - between two moments in time (2010 and 2014) for 24 European Union countries is calculated and analysed. These variables are the absolute number of firms that were created and closed in these two moments in time, and the intention is to verify which component(s) had/have a major impact on the real variations observed. The two next tables present those absolute values for each one of the countries and for the European Union (consisting of the 24 countries for which the information is available as explained before), in 2010 and 2014. The tables also present the percentage variation of the number of firms between the two years. The values are presented for the total of the economic activity and by the three main sectors of activity considered: manufacturing, construction and services.
In particular, Table 2 presents the absolute number of firms’ births in 2010 and 2014 and the percentage variation11 of those numbers between 2010 and 2014. Table 3 presents the absolute
number of firms’ deaths in 2010 and 2014 and the percentage change of the values between 2010 and 2014.
18
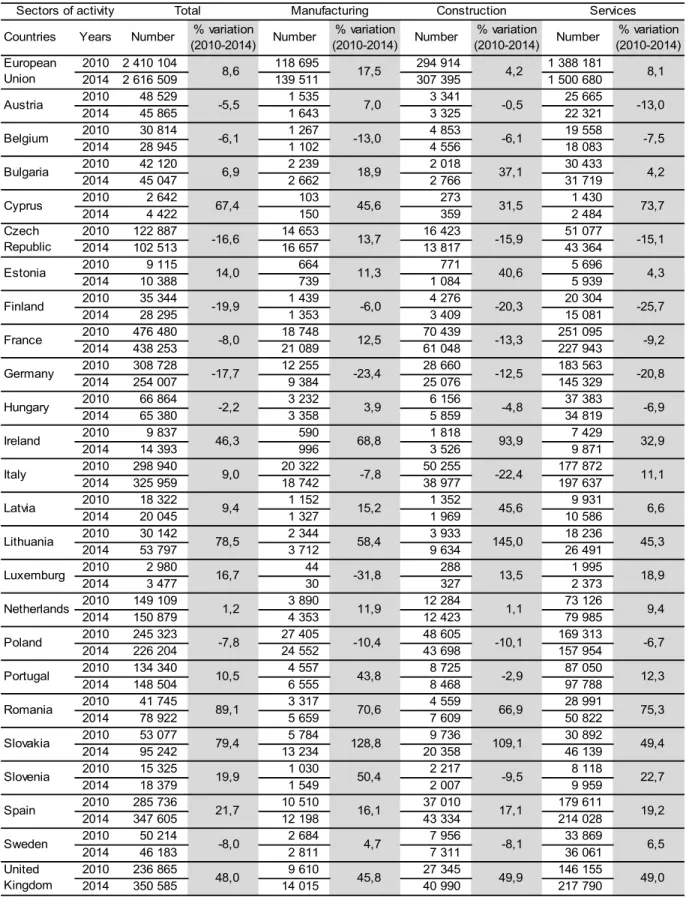
Table 2. Number and percentage variation of the number of firms’ births by sector of activity and by European Union country, between 2010 and 2014
Source: Own elaboration
Countries Years Number (2010-2014)% variation Number (2010-2014)% variation Number (2010-2014)% variation Number (2010-2014)% variation
2010 2 410 104 118 695 294 914 1 388 181
2014 2 616 509 139 511 307 395 1 500 680
2010 48 529 1 535 3 341 25 665
2014 45 865 1 643 3 325 22 321
2010 30 814 1 267 4 853 19 558
2014 28 945 1 102 4 556 18 083
2010 42 120 2 239 2 018 30 433
2014 45 047 2 662 2 766 31 719
2010 2 642 103 273 1 430
2014 4 422 150 359 2 484
2010 122 887 14 653 16 423 51 077
2014 102 513 16 657 13 817 43 364
2010 9 115 664 771 5 696
2014 10 388 739 1 084 5 939
2010 35 344 1 439 4 276 20 304
2014 28 295 1 353 3 409 15 081
2010 476 480 18 748 70 439 251 095
2014 438 253 21 089 61 048 227 943
2010 308 728 12 255 28 660 183 563
2014 254 007 9 384 25 076 145 329
2010 66 864 3 232 6 156 37 383
2014 65 380 3 358 5 859 34 819
2010 9 837 590 1 818 7 429
2014 14 393 996 3 526 9 871
2010 298 940 20 322 50 255 177 872
2014 325 959 18 742 38 977 197 637
2010 18 322 1 152 1 352 9 931
2014 20 045 1 327 1 969 10 586
2010 30 142 2 344 3 933 18 236
2014 53 797 3 712 9 634 26 491
2010 2 980 44 288 1 995
2014 3 477 30 327 2 373
2010 149 109 3 890 12 284 73 126
2014 150 879 4 353 12 423 79 985
2010 245 323 27 405 48 605 169 313
2014 226 204 24 552 43 698 157 954
2010 134 340 4 557 8 725 87 050
2014 148 504 6 555 8 468 97 788
2010 41 745 3 317 4 559 28 991
2014 78 922 5 659 7 609 50 822
2010 53 077 5 784 9 736 30 892
2014 95 242 13 234 20 358 46 139
2010 15 325 1 030 2 217 8 118
2014 18 379 1 549 2 007 9 959
2010 285 736 10 510 37 010 179 611
2014 347 605 12 198 43 334 214 028
2010 50 214 2 684 7 956 33 869
2014 46 183 2 811 7 311 36 061
2010 236 865 9 610 27 345 146 155
2014 350 585 14 015 40 990 217 790
8,1
Sectors of activity Total Manufacturing Construction Services
European
Union 8,6 17,5 4,2
Belgium -6,1 -13,0 -6,1 -7,5
Austria -5,5 7,0 -0,5 -13,0
Cyprus 67,4 45,6 31,5 73,7
Bulgaria 6,9 18,9 37,1 4,2
4,3
Estonia 14,0 11,3 40,6
Czech
Republic -16,6 13,7 -15,9 -15,1
France -8,0 12,5 -13,3 -9,2
Finland -19,9 -6,0 -20,3 -25,7
Hungary -2,2 3,9 -4,8 -6,9
Germany -17,7 -23,4 -12,5 -20,8
11,1
Italy 9,0 -7,8 -22,4
Ireland 46,3 68,8 93,9 32,9
Lithuania 78,5 58,4 145,0 45,3
Latvia 9,4 15,2 45,6 6,6
Netherlands 1,2 11,9 1,1 9,4
Luxemburg 16,7 -31,8 13,5 18,9
12,3
Portugal 10,5 43,8 -2,9
Poland -7,8 -10,4 -10,1 -6,7
Slovakia 79,4 128,8 109,1 49,4
Romania 89,1 70,6 66,9 75,3
Spain 21,7 16,1 17,1 19,2
Slovenia 19,9 50,4 -9,5 22,7
49,0 United
Kingdom 48,0 45,8 49,9
19
The observation of Table 2 allows to verify that, for the majority of the countries in study, the number of firms’ births increased from 2010 to 2014. Indeed, in 2014, in the majority of the countries, the number of new firms created was bigger than the number of new firms created in 2010. This result can be stressed by the percentage change of the number of firms created in the period for all the 24 European Union countries considered – the total number of firms created, considering the European Union economic block, increased by 8,6% if sectors of activity are not taken into account. Manufacturing is the sector of activity where the major increase was observed, followed by the services sector and, only after, by the construction sector of activity. The number of firms created in manufacturing increased between 2010 and 2014 by 17,5%. In services the number of firms created increased by 8,1% while in the construction sector this number increased by 4,2%.
It is important to note that, if sectors of activity are not taken into account, countries like Cyprus, Lithuania, Slovakia, and Romania have the highest rate of firm births with remarkable increase of 67,4%, 78,5%, 79,4%, and 89,1% respectively. These countries were among the last to access the European Union; Cyprus, Lithuania and Slovakia in 2004, while Romania in 2007. Since it is known that after accession to European Union the countries are eligible to receive specific European Union funds, namely the ones direct to help national economies development, promote business development and enhance entrepreneurship, one of the main causes for such good performance relating business creation could be the rise in incoming funds from European Union that boosted business creation in this particular countries. However, this might not be the only reason 12. Ireland and
the United Kingdom, as well, had considerably high firm birth rates (almost 50% of growth in the number of new firms created). For Bulgaria, Estonia, Italy, Latvia, Luxemburg, Netherlands, Portugal, Slovenia and Spain the rise in firm birth rates was similar to that of the European Union (as a whole) with fluctuations within 10% from the figure representing the European Union. At the same time, Austria, Belgium, France, Hungary, Poland, and Sweden are the countries with a relatively small decrease of the firm’s birth rates - it is observed a decrease of around 8% in the number of new firms created in 2014 compared to 2010. For Czech Republic, Finland and Germany the decline was more substantial - within a range from -16% to -20%. These countries should be referred as the ones with problems in business creation which should be thoroughly examined and dealt with for future improvement.
When sectors of activity are taken into consideration, several important issues arise and should be remarked.
Considering manufacturing, for almost all countries there was an increase in the number of firm births. Surprisingly, Slovakia had a dramatic growth of the firm birth rate equal to roughly 130%. High rates of
12 The economic, political and social explanation of the changes observed is not the main objective of the present research so
20
firm births in manufacturing are also a characteristic of Cyprus, Ireland, Lithuania, Portugal, Romania, Slovenia, and the United Kingdom; the values are within the range from 45% to 71%. Simultaneously, countries like Belgium, Finland, Germany, Italy, Luxemburg, and Poland had a decrease in the number of newly born firms. Moreover, for Germany and Luxemburg the decline was more significant, -23,4% and -31,8% respectively. Other countries more or less followed the trend of the European Union, for which the firm birth rate in manufacturing was equal 17,5%.
In construction, for half of the countries there was an increase in the number of newly created firms, while for the other half the decline was observed. Ireland, Slovakia, and Lithuania had the highest growth rates of firm births: the countries present growth rates equal to 93,9%, 109,1%, and 145% respectively. A substantial rise within the range from 45% to 67% could be also observed in Latvia, Romania, and the United Kingdom. In Bulgaria, Cyprus and Estonia there was a significant increase as well, 37,1%, 31,5% and 40,6% respectively. Countries like Czech Republic, Finland and Italy had the highest decline rates within the range from -15% to -23%. Austria, Belgium, France, Germany, Hungary, Poland, Portugal, Slovenia, and Sweden have a negative firm birth rate and could be considered as problematic in terms of business creation in the construction sector of activity, during the period in analysis.
The services sector of activity, from the business creation point of view, was developing during the analyzed period of time – for almost all countries as well as the European Union as a whole there was an increase in the number of newly born firms in 2014 compared with the year of 2010. Cyprus and Romania had the highest growth rates among others - 73,7% and 75,3%, respectively A significant increase within the range from 32% to 50% could be also observed for Ireland, Lithuania, Slovakia, and the United Kingdom. Luxemburg, Spain and Slovenia had a considerable rise in firm births (in 2014 comparing with 2010) as well - 18,9%, 19,2%, and 22,7% correspondingly. At the same time, Austria, Belgium, Czech Republic, Finland, France, Germany, Hungary, and Poland had a decline in the number of born firms in the sector of services. Furthermore, for Finland and Germany the decrease was more significant than for others. In the services sector, the figures observed for the rest of the countries such as Bulgaria, Estonia, Italy, Latvia, the Netherlands, Portugal, and Sweden are approximately the same as for the European Union as a whole, for which it is equal to an increase of 8,2%, with just slight differences.
21
Table 3. Number and percentage variation of the number of firms’ deaths by sector of activity and by European Union country, between 2010 and 2014
Source: Own elaboration
Countries Years Number (2010-2014)% variation Number (2010-2014)% variation Number (2010-2014)% variation Number (2010-2014)% variation 2010 2 201 709 158 946 360 497 1 471 679
2014 2 280 166 140 990 305 370 1 381 146
2010 35 738 1 546 2 753 22 377
2014 39 341 1 293 2 883 21 898
2010 19 672 1 020 2 902 12 946
2013 22 995 995 3 147 14 424
2010 28 865 2 274 2 068 20 565
2014 53 258 3 196 2 810 37 645
2010 4 300 310 846 2 365
2013 4 931 379 932 2 658
2010 95 763 11 322 14 301 55 658
2014 119 235 15 014 19 829 65 173
2010 8 352 624 1 165 4 793
2014 8 125 567 1 008 4 840
2010 29 887 1 848 3 767 16 952
2014 18 010 1 167 2 006 10 521
2010 239 791 13 090 40 625 135 839 2014 241 393 11 661 35 316 129 697 2010 302 159 14 208 26 937 186 453 2014 264 477 12 335 27 355 156 203
2010 72 443 4 222 8 509 40 040
2014 63 984 3 713 5 923 36 955
2010 14 739 854 4 508 9 377
2014 4 823 296 747 3 780
2010 289 672 23 558 51 368 170 143 2014 372 288 26 678 62 139 222 768
2010 12 871 654 1 081 6 589
2014 6 968 516 482 4 448
2010 23 399 1 989 3 343 14 483
2014 139 315 10 598 21 096 70 651
2010 2 262 47 204 1 618
2014 2 617 43 266 1 806
2010 88 943 3 061 10 977 48 934
2014 93 356 3 032 9 082 51 432
2010 189 521 21 159 38 531 129 831 2013 237 137 26 664 49 497 160 976
2010 173 440 7 621 15 915 108 618
2014 159 950 6 469 10 875 101 108
2010 100 259 7 570 10 038 65 482
2014 69 143 5 838 7 932 46 092
2010 28 907 3 505 4 567 17 422
2014 44 126 6 246 9 778 22 505
2010 12 060 1 143 2 676 6 015
2014 11 131 923 1 722 5 996
2010 318 300 16 573 60 979 190 956 2014 277 327 13 180 40 890 175 732
2010 40 112 2 950 5 206 27 856
2014 39 384 2 807 6 049 30 528
2010 248 595 13 265 39 095 146 895 2014 249 920 12 340 31 715 153 150 Sectors of activity Total Manufacturing Construction Services
4,7 -2,1
Belgium 16,9
-6,2
Austria 10,1 -16,4
European
Union 3,6 -11,3 -15,3
84,5 40,5 35,9 83,1
Cyprus
-2,5 8,4 11,4
Bulgaria
24,5 32,6 38,7 17,1
14,7 22,3 10,2 12,4
Czech Republic
-46,7 -37,9
France 0,7
1,0
Finland -39,7 -36,9
Estonia -2,7 -9,1 -13,5
-12,5 -13,2 1,6 -16,2
Hungary
-10,9 -13,1 -4,5
Germany
-67,3 -65,3 -83,4 -59,7
-11,7 -12,1 -30,4 -7,7
Ireland
-55,4 -32,5
Lithuania 495,4
30,9
Latvia -45,9 -21,1
Italy 28,5 13,2 21,0
15,7 -8,5 30,4 11,6
Netherlands
432,8 531,0 387,8
Luxemburg
25,1 26,0 28,5 24,0
5,0 -0,9 -17,3 5,1
Poland
78,2 114,1 29,2
Slovenia
-21,0 -29,6
Slovakia 52,6
-6,9
Romania -31,0 -22,9
Portugal -7,8 -15,1 -31,7
-12,9 -20,5 -32,9 -8,0
Sweden
-7,7 -19,2 -35,7 -0,3
Spain
4,3 United
Kingdom 0,5 -7,0 -18,9