UNIVERSIDADE DA BEIRA INTERIOR
Ciências Sociais e Humanas
Gender-variability of minimum foot clearance
during walking in adults and elderly
Tiago Emanuel Loureiro Sousa
Versão Definitiva
Dissertação para obtenção do Grau de Mestre em
Ciências do Desporto
(2º ciclo de estudos)
Acknowledgements
Thanks to Professor José Aurélio Marques Faria for the acuteness of the supervision, the innumerable feedbacks, the constant availability in the exchange of impressions, the discussion of ideas and the various suggestions to solve the problems that have been raised. Thanks to Technician João Nuno da Cruz and Professor Paulo Fiadeiro who helped me whenever I needed, for their friendship, good disposition, companionship and interest in the application of the study.
Thanks to all the subjects who participate in this research. This work would not be possible without their collaboration.
Thanks to Antunes, Rosa, Guimarães and Podão, because without them I would not have known the hidden places of Covilhã.
Thanks to the Foundation Casa de Trabalho Dr. Oliveira Salazar, as I would hardly have passed through the corridors of this university if I had not had the opportunity to previously work in this institution.
Finally, a special thanks to my family, dear parents, my blood, I hope this will make you proud. Sister, what to say: the greatest of supports, eternal affection.
Abstract
Falls are a public health problem faced by many countries representing a heavy burden for societies, particularly for those in which the population is aging. In fact, a high risk of falls is associated with older age groups. The increased frequency of falls in the elderly is responsible for many deaths and unintentional accidents impacting negatively their quality of life. It has been suggested that women are at a higher risk of falling than men, although little is known whether the factors that affect the risk of falls vary between men and women. The minimum foot clearance and its variability is an important parameter of gait which can be related to the mechanism of falls.
The present study aims to investigate older adults’ gender-related differences in minimum foot clearance, particularly its variability/complexity during walking. This study included 43 physically active subjects, of whom 23 were women and 20 were men. Participants walked on a treadmill for 14 minutes at a preferred walking speed.Minimum foot clearance data were obtained through a 3D motion capture system using 8 infrared cameras at a sampling frequency of 100 Hz. Sixteen retroreflective markers of 10 mm were placed on the anatomical landmarks of the right and left sides according to the recommendations of the Plug-in-Gait Lower Body model. Three additionally half markers of 10 mm were placed into each shoe for proper determination of minimum foot clearance, during gait.
The results showed that women had a lower mean in the minimum foot clearance (11.63 mm) compared to men (14.84 mm). Regarding the complexity of the minimum foot clearance, no gender differences were found. In conclusion, although men and women had similar complexity of minimum foot clearance, the women exhibited a minimum foot clearance mean lower than men, which may increase their risk of falling.
Keywords
Resumo
As quedas são um problema de saúde pública enfrentado por muitos países representando um fardo pesado para as sociedades, particularmente para aquelas em que a população está a envelhecer. De fato, altos riscos de queda estão associados a grupos etários mais velhos. O aumento da frequência de quedas nos idosos é responsável por muitas mortes e acidentes não intencionais com impacto negativo na sua qualidade de vida. Tem sido sugerido que as mulheres correm maior risco de cair do que os homens, embora pouco se saiba se os fatores que afetam o risco de quedas variam entre homens e mulheres. A distância vertical mínima do pé bem como a sua variabilidade é um parâmetro importante na marcha que se relaciona com o mecanismo de queda.
O presente trabalho teve como objetivo investigar diferenças de género em adultos e idosos na distância vertical mínima do pé, particularmente a sua variabilidade/complexidade durante o caminhar. Fizeram parte deste estudo 43 sujeitos fisicamente ativos, dos quais 23 eram mulheres e 20 homens. Os participantes caminharam numa passadeira rolante durante 14 minutos, à sua velocidade natural de caminhar. Os dados da distância vertical mínima do pé foram obtidos através de um sistema de captura de movimento 3D usando 8 câmaras de infravermelho com uma frequência de amostragem de 100 Hz. Dezasseis marcas retrorrefletoras de 10 mm foram colocadas nos pontos anatómicos do lado direito e esquerdo do participante de acordo com as recomendações do modelo Plug-In-Gait Lower Body. Três marcadores adicionais de 10 mm foram colocados em cada sapato para a determinação adequada da distância vertical mínima do pé, durante a marcha. Os resultados permitiram verificar que as mulheres possuem uma menor média na distância vertical mínima do pé (11.63 mm) em comparação com os homens (14.84 mm). Em relação à complexidade da distância vertical mínima não foram encontradas diferenças de género.
Em conclusão, embora homens e mulheres tenham uma complexidade da distância vertical mínima do pé semelhante, as mulheres apresentam uma menor média na distância vertical mínima do pé, o que pode aumentar o seu risco de queda.
Palavras-chave
Table of contents
Acknowledgements ... iii
Abstract ... v
Resumo ... vii
Index of Figures ... xi
Index of Tables ... xiii
List of Abbreviations ... xv
Chapter 1. Introduction ... 1
Chapter 2. Methods... 5
Participants ... 5 Experimental Procedures ... 5 Statistical procedures ... 7Chapter 3. Results ... 9
Chapter 4. Discussion ... 11
Chapter 5. Conclusion ... 13
Chapter 6. Future Research ... 15
Index of figures
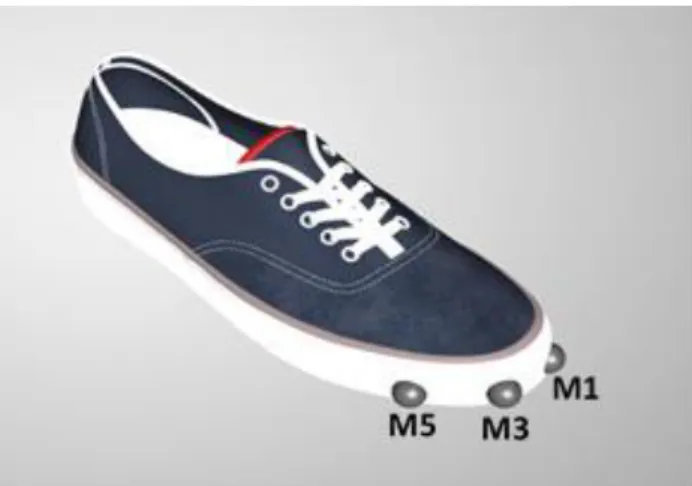
Figure 1. Position of the three retroreflective markers used to determine MFC. The markers
were aligned with the metatarsals 1, 3 and 5 (i.e. M1, M3 and M5).
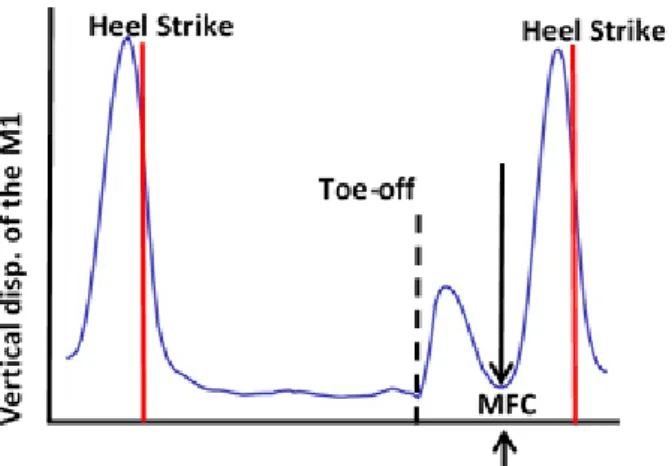
Figure 2. Plot showing the vertical displacement of the M1 marker during walking, and the
minimum foot clearance (MFC) between heel strikes that takes place during the mid-swing phase.
Index of Tables
Table 1 - Participant demographics and spatiotemporal gait variables (mean ± SD).
List of Abbreviations
DFA Detrended Fluctuation Analysis
MFC Minimum Foot Clearance
Chapter 1. Introduction
The world's population is aging and according to the United Nations, by 2050, the elderly population will increase to 2 billion people (World Health, 2008). Biological degeneration associated with aging has been linked to the risk of falls. The frequency of falls can increase threefold in older adults because of the loss of muscle mass and strength (Landi et al., 2012). Falls can cause moderate to severe injuries, compromise mobility, lead to loss of independence, hospitalizations and sometimes even death (Chiba, Ebihara, Tomita, Sasaki, & Butler, 2005; Prince, Corriveau, Hébert, & Winter, 1997). Falls occur frequently in the older population during walking, with about 53% of falls in older adults occurring when stumbling due to involuntary contact of the foot with the ground or with an obstacle (Blake et al., 1988). Due to the serious consequences and the high health expenses associated with falls the recognition of potential fallers is essential (Stevens, Corso, Finkelstein, & Miller, 2006). It has been suggested that women show higher risk of fall than men (Gale, Cooper, & Aihie Sayer, 2016; Grisso, Schwarz, Miles, & Holmes, 1996). Non-fatal falls related injuries are also more common among older women (Stevens & Sogolow, 2005). Ninety percent of hip fractures are caused by falls, making this type of injury an important predictor of falls (Ambrose, Paul, & Hausdorff, 2013), and women show a substantially greater number of hip fractures than men (Stevens & Sogolow, 2005). Gender differences can also be related with the activities performed, for instance older adults have significantly higher rates of falls when outdoors doing specific physical activities, while women (Duckham et al., 2013) are at increased risk of fall and get injured when performing indoor activities.
Minimum Foot Clearance (MFC) is thought to be a parameter related with the risk of tripping and falls (Begg, Best, Dell'Oro, & Taylor, 2007; Winter, 1992) that occurs when the horizontal velocity of the foot is close to its maximum (Winter, Patla, Frank, & Walt, 1990), which supposedly may enhance the risk of trip and fall (Khandoker, Lynch, Karmakar, Begg, & Palaniswami, 2010). MFC is defined as the minimum vertical distance between the anterior part of the foot/shoe and the ground during the mid-swing phase (Karmakar, Khandoker, Begg, & Palaniswami, 2013). Interestingly, sex-related differences were found during this phase of gait. For instance, older men showed increased rectus femoris muscle activation during the mid-swing phase, while women show greater gastrocnemius lateralis activation (Bailey et al., 2018). Lower knee joint flexion angle was reported in women when compared to men from the late stance to mid-swing before and after knee arthroplasty surgery (Wilson, Dunbar, & Hubley-Kozey, 2015). The duration of dorsiflexion during the initial swing also increased less abruptly with age for men than for women (Ko, Tolea, Hausdorff, & Ferrucci,
2
Beaupre, & Andriacchi, 2008; Hurd, Chmielewski, Axe, Davis, & Snyder-Mackler, 2004). All these gender-related differences suggest that MFC can be affected differently across sexes, which demands further clarification. Moreover, reduced MFC is believed to indicate an increased risk of tripping (Rosenblatt, Bauer, & Grabiner, 2017). Notably, after an intervention in stroke patients the increase in MFC was accompanied by a reduction in falls (Gervasoni et al., 2017).
Recently, it has been shown that MFC can either increase or decrease depending on the environmental constraints. A cognitive task during walking reduced MFC while visual restriction led to increased MFC (Killeen et al., 2017). It has been suggested that MFC, as a single time point measure within the gait cycle, may provide limited insights to risk of falls, for example, Byju, Nussbaum, and Madigan (2016) suggested that using more information from the toe’s trajectory can better predict the probability of tripping. The major limitation of the measures employed in these studies is that the relationship between consecutive steps is largely ignored, and the temporal structure of the time series is disregarded. However, healthy normal walking exhibits persistent long-range correlations where each step over a large time series is correlated with the previous and with next step (J. M. Hausdorff, Peng, Ladin, Wei, & Goldberger, 1995).
Human movement variability is thought to be an intrinsic and fundamental characteristic of human walking, denoting the variations in a movement pattern when the same task is repeated multiple times (Stergiou, Kent, & McGrath, 2016). It has been suggested that and optimal level of variability is associated with healthy states while too much or too little variability represents an unhealthy and less adaptable system (Stergiou, Harbourne, & Cavanaugh, 2006). Random (too much variability) and periodic (too little or no variability) systems are characterized by a loss of complexity, indicating that a system is either too unstable or rigid and, hence less adaptable (Stergiou et al., 2006). Healthy gait has shown to be complex (Hunt, McGrath, & Stergiou, 2014; Kaipust, McGrath, Mukherjee, & Stergiou, 2013), while the gait of older adults (Kaipust et al., 2013) and neurological patients (J. M. Hausdorff, 2009) showed a loss of complexity.
Mills, Barrett, and Morrison (2008), studied MFC variability during treadmill walking in young and elderly men and reported that the elderly shows greater MFC variability, even though the
p-value was 0.049. Similarly, greater MFC variability was reported, but only for the right leg
of older men when compared to young men (Sparrow, Begg, & Parker, 2008).
When MFC variability was investigated between young and elderly females, higher variability was also found for elderly (Begg et al., 2007). In addition to the small number of individuals (ranging from 10 to 16 per group) who participated in these studies, variability was assessed trough linear measures of central tendency, which have been reported to show shortcomings (Buzzi, Stergiou, Kurz, Hageman, & Heidel, 2003). Particularly because, the dynamics that
underlie the control of locomotion are non-linear and complex (Harbourne & Stergiou, 2009; J. M. Hausdorff et al., 1995). However, linear statistics lack the ability to provide information about complexity and consequently valuable information can be lost.
In the non-linear context, a decrease in MFC complexity was also found in older adults with history of falls when compared to healthy elderly and young subjects (Karmakar et al., 2013). However, to the best of the authors’ knowledge, no studies have evaluated MFC variability regarding gender-related differences and its implications concerning the risk of falls.
Therefore, the present study aims to investigate older adults’ sex-related differences in minimum foot clearance. Based on previous findings, it was hypothesized that: 1) minimum foot clearance will be smaller in women and; 2) women will exhibit decreased complexity of minimum foot clearance compared to men.
Chapter 2. Methods
Participants
The demographics of 43 subjects (23 women, 20 men) who participated in the study are shown in Table 1, as well as, spatiotemporal gait variables. The body mass and height of each participant were measured by a conventional scale and stadiometer, respectively. The subjects were physically active and performed exercise sessions of 45 minutes at least 2 times per week. Each subject was controlled through questionnaire for the following conditions: history of falls during the last 12 months, stroke, recent surgery, myopathy, neuropathy, scoliosis, arterial disease, rheumatoid arthritis, diabetes, lower limb injury in the last 6 months, joint replacement, pulmonary and/or cardiac diseases, asthma, acute pain, foot deformities and locomotor disorders.
Written informed consent was obtained from all participants and the study was approved by the Ethics Committee of University of Beira Interior.
Table 1. Participant demographics and spatiotemporal gait variables (mean ± SD).
Variables Age (years) Mass (kg) Height (m) Gait Velocity (km/h) Cadence (steps/min) Women (n = 23) 65.8 ± 4.6 66.0 ± 9.3 1.54 ± 0.04 3.7 ± 0.4 113.0 ± 9.3 Men (n = 20) 61.9 ± 5.3 77.1 ± 9.0 1.69 ± 0.07 3.8 ± 0.5 105.5 ± 10.2 Total (n = 43) 64.0 ± 5.4 71.2 ± 10.6 1.60 ± 0.10 3.8 ± 0.1 109.5 ± 1.6
Experimental Procedures
The procedures took place into two stages, in the first the Preferred Walking Speed (PWS) was estimated in the treadmill (h/p/cosmos Mercury 4.0, Munich, Germany) and in the second stage the subjects went to the lab, after a week of PWS assessment, for MFC measurements. After a familiarization period (i.e. 10-min) in the treadmill the PWS was estimated as follows: 1) From 1.5 km/h the initial speed was increased in intervals of 0.1 km/h at every six strides until the participant informed that the speed was uncomfortable, the value immediately prior to this speed was considered the maximum speed;
2) The reverse procedure was then performed by reducing the speed in steps of 0.1 km/h until the participant reported that the speed was very low, the value immediately prior to this speed was considered the minimum speed (Karmakar et al., 2013).
The subjects were not aware of the treadmill speeds being applied. This procedure was performed 6 times, and the mean of the 6 maximum and 6 minimum speeds was considered
6
walked for 14 minutes, at the PWS previously estimated, to ensure the minimum number of recommended walking cycles (i.e. 600) in time series analysis (Damouras, Chang, Sejdic, & Chau, 2010).
The MFC data were obtained through the 3D motion analysis system using 8 infrared cameras Mx T20-S (Vicon Motus, Oxford, UK) at a sampling frequency of 100 Hz. Sixteen retroreflective marks of 10 mm were placed on the anatomical landmarks of the right and left sides according to the recommendations of the Plug-in-Gait Lower Body model (Vicon Motus, Oxford, UK). Three additionally half markers of 10 mm were placed into each shoe (Figure 1) for proper determination of MFC. Equal shoes of different sizes were purchased for the study, to ensure accurate determination of the MFC and that the tests were not affected by the type of shoe used (Annette M. Davis, Brook Galna, Anna T. Murphy, Cylie M. Williams, & Terry P. Haines, 2016). The markers were glued on the front rubber of the footwear and aligned with the first, third and fifth metatarsal (i.e. M1, M3, and M5), as shown in Figure 1.
Figure 1 – Position of the three retroreflective markers used to determine MFC. The markers were aligned with the metatarsals 1, 3 and 5 (i.e. M1, M3 and M5).
Before assess walking data, a static trial was collected, in which it was ensured that the entire sole of the shoe was in contact with the ground. Based on the static trial the vertical distance of each marker (i.e. M1, M3 and M5) to the ground was then measured with the software Nexus 2.6 (Vicon Motus, Oxford, UK) for each subject. This vertical distance was then subtracted from the MFC height calculated from the dynamic trials, as shown in Figure 2, to obtain the correct MFC distance (i.e. the vertical distance between the sole of the shoe and the ground). The MFC was determined from unfiltered data for each of the three markers placed on the shoe (i.e. M1, M3 and M5) and the marker that showed the smallest MFC value was used in subsequent analysis (Khandoker et al., 2010).
Figure 2 – Plot showing the vertical displacement of the M1 marker during walking, and the minimum foot clearance (MFC) between heel strikes that takes place during the mid-swing phase.
Statistical procedures
Scaling properties are important to determine the complexity of a time-series, which can be accessed through Detrended Fluctuation Analysis (DFA). In this context the MATLAB software (MATLAB R 2018a, MathWorks, Inc., Natick, MA, United States) was used to perform DFA and estimate the self-similarity scaling parameter α. Several stages are used to determine the scaling exponent α.
Briefly, DFA is used to identify fractal-like (i.e. self-similar), processes by integrating data over time where each time series integrated will be self‐similar if the fluctuations at different time windows [ F(n)] scale as a power-law with window size n. A linear relationship on a double-log graph will denote self-similarity with F(n) ≈ nα, while the slope of the gradient, relating the log F(n) to the log n, will determine the scaling parameter α (Jeffrey M. Hausdorff, 2007). If a value of MFC during a stride does not correlate with previous values we are in the presence of white noise, and the fractal index would be ≈ 0.5. An α ≈ 1.5 (i.e. brown noise) indicates deterministic structure within the MFC correlations, while α ≈ 1.0 (i.e. 1/f noise) shows stochastic properties within the MFC time series which have a fractal self-similar structure. The size of the windows used was 16 to N/9, while the N considered was 800 to comply with the minimum number of recommended walking cycles (i.e. 600) (Damouras et al., 2010).
After determining the scaling exponent α using DFA, statistical analysis of two dependent variables (MFC mean and MFC α) was performed employing the independent-samples t-test to evaluate if there were differences between men and women. Engagement scores for each level of gender were normally distributed, as assessed by Shapiro-Wilk's test (p > 0.05), and there was homogeneity of variances, as assessed by Levene's test for equality of variances (p = 0.138). A p < 0.05 was considered statistically significant and the data were analyzed using
Chapter 3. Results
The following dependent variables (MFC mean and MFC α) were compared between men and women, through independent-samples t-test. As summarised in Table 2 women showed significant smaller MFC mean (11.63 mm) than men (14.84 mm). No gender-related effect on MFC variability (i.e. MFC α) was however identified.
Table 2. MFC gait variables of the women and men participants
Variables Women Men p-value
MFC mean (mm) 11.63 ± 2.59 14.84 ± 1.76 <0.001 MFC α 0.84 ± 0.09 0.79 ± 0.09 0.088 MFC mean – the average minimum foot clearance during walking;
Chapter 4. Discussion
The primary aim of the present study was to examine older adults’ gender-related differences in MFC, particularly regarding its MFC mean and MFC α. As hypothesised, women presented smaller MFC mean than men, however the second hypothesis was refuted, since there were no significant differences in the complexity of MFC between sexes.
The overall MFC mean of all participants was 13.12 mm, which is consistent with Barrett, Mills, and Begg (2010) who reported values ranging between 10-20 mm. The dispersion in these values has been related with the type of methods and population used. For instance, Begg et al. (2007) used a geometric model with two markers (greater toe and metatarsal head) and a virtual point, to predict the lowest point on the shoe, while inertial sensors were used, in level walking, to calculate MFC (Hamacher, Hamacher, & Schega, 2014). Different types of footwear (A. M. Davis, B. Galna, A. T. Murphy, C. M. Williams, & T. P. Haines, 2016) and shoes with different rocker angles (Thies, Price, Kenney, & Baker, 2015) also impacts MFC values. Regarding the population Santhiranayagam, Lai, Sparrow, and Begg (2015) evaluated the MFC in young and old people, while others evaluated MFC in healthy elderly women (Karst, Hageman, Jones, & Bunner, 1999).
To the authors knowledge no studies compared MFC across gender, and from the studies available a median MFC of 13.8 mm was reported for elderly men (Mills et al., 2008), which is a little lower than the median (i.e. 14.80 mm)of the present study. Regarding to elderly females our results are similar to Khandoker et al. (2010) and Karmakar et al. (2013) that showed mean MFC values of 10.60 mm and 12.50 mm respectively. Therefore, the values of the present research seem to be in the scope of the current literature.
One possible reason for women to have a lower MFC than men can be associated to the fact that females during mid-swing of gait have higher gastrocnemius activation, a strategy that allows to maintain postural stability at the expense of energy efficiency (Bailey et al., 2018). Another reason can be related to the knee joint flexion angle, since women has been reported to show lower angles from late stance to mid-swing compared to men (Wilson et al., 2015). However, this last study should be interpreted carefully since the population showed some knee impairment and was submitted to arthroplasty surgery.
Human movement variability is intrinsic to the living being (Stergiou et al., 2016). Due human variability, the MFC will be different for each step during walking. Considering the small distance to the ground during the MFC, the margin for errors is very small, therefore the control of step-to-step variability must be tightened to avoid touching the ground and
12
be more prone to fall than individuals with lower MFC, if the former show greater variability of MFC than the latter. Furthermore, excess of variability in MFC can lead to incorrect ground foot contact, impacting the risk of fall (Khandoker, Palaniswami, & Begg, 2008).
Gender differences were reported in joint variability, when comparing young men and women, particularly women had less variability in several joint rotations than men (Barrett, Noordegraaf, & Morrison, 2008). However, these gender differences were not found in the present study regarding the MFC variability, because no gender-related effect on MFC scaling exponent α was observed.
The observed results of MFC α for women was (0.84) and for men was (0.79). These values exhibit persistent correlations in the stride interval time series. According to Goldberger et al. (2002) when the scaling exponent α is between 0.7 and 1.2, we are in the presence of a biological system that shows characteristics of adaptability. Therefore, the present results suggest that both men and women are in an interval which can be considered healthy in the sense that their movements are not too unstable or rigid but show adaptable capabilities. Additionally, the analysis of DFA in the MFC time series was performed with more than 600 data points, which allows a greater robustness of results when compared to other studies (Delignieres et al., 2006; Khandoker, Taylor, Karmakar, Begg, & Palaniswami, 2008). The absence of differences in DFA may be related to the study sample, since both men and women were physically active and performed exercise sessions regularly therefore the results might reflect their actual and healthier condition.
There are many strategies that can be used to minimize the risk of falls, for instance increase the mean MFC height, reduce the MFC variability (even though this may not be totally possible voluntarily and/or without training) and/or combine strategies (Begg et al., 2007). Regarding the outcomes of the present study the regulation of the MFC variability don’t seems to play an effective role in this population. On the other hand, the greater mean MFC height in men compared to women may simply be due restrictions/declines on women motor system and not a strategy pursued by men. Nevertheless, the reduced mean MFC height found in women can have a deleterious effect in the risk of fall when compared with men.
Some limitations should also be recognized: 1) data were recorded in the laboratory on a treadmill, although this method provides a direct measure of the MFC, walking changes are expected to occur when compared to normal walk in the ground; 2) another limitation is the interference of participants' fatigue in the results, which, cannot be ruled out, even though all participants walked at their preferred speed and were submitted to the same procedure.
Chapter 5. Conclusion
In conclusion, although men and women had similar complexity of minimum foot clearance, women exhibited an average MFC lower than men, which may increase their risk of falling. The understanding of MFC and its complexity are relevant to promote appropriate interventions to reduce the risk of falls and to improve the quality of life in the elderly population.
Chapter 6. Future Research
Future investigations should try to understand if these gender differences also occur with: 1) young ages and different speeds;
2) on different surfaces and when in the presence of obstacles.
Population with higher risk of falls should also be compared to fully understand the scope of the present results. Specific fitness training plans targeted at older women might be developed and tested to minimize the decrease in the MFC mean.
Chapter 7. References
Ambrose, A. F., Paul, G., & Hausdorff, J. M. (2013). Risk factors for falls among older adults: A review of the literature. Maturitas, 75(1), 51-61. doi: 10.1016/j.maturitas.2013.02.009
Bailey, C. A., Corona, F., Pilloni, G., Porta, M., Fastame, M. C., Hitchcott, P. K., . . . Cote, J. N. (2018). Sex-dependent and sex-independent muscle activation patterns in adult gait as a function of age. Exp Gerontol, 110, 1-8. doi: 10.1016/j.exger.2018.05.005 Barrett, R., Mills, P., & Begg, R. (2010). A systematic review of the effect of ageing and falls
history on minimum foot clearance characteristics during level walking. Gait Posture,
32(4), 429-435. doi: 10.1016/j.gaitpost.2010.07.010
Barrett, R., Noordegraaf, M. V., & Morrison, S. (2008). Gender differences in the variability of lower extremity kinematics during treadmill locomotion. J Mot Behav, 40(1), 62-70. doi: 10.3200/jmbr.40.1.62-70
Begg, R., Best, R., Dell'Oro, L., & Taylor, S. (2007). Minimum foot clearance during walking: strategies for the minimisation of trip-related falls. Gait Posture, 25(2), 191-198. doi: 10.1016/j.gaitpost.2006.03.008
Blake, A. J., Morgan, K., Bendall, M. J., Dallosso, H., Ebrahim, S. B., Arie, T. H., . . . Bassey, E. J. (1988). Falls by elderly people at home: prevalence and associated factors. Age
Ageing, 17(6), 365-372.
Boyer, K. A., Beaupre, G. S., & Andriacchi, T. P. (2008). Gender differences exist in the hip joint moments of healthy older walkers. J Biomech, 41(16), 3360-3365. doi: 10.1016/j.jbiomech.2008.09.030
Buzzi, U. H., Stergiou, N., Kurz, M. J., Hageman, P. A., & Heidel, J. (2003). Nonlinear dynamics indicates aging affects variability during gait. Clin Biomech (Bristol, Avon),
18(5), 435-443.
Byju, A. G., Nussbaum, M. A., & Madigan, M. L. (2016). Alternative measures of toe trajectory more accurately predict the probability of tripping than minimum toe clearance. J
Biomech, 49(16), 4016-4021. doi: 10.1016/j.jbiomech.2016.10.045
Chiba, H., Ebihara, S., Tomita, N., Sasaki, H., & Butler, J. P. (2005). Differential gait kinematics between fallers and non-fallers in community-dwelling elderly people.
Geriatrics & Gerontology International, 5(2), 127-134. doi:
10.1111/j.1447-0594.2005.00281.x
Damouras, S., Chang, M. D., Sejdic, E., & Chau, T. (2010). An empirical examination of detrended fluctuation analysis for gait data. Gait Posture, 31(3), 336-340. doi: 10.1016/j.gaitpost.2009.12.002
18
Davis, A. M., Galna, B., Murphy, A. T., Williams, C. M., & Haines, T. P. (2016). Effect of footwear on minimum foot clearance, heel slippage and spatiotemporal measures of gait in older women. Gait & Posture, 44, 43-47. doi: https://doi.org/10.1016/j.gaitpost.2015.11.003
Davis, A. M., Galna, B., Murphy, A. T., Williams, C. M., & Haines, T. P. (2016). Effect of footwear on minimum foot clearance, heel slippage and spatiotemporal measures of gait in older women. Gait Posture, 44, 43-47. doi: 10.1016/j.gaitpost.2015.11.003 Delignieres, D., Ramdani, S., Lemoine, L., Torre, K., Fortes, M., & Ninot, G. (2006). Fractal
analyses for ‘short’ time series: A re-assessment of classical methods. Journal of
Mathematical Psychology, 50(6), 525-544. doi: https://doi.org/10.1016/j.jmp.2006.07.004
Duckham, R. L., Procter-Gray, E., Hannan, M. T., Leveille, S. G., Lipsitz, L. A., & Li, W. (2013). Sex differences in circumstances and consequences of outdoor and indoor falls in older adults in the MOBILIZE Boston cohort study. BMC Geriatr, 13, 133. doi: 10.1186/1471-2318-13-133
Gale, C. R., Cooper, C., & Aihie Sayer, A. (2016). Prevalence and risk factors for falls in older men and women: The English Longitudinal Study of Ageing. Age Ageing, 45(6), 789-794. doi: 10.1093/ageing/afw129
Gervasoni, E., Parelli, R., Uszynski, M., Crippa, A., Marzegan, A., Montesano, A., & Cattaneo, D. (2017). Effects of Functional Electrical Stimulation on Reducing Falls and Improving Gait Parameters in Multiple Sclerosis and Stroke. Pm r, 9(4), 339-347.e331. doi: 10.1016/j.pmrj.2016.10.019
Goldberger, A. L., Amaral, L. A., Hausdorff, J. M., Ivanov, P., Peng, C. K., & Stanley, H. E. (2002). Fractal dynamics in physiology: alterations with disease and aging. Proc Natl
Acad Sci U S A, 99 Suppl 1, 2466-2472. doi: 10.1073/pnas.012579499
Grisso, J. A., Schwarz, D. F., Miles, C. G., & Holmes, J. H. (1996). Injuries among inner-city minority women: a population-based longitudinal study. American Journal of Public
Health, 86(1), 67-70.
Hamacher, D., Hamacher, D., & Schega, L. (2014). Towards the importance of minimum toe clearance in level ground walking in a healthy elderly population. Gait Posture, 40(4), 727-729. doi: 10.1016/j.gaitpost.2014.07.016
Harbourne, R. T., & Stergiou, N. (2009). Movement variability and the use of nonlinear tools: principles to guide physical therapist practice. Phys Ther, 89(3), 267-282. doi: 10.2522/ptj.20080130
Hausdorff, J. M. (2007). Gait dynamics, fractals and falls: finding meaning in the stride-to-stride fluctuations of human walking. Human Movement Science, 26(4), 555-589. doi: 10.1016/j.humov.2007.05.003
Hausdorff, J. M. (2009). Gait dynamics in Parkinson’s disease: Common and distinct behavior among stride length, gait variability, and fractal-like scaling. Chaos, 19(2), 026113. doi: 10.1063/1.3147408
Hausdorff, J. M., Peng, C. K., Ladin, Z., Wei, J. Y., & Goldberger, A. L. (1995). Is walking a random walk? Evidence for long-range correlations in stride interval of human gait. J
Appl Physiol (1985), 78(1), 349-358. doi: 10.1152/jappl.1995.78.1.349
Hunt, N., McGrath, D., & Stergiou, N. (2014). The influence of auditory-motor coupling on fractal dynamics in human gait. Sci Rep, 4, 5879. doi: 10.1038/srep05879
Hurd, W. J., Chmielewski, T. L., Axe, M. J., Davis, I., & Snyder-Mackler, L. (2004). Differences in normal and perturbed walking kinematics between male and female athletes. Clin Biomech (Bristol, Avon), 19(5), 465-472. doi: 10.1016/j.clinbiomech.2004.01.013
Kaipust, J. P., McGrath, D., Mukherjee, M., & Stergiou, N. (2013). Gait variability is altered in older adults when listening to auditory stimuli with differing temporal structures. Ann
Biomed Eng, 41(8), 1595-1603. doi: 10.1007/s10439-012-0654-9
Karmakar, C., Khandoker, A., Begg, R., & Palaniswami, M. (2013). Understanding ageing effects using complexity analysis of foot–ground clearance during walking. Computer
Methods in Biomechanics and Biomedical Engineering, 16(5), 554-564. doi:
10.1080/10255842.2011.628943
Karst, G. M., Hageman, P. A., Jones, T. F., & Bunner, S. H. (1999). Reliability of foot trajectory measures within and between testing sessions. J Gerontol A Biol Sci Med
Sci, 54(7), M343-347.
Khandoker, A. H., Lynch, K., Karmakar, C. K., Begg, R. K., & Palaniswami, M. (2010). Toe clearance and velocity profiles of young and elderly during walking on sloped surfaces. J Neuroeng Rehabil, 7, 18. doi: 10.1186/1743-0003-7-18
Khandoker, A. H., Palaniswami, M., & Begg, R. K. (2008). A comparative study on approximate entropy measure and poincare plot indexes of minimum foot clearance variability in the elderly during walking. J Neuroeng Rehabil, 5, 4. doi: 10.1186/1743-0003-5-4
Khandoker, A. H., Taylor, S. B., Karmakar, C. K., Begg, R. K., & Palaniswami, M. (2008). Investigating scale invariant dynamics in minimum toe clearance variability of the young and elderly during treadmill walking. IEEE Trans Neural Syst Rehabil Eng, 16(4), 380-389. doi: 10.1109/tnsre.2008.925071
Killeen, T., Easthope, C. S., Demko, L., Filli, L., Lorincz, L., Linnebank, M., . . . Bolliger, M. (2017). Minimum toe clearance: probing the neural control of locomotion. Sci Rep,
7(1), 1922. doi: 10.1038/s41598-017-02189-y
Ko, S. U., Tolea, M. I., Hausdorff, J. M., & Ferrucci, L. (2011). Sex-specific differences in gait patterns of healthy older adults: results from the Baltimore Longitudinal Study of Aging. J Biomech, 44(10), 1974-1979. doi: 10.1016/j.jbiomech.2011.05.005
Landi, F., Liperoti, R., Russo, A., Giovannini, S., Tosato, M., Capoluongo, E., . . . Onder, G. (2012). Sarcopenia as a risk factor for falls in elderly individuals: results from the ilSIRENTE study. Clin Nutr, 31(5), 652-658. doi: 10.1016/j.clnu.2012.02.007
20
Mills, P. M., Barrett, R. S., & Morrison, S. (2008). Toe clearance variability during walking in young and elderly men. Gait & Posture, 28(1), 101-107. doi: 10.1016/j.gaitpost.2007.10.006
Prince, F., Corriveau, H., Hébert, R., & Winter, D. A. (1997). Gait in the elderly. Gait and
Posture, 5(2), 128-135. doi: 10.1016/S0966-6362(97)01118-1
Rosenblatt, N. J., Bauer, A., & Grabiner, M. D. (2017). Relating minimum toe clearance to prospective, self-reported, trip-related stumbles in the community. Prosthet Orthot
Int, 41(4), 387-392. doi: 10.1177/0309364616650085
Santhiranayagam, B. K., Lai, D. T., Sparrow, W. A., & Begg, R. K. (2015). Minimum toe clearance events in divided attention treadmill walking in older and young adults: a cross-sectional study. J Neuroeng Rehabil, 12, 58. doi: 10.1186/s12984-015-0052-2 Sparrow, W. A., Begg, R. K., & Parker, S. (2008). Variability in the foot-ground clearance and
step timing of young and older men during single-task and dual-task treadmill walking. Gait Posture, 28(4), 563-567. doi: 10.1016/j.gaitpost.2008.03.013
Stergiou, N., Harbourne, R., & Cavanaugh, J. (2006). Optimal movement variability: a new theoretical perspective for neurologic physical therapy. J Neurol Phys Ther, 30(3), 120-129.
Stergiou, N., Kent, J. A., & McGrath, D. (2016). Human Movement Variability and Aging.
Kinesiology Review, 5(1), 15-22.
Stevens, J. A., Corso, P. S., Finkelstein, E. A., & Miller, T. R. (2006). The costs of fatal and non-fatal falls among older adults. Inj Prev, 12(5), 290-295. doi:
10.1136/ip.2005.011015
Stevens, J. A., & Sogolow, E. (2005). Gender differences for non-fatal unintentional fall related injuries among older adults. Injury Prevention, 11(2), 115-119. doi: 10.1136/ip.2004.005835
Thies, S. B., Price, C., Kenney, L. P., & Baker, R. (2015). Effects of shoe sole geometry on toe clearance and walking stability in older adults. Gait Posture, 42(2), 105-109. doi: 10.1016/j.gaitpost.2015.04.011
Wilson, J. L., Dunbar, M. J., & Hubley-Kozey, C. L. (2015). Knee joint biomechanics and neuromuscular control during gait before and after total knee arthroplasty are sex-specific. J Arthroplasty, 30(1), 118-125. doi: 10.1016/j.arth.2014.07.028
Winter, D. A. (1992). Foot trajectory in human gait: a precise and multifactorial motor control task. Phys Ther, 72(1), 45-53; discussion 54-46.
Winter, D. A., Patla, A. E., Frank, J. S., & Walt, S. E. (1990). Biomechanical walking pattern changes in the fit and healthy elderly. Phys Ther, 70(6), 340-347.
World Health, O. (2008). WHO global report on falls prevention in older age. Geneva: World Health Organization.