GEOACOUSTIC MATCHED-FIELD INVERSION USING A VERTICAL
VECTOR SENSOR ARRAY
Paulo Santos, Orlando Rodríguez, Paulo Felisberto, Sérgio Jesus
Institute for Systems and Robotics, University of Algarve, Campus de Gambelas 8005-139, Faro, Portugal.
Paulo Santos, Instituto Superior de Engenharia, Universidade do Algarve, Campus da Penha, 8005-139 Faro, Portugal, Fax: +351 289 888 405, pjsantos@ualg.pt.
Abstract: Vector sensors measure the acoustic pressure and the particle velocity components.
This type of sensor has the ability to provide information in both vertical and azimuthal direction allowing increased directivity. These characteristics have been explored by many authors and most of the studies on vector sensors found in literature are related to direction of arrival (DOA) estimation. However, assembled into an array, a Vector Sensor Array (VSA) improves spatial filtering capabilities and can be used with advantage in other applications such as geoacoustic inversion. In this paper it will be shown that a reliable estimation of ocean bottom parameters, such as sediment compressional speed, density and compressional attenuation, can be obtained using high-frequency signals and a small aperture vertical VSA. The introduction of particle velocity on matched-field processing (MFP) techniques is going to be presented. It will be seen how MFP, usually done with acoustic pressure, can be adapted in order to incorporate the three components of the particle velocity. Comparisons between several processors based either in individual particle velocity components or using all the VSA outputs, are made for simulated and experimental data. The quaternion model, which is founded on hypercomplex algebra, thus more appropriate to represent the 4 dimensional VSA data, is also presented in the MFP context. A novel ray tracing model is used to generate field replicas that include both the acoustic pressure and the particle velocity outputs. The data considered herein was acquired by a four element vertical VSA in the 8-14 kHz band, during the Makai Experiment 2005 sea trial, off Kauai I., Hawaii (USA). The results shows that, when the particle velocity is included it can significantly increase the resolution of bottom properties estimation and in some cases a similar result is obtained using only the vertical component of the particle velocity.
1. INTRODUCTION
Acoustic vector sensors measure both the acoustic pressure and the three components of particle velocity. Assembled into an array, a Vector Sensor Array (VSA) improves direction of arrival (DOA) estimation and provides information in both vertical and azimuthal directions [1], providing a higher directivity not possible with arrays of scalar hydrophones of same length and same number of sensors [2]. The spatial filtering capabilities give rise to new applications where VSA’s could be used with advantage over scalar hydrophones, which are appearing in different fields like moving platforms (AUV), port and waterway security [3], underwater acoustic tomography and geoacoustic inversion [4, 5].
The geoacoustic inversion and the introduction of the particle velocity on matched-field processing (MFP) inversion techniques is the objective of this paper. MFP, originally proposed for source localization, could be also applied to estimate ocean bottom parameters based in inversion techniques, usually done with acoustic pressure. However, due to the VSA ability to provide directional information and to its spatial filtering capabilities, the use of VSA could be an advantage in MFP. It will be shown that, using a small aperture vertical VSA and high-frequency signals, a reliable estimation of ocean bottom parameters, such as sediment compressional speed, density and compressional attenuation can be achieved. The classical Bartlett estimator will be adapted in order to incorporate the three components of particle velocity. The Bartlett estimators based in individual particle velocity components or acoustic pressure is compared with others based in all vector sensors output information to achieve the bottom estimation. In this context, a quaternion model, that is four dimensional hypercomplex number system, is also applied to the VSA data and show interesting results.
A novel ray tracing model – TRACE – developed at SiPLAB is introduced to generate field replicas, which include the acoustic pressure and the particle velocity outputs. This model is used to analyze the real data acquired by the VSA during Makai experiment 2005, off Kauai I., Hawaii (USA) [6]. The simulated and experimental results show that when the particle velocity is included it can significantly increase the resolution of bottom properties estimation. The results are in line with those previously obtained with bottom loss deduced by up/down ratio [7].
2. VSA MATCHED-FIELD PROCESSING
In order to test the use of MFP inversion with the VSA, particle velocity components must be modeled. The horizontal (vr) and vertical (vz) particle velocity components can be calculated from sound pressure as the gradient:
r p i vr ∂ ∂ − =
ωρ
and z p i vz ∂ ∂ − =ωρ
, (1) whereω
is the circular frequency andρ
is the water density. Then, the vx and vy components are calculated projecting the horizontal component (vr) in the azimuthal direction of the source estimated in [2].Thus, for particle velocity field replicas generation, the TRACE model was developed at SiPLAB [8]. The TRACE model is a ray tracing model, designed to perform two-dimensional acoustic ray tracing in ocean waveguides with flat or variable boundaries, whose properties can be range dependent and can provide different sets of output information like acoustic pressure and particle velocity.
In this study, a half-infinite liquid bottom model with three parameters: sediment compressional speed (cp), density (ρ) and attenuation (
α
p) is used for geoacousticinversion. Several data arrangements in Bartlett estimator are tested to perform the bottom parameters matched-field inversion based on vector sensor outputs.
The classical Bartlett estimator can be written as:
2 2 ) , , , ( ) ( ) , , , ( ) ( ˆ ) , , , ( ) , , , ( p p p p p p H p p B c f f c f f c f c f P α ρ α ρ α ρ α ρ e d e R e ⋅ ⋅ = , (2)
where d is the acoustic data field received by the four vector sensors at frequency f , e is the model predicted data field, H represents the complex transposition conjugation operator and the correlation matrix estimated for each frequency is given by = ∑ ⋅
= K k H k k f f K f 1 ) ( ) ( 1 ) ( ˆ d d R ,
where K is the number of snapshots.
In order to incorporate particle velocity and show the advantage of vector sensors in inverse problems, four different forms to compare data and replica are tested:
1) First, the data d and replica e in Eq. (2) are considered as only acoustic pressure or one of the components of particle velocity – named single Bartlett estimators (pressure or individual particle velocity components),
2) VSA estimator – named Bartlett VSA (p+v) estimator, considering all components of the four elements VSA. The data and replica vectors are:
[
,..., , ,..., , ,..., , ,...,]
, 4 1 4 1 4 1 4 1 p vx vx vy vy vz vz T p (3)where pn is the acoustic pressure and n x v , n y v and n z
v are the three components of the particle velocity at the nth sensor.
3) VSA estimator – named Bartlett VSA (v) estimator, applied to only the particle velocity outputs, where data and replica vectors are:
[
,..., , ,..., , ,...,]
, 4 1 4 1 4 1 T z z y y x x v v v v v v (4) and finally4) Based on quaternion theory – named Bartlett Quaternion estimator, where data and replica vectors are:
[
q1,q2,q3,q4]
, (5) being p v i v j v k n n n y z x n n = + + +q the quaternion at the nth sensor .
Quaternion is a four dimensional hypercomplex number system introduced by Hamilton in 1843 [9], and are an extension of complex numbers to four-dimensional space. A quaternion q is described by four components (one real and three imaginaries) [10] while here it is considered that the real part is attributed to acoustic pressure and the imaginary parts to the three components of particle velocity.
3. SIMULATION RESULTS
Vector sensor provides the particle velocity fields besides the acoustic pressure, then MFP based on cases 1), 2), 3) and 4) presented in previous section, is applied to invert the sediment compressional speed (cp), density (ρ) and compressional attenuation (
α
p). Simulation results conclude that the field is less sensitive to attenuation and has the higher sensitivity to the sediment compressional speed, therefore cpand ρambiguity surfaces are obtained for different values ofα
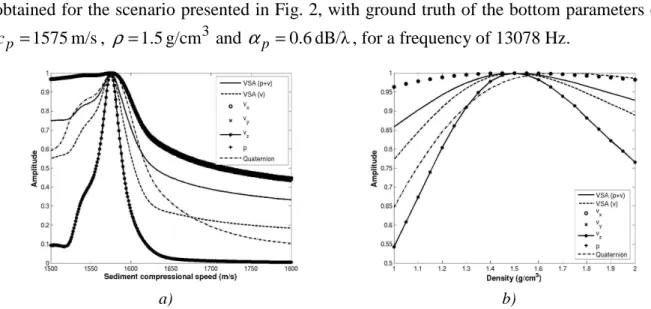
p. To reach the optimal matching and to clearly show the advantage of the MFP based on VSA, the simulated results of Bartlett estimators considering,single and conjugated VSA estimators, are presented in Fig. 1. The simulations results were obtained for the scenario presented in Fig. 2, with ground truth of the bottom parameters of:
m/s 1575 =
p
c , ρ=1.5g/cm3 and
α
p =0.6dB/λ, for a frequency of 13078 Hz.a) b)
Fig.1: Simulations results for frequency 13078 Hz and α =0.6dB/λ for: a) sediment sound speed (with ρ =1.5g/cm3) and b) density (with cp =1575m/s).
The lines for pressure (p ) and horizontal particle velocity components (v andx vy) are coincident, Fig 1, since those components mostly depend on low-order modes, thus have little interaction with the bottom. On the other hand, the vertical component (vz) has a higher sensitivity to bottom structure than other components, because it is influenced by high-order modes [4]. The same conclusion is obtained when the VSA Bartlett estimators are compared. The one that considers only particle velocity components has the main lobe narrower with better resolution than the other that includes acoustic pressure. A physical interpretation is that the vertical field carries more information about the bottom structure than pressure and particle velocity is more sensitive to variations to sediment compressional speed than to density.
4. REAL DATA VSA INVERSION RESULTS A – Experimental setup
a) b)
Fig. 2: a) Site bathymetry, with localization of the VSA on September 20th 2005 and the acoustic source TB2 and (b) baseline environment with experiment geometry and measured
The data analyzed here were acquired by a four element vertical VSA during 2 hours, on September 20th 2005, within the Makai sea trial that took place from 15 September to 2 October, on the North West coast of Kauai I., Hawai, USA [6]. Fig. 2 a) shows the bathymetry of the area where it can be seen an almost smooth and uniform area of constant depth around 80-100m accompanying the island bathymetric contour surrounded by the continental relatively steep slope to the deeper ocean to the West. Most of the bottom in the area is covered with coral sands over a basalt hard bottom.
The VSA was located at 22.1526 N and -159.7976 W, with a range independent water depth of approximately 104 m and deployed at 79.6 m depth with 10 cm spacing down, between elements. The experimental baseline environment with the sound speed profile is shown in Fig. 2 b). The acoustic source TB2 was bottom moored at 98.2 m depth and 1830 m of range and the signals emitted by TB2 were in the 8-14 kHz band, constituted by LFM's (linear frequency modulated), Multitones and M-sequence. The signal used to invert data was the tone at 13078 Hz.
B – VSA Bartlett estimator
a) b) c)
Fig. 3: Real data ambiguity surfaces for sediment compressional speed during the period of acquisition, for: a) Bartlett vertical component, b) Bartlett VSA (p+v) and c) Bartlett
Quaternion.
The MF method based on vector sensor discussed on simulations results is applied to real data, acquired by the VSA. The MF inversion technique was applied considering the sediment sound speed and density for each value of attenuation between 0.1 and 0.9 dB/λ , because of its less sensitivity to the MF inversion. To reach the best matching of bottom parameters the attenuation were chosen when the estimator had the maximum value corresponding at 0.6 dB/λ . The ambiguity surfaces illustrated in Fig. 3 were obtained for the maximum values of estimator functions along the time showing the stability of the results. Fig. 3 (a) illustrates that the vertical component has a narrow main lobe but for some periods of data acquisition the results are unstable. This may be due to the variability of the water column during the period of acquisition (almost 2 hours) and the results were obtained with a mean sound speed profile. Fig. 3 (c) clearly shows that the estimate of sediment speed is 1580±5 m/s, proving that the quaternion model is more appropriate to represent the VSA data than the Bartlett VSA (p+v) estimator, which has a wider main lobe, Fig. 3 (b). These results are in line to those obtained in previous section. For density the uncertain estimation is 1.4±0.1 g/cm3 for the Vz and Quaternion estimators while for the VSA is 1.4±0.2 g/cm3.
One can concluded that the particle velocity information in quaternion model has advantage when bottom parameters estimation based on MF inversion is considered, even at high-frequencies.
5. CONCLUSION
In this paper, the possibility of using a vector sensor array and active signals in the 8-14 kHz band to estimate bottom properties was presented. The proposed geoacoustic inversion based on VSA matched-field shows the advantage of including the particle velocity information in such inverse problems. The classical Bartlett estimator adapted to vector sensor information presented interesting results for bottom parameters estimation and the information given by the vertical particle velocity component and quaternion model provided that sediment compressional speed can be obtained with high-resolution and showed stability along time. The VSA based estimators illustrated that density and attenuation, usually parameters with difficult estimation, presented good sensitivity and the MF based on vector field information can decrease the uncertain estimation of these parameters, demonstrated that the channel signature has sufficient structure in this normally considered high-frequency band for bottom estimation. The particle velocity information enhances the ocean bottom parameters estimation, contributing to a better resolution of these parameters. The usage of VSA with high-frequencies will provide an alternative for a compact and easy to deploy system in various underwater acoustical applications.
6. ACKNOWLEDGEMENTS
The authors would like to thank Michael Porter, chief scientist for the Makai Experiment, Jerry Tarasek at Naval Surface Weapons Center for the use of the vector sensor array used in this work, Bruce Abraham at Applied Physical Sciences for providing assistance with the data acquisition, and the team at HLS Research for their help with the data used in this analysis. The authors also thank Nicolas le Bihan and Steve Sangwine for providing the Quaternion toolbox for Matlab.
REFERENCES
[1] A. Nehorai and E. Paldi, Acoustic Vector-Sensor Array Processing, IEEE Transactions on Signal Processing, 42 (9), pp. 2481-2491, September 1994.
[2] P. Santos, P. Felisberto and P. Hursky, Source Localization with vector sensor array during Makai experiment, In 2nd International Conference and Exhibition on Underwater Acoustic Measurements: Technologies and Results, Heraklion, Greece, 2007.
[3] J. C. Shipps and B. M. Abraham, The use of vector sensors for underwater port and waterway security, In Sensors for Industry conference, New Orleans, Louisiana, USA, 2004.
[4] H. Peng and F. Li, Geoacoustic inversion based on vector hydrophone array, Chin. Phys. Lett., 24, pp. 1997-1980, 2007.
[5] D. Lindwall, Marine seismic surveys with vector acoustic sensors, In Proceedings of Soc. Exploration Geophysicists annual meeting, New Orleans, USA, 2006.
[6] Michael Porter et al., The Makai Experiment: High-frequency acoustics, In 8thECUA,
Carvoeiro, Portugal, Proc. edited by S. M. Jesus and O. C. Rodríguez, 1, pp. 9-18, 2006. [7] P. Santos, P. Felisberto and S. Jesus, Estimating bottom properties with a vector sensor array during MakaiEx 2005, In Second International Workshop on Marine Technology, MARTECH 2007, 15 and 16 of November, Vilanova I LA Geltrú, Barcelona, Spain, 2007.
[8] O. C. Rodríguez, The TRACE ray tracing model, http://www.siplab.fct.ualg.pt/models.shtml, 2008.
[9] W. R. Hamilton, On Quaternions, In Proc. Royal Irish Academy, 1843.
[10] S. Miron, N. Le Bihan and J. I. Mars, Quaternion-MUSIC for Vector-Sensor Array Processing, IEEE Trans. Signal Processing, 54, 4, pp 1218-1229, April, 2006.