ISSN 0104-6632 Printed in Brazil
www.abeq.org.br/bjche
Vol. 31, No. 01, pp. 35 - 46, January - March, 2014
Brazilian Journal
of Chemical
Engineering
ON THE PREDICTION OF PICKUP AND
SALTATION VELOCITIES IN PNEUMATIC
CONVEYING
L. M. Gomes
1*and A. L. Amarante Mesquita
2*1Faculdade de Ciências Naturais, Campus de Marabá, UFPA, Phone: (94) 2101-5900, Fax: (94) 2101-5901,
Folha 17, Quadra 04, Lote Especial, CEP: 68505-080, Marabá - PA, Brazil. E-mail: [email protected]
2Laboratório de Transporte Pneumático, Faculdade de Engenharia Mecânica, UFPA, R. Augusto Correia 01,
CEP: 66075-110, Belém - PA, Brazil. E-mail: [email protected]
(Submitted: January 26, 2012 ; Revised: May 01, 2013 ; Accepted: May 10, 2013)
Abstract - This paper presents a comparative study of the critical pickup and saltation velocities of particles in horizontal pipelines for pneumatic conveying design. A comparative study is performed using different existing correlations in the literature for the determination of the minimum velocity of transport as a function of the particle and pipe diameter, particle density, solid mass flow rate and particle sphericity. Their limitations and difficulties in predicting those critical velocities are analyzed. For the pickup velocity, an experimental study was also carried out in order to support the analysis. Recommendations are presented on the use of such correlations.
Keywords: Pickup velocity; Saltation velocity; Pneumatic conveying; Gas-solid flow.
INTRODUCTION
Pneumatic conveying is a process in which solid particulate materials are conveyed by gas flow through pipeline systems. Nowadays, this type of transport has become a popular technique in the field of particulate materials. Applications for pneumatic conveying systems can be found in many industrial areas, such as ore processing and in the chemical, pharmaceutical, agricultural and food processing industries.
A key parameter for successful operation of a pneumatic conveying system is the minimum ve-locity required for particle entrainment, also known as the pickup velocity. The minimum velocity to maintain the particulate flow is called the saltation velocity. The knowledge of these velocities is critical for an accurate design of a pneumatic conveying system. If the fluid velocity is much higher than is
necessary, the system is subjected to unnecessary energy losses, particle attrition and excessive pipe erosion. A fluid velocity below these critical veloci-ties can result in clogged pipelines.
Both pickup and saltation velocities are functions of the particle properties, such as size, density and sphericity, fluid properties, such as density and vis-cosity, and the main process variable, the solid mass flow rate. Despite the existence of advanced model-ing for turbulent gas-solid flows (Huilin et al., 2003) and modern powerful numerical methods to solve this complex flow model (Chu and Yu, 2008; Pirker
et al., 2010), the empirical correlation for both pickup and saltation velocities still remains as a practical issue for industrial pneumatic conveying systems design
several limitations and contradictions, as reviewed by Yi et al. (1998) and Rabinovich and Kalman (2008).
The goal of this paper is to provide a critical analysis of the pickup and saltation velocities, considering the influence of parameters such as particle and pipeline diameters, particle density and solids loading ratio. For the pickup velocity, an experimental study was also carried out to support the analysis. Thus, this paper presents recommenda-tions on the limitarecommenda-tions of the existing correlarecommenda-tions.
LITERATURE REVIEW
The minimum transport velocity is defined as the lowest velocity at which particles can be transported inside a pipeline in a stable manner without deposi-tion on the bottom of the pipe. The saltadeposi-tion velocity is defined as the gas velocity in a horizontal pipeline in which the particles begin to fall from their state of suspension and are deposited at the bottom of the pipeline.
The pickup velocity is defined as the gas velocity necessary to suspend the particles initially at rest in the bottom of the pipeline (see Figure 1), or it may be defined as the fluid velocity required to initiate a sliding motion, rolling and suspension of the particles.
(a)
(b)
Figure 1: (a) Particles at rest in the bottom of the pipeline. Air velocity less than the pickup velocity. (b) Particles are dragged by the air stream. Air velocity equal to or greater than the pickup velocity.
The main correlations found in the literature that are used for predicting the critical pickup and saltation velocities are presented below. These correlations are analyzed in this work.
Main Correlations Used for Predicting Critical Saltation Velocity
Rizk (1976)
x S d
f S
Ws 1 Fr U A 10
⎛ ⎞
ζ = = ⎜ ⎟
ρ ⎝ ⎠ (1)
where:
S S T
Fr =U / g D (Froude number at the Saltation velocity),
d 1.44d
=
p+
1.96
,x 1.1d
=
p+
2.5
, (d and x in mm), ζ is the solids loading ratio, WS is the solids mass flow rate, dp is the particle diameter, DT is the pipe diameter, US is the saltation velocity, ρf is the fluid density, g is the acceleration of gravity and A is the cross-sectional area of pipe.Matsumoto et al. (1977)
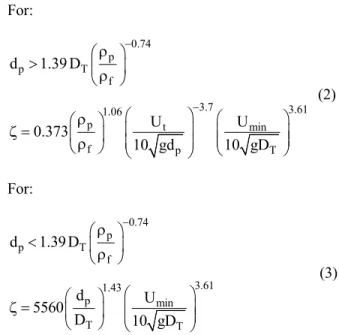
For:
0.74 p
p T
f
3.7 3.61
1.06
p t min
f p T
d 1.39 D
U U
0.373
10 gd 10 gD
−
−
ρ
⎛ ⎞
> ⎜ ⎟
ρ
⎝ ⎠
⎛ ⎞ ⎛ ⎞
ρ
⎛ ⎞ ⎜ ⎟
ζ = ⎜ρ ⎟ ⎜ ⎟ ⎜⎜ ⎟⎟
⎝ ⎠ ⎝ ⎠ ⎝ ⎠
(2)
For:
0.74 p
p T
f
3.61 1.43
p min
T T
d 1.39 D
d U
5560
D 10 gD
−
ρ
⎛ ⎞
< ⎜ ⎟
ρ
⎝ ⎠
⎛ ⎞
⎛ ⎞
ζ = ⎜ ⎟ ⎜⎜ ⎟⎟
⎝ ⎠ ⎝ ⎠
(3)
where ρp is the particle density, Ut is the terminal velocity and Umin is the minimum conveying velocity.
Schade (1987), apud Yi et al.(1998)
0.025 0.34
p 0.11
S T
p f
T
U D
d gD
⎛ ⎞ ⎛ρ ⎞
= ζ ⎜⎜ ⎟⎟ ⎜ρ ⎟
⎝ ⎠
⎝ ⎠ (4)
Weber (1981)
On the Prediction of Pickup and Saltation Velocities in Pneumatic Conveying 37 t 0.1 p 0.25 min t T
U 3 m / s
d 8
Fr 7 U
3 D
≤
⎛ ⎞
⎛ ⎞
=⎜ + ⎟ζ ⎜ ⎟
⎝ ⎠ ⎝ ⎠ (5) For: t 0.1 p 0.25 min T
U 3 m / s d
Fr 15
D >
⎛ ⎞
= ζ ⎜ ⎟
⎝ ⎠
(6)
where Frmin is the Froude number at the minimum conveying velocity.
Geldart and Ling (1992)
For:
s t
0.465 0.01 0.55 0.42
min s T f
G
47000 D
U 1.5G D − −
<
= μ ρ
(7)
For:
s t
0.302 0.153 0.55 0.42
min s T f
G
47000 D
U 8.7 G D −
<
= μ ρ (8)
where, (in kg/m.s) is the dynamic viscosity of the gas and Gs (in kg/m2.s) is the solids flux.
Ochi (1991) 0.82 0.47 0.25 s t s p p U U 1.05f
gd g d
⎛ ⎞ ⎜ ⎟ = ζ ⎜ ⎟ ⎝ ⎠ (9)
where fs is the particle friction coefficient with the pipeline wall.
Cabrejos and Klinzing (1994)
1.25
p 0.5
S s0
p p f
U U
0.00224
g d g d
⎛ ρ ⎞
= + ⎜⎜ ⎟⎟ ζ
ρ
⎝ ⎠ (10)
where, Us0 is the saltation velocity of a single particle.
Kalman and Rabinovich (2008)
For:
(
)
(
)
2.33 0.35 V 0.1 2.33p p mp 0.35
V
1 30C Ar
d U
14.3 1 30C Ar 2450
+
ρ ⎛ ⎞
= ⎜ + ⎟
μ ⎝ ⎠
<
(11)
where, Ump is the minimum pressure velocity and,
(
)
3f p f p
2
gd
Ar=ρ ρ − ρ , (Archimedes number) μ For, 2.33 0.1 0.35 V 3/7 2.33 0.1
f p mp 0.35
V
1
30C Ar
d U 1
1.1 30 C Ar
⎛⎛ − ε⎞ + ⎞
⎜⎜ ⎟ ⎟
⎜⎝ ε ⎠ ⎟
⎝ ⎠
⎛⎛ ⎞ ⎞
ρ ⎜ ⎛ − ε⎞ ⎟
= ⎜⎜⎜⎜ ⎟ + ⎟⎟ ⎟
μ ⎝⎝ ε ⎠ ⎠
⎝ ⎠ (12) where,
(
)
f V p fC = ζρ , solids volumetric concentration ρ + ζρ
Main Correlations Used for Predicting the Critical Pickup Velocity
Cabrejos and Klinzing(1992)
–1/3 1/3
p
–1/5
p0
U 1.27 Ar 0.036 Ar 0.45
0.70 Ar 1 U
⎡ ⎤ ⎣ ⎦ ⎡ ⎤ ⎣ ⎦ = + + + (13)
where Up0 is the pickup velocity of a particle alone and,
1.5
p s p p f
r D
p
f 0
d 4f gd
1 8 U
D 3 C
coarse particle
⎡ ⎛ ⎞ ⎤ ⎛ρ − ρ ⎞
π ⎢ ⎥
= − ⎜ ⎟ ⎜ ⎟
ρ
⎢ ⎝ ⎠ ⎥ ⎝ ⎠
⎣ ⎦
(14)
(
)
(
)
1-2
1.5 7 2
p po
-4 4
D f p 3
T T
1
21 8
po
3 -6 -3 3
s p p f p f p 5 3
T
d U
1.54 x10 1- C d
D v D
U
f gd - 1.302 x 10 d - 6.35 x 10 d fine particle
6 v D
⎡ ⎛ ⎞ ⎤ ⎛ ⎞ ⎢ ⎜ ⎟ ⎥ ⎜ ⎟ ⎜ ⎟ ⎢ ⎝ ⎠ ⎥ ⎝ ⎠ ⎣ ⎦ ⎡ ⎤ ⎛ ⎞ ⎢ ⎥ ⎜ ⎟ ⎢ ⎜ ⎟ ⎥ ⎢ ⎝ ⎠ ⎥ ⎢ ⎥ ⎣ ⎦ ρ π
= ρ ρ + ρ
(15)
is the kinematic viscosity.
Cabrejos and Klinzing(1994)
0.25 0.75
p 0.175 T p
p p f p U D 0.0428 Re d g d
⎛ ⎞ ⎛ρ ⎞
= ⎜⎜ ⎟⎟ ⎜ρ ⎟
⎝ ⎠
⎝ ⎠ (16)
where Rep is the particle Reynolds number. Valid for:
25 < Rep < 5000, 8 < (DT/dp) < 1340 and 700 < (ρp/ρg) < 4240.
Kalman et al. (2005)
First Zone: 3 7
* p
Re =5Ar , for Ar > 16.5 (17)
Second Zone:
* p
Re =16.7 , for 0.45 < Ar < 16.5 Third Zone:
1 3
* p
Re =21.8 Ar , for Ar < 0.45
where,
D / DT T50 1.5
f p p
* p
U d Re
1.4 0.8e− ρ =
⎛ ⎞
μ⎜ − ⎟
⎝ ⎠
where DT50 is a 50 mm pipe diameter. Valid for:
0.5 < Re < 5400, 2x10*p -5 < Ar < 8.7x10⁷, 0.53 < dp< 3675 m, 1119 < ρs< 8785 kg/m3 and 1.18 < ρg
< 2.04 kg/m3.
Rabinovich and Kalman (2009)
Non-Spherical Coarse Particle (Drag)
0.29 p 2
D p s
T 2.02
s
d n
C Re 0.1f
8 D
1
Re f Ar 0
6
⎛ ⎞
π + ⎜ ⎟
⎝ ⎠
− π =
(18)
Spherical Coarse Particle (Rolling)
0.29 p 2
D p s
T p 2.02 s d n
C Re 0.1f
8 D
d 1
Re f Ar 0
6 2
⎛ ⎞
π + ⎜ ⎟
⎝ ⎠
− π =
(19) Fine particle 0.375 p 1.96 50 T
h f p
2.625
2 2
d 0.0277n Re 0.00635
D
A d
1
Re Ar
6 12 s
⎛ ⎞ + ⎜ ⎟ ⎝ ⎠ ρ π = + μ (20)
where AH is the Hamaker constant, n is the wall effect coefficient, fs is the friction coefficient and Re50 is the Reynolds number for the pickup velocity measured in a pipe of 50 mm in diameter.
COMPARISON OF CORRELATIONS FOR THE SALTATION VELOCITIES
On the Prediction of Pickup and Saltation Velocities in Pneumatic Conveying 39
gas at ambient conditions (ρ = 1.18 kg/m3
). These analyses were designed to assess the influence of average particle diameter, pipeline diameter and solids mass flow rate at the saltation velocity, thus providing evidence for the indication of the best correlations in specific design situations.
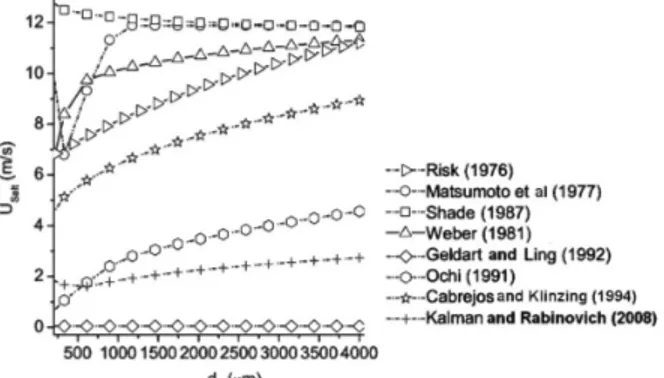
Influence of Particle Diameter
Figure 2 presents a plot of the saltation velocity as a function of the average diameter of fine particles (0-200 m). The mass flow rate of solids (Ws = 350 kg/h) was kept constant in all simulations. An inner diameter of 50.4 mm for the horizontal pipeline was used. Sand particles were used (ρp = 2636 kg/m3
) in all simulations. The result indicate that only the Rizk (1976) correlation presented a variation with the increase of the average particle diameter, which sug-gests that all other correlations are not appropriate for predicting pickup velocity throughout a wide range of average particle diameters. It was also observed that the correlation of Rizk (1976) follows the physical behavior for the whole range of particle diameters, since for small particle sizes the effect of cohesive forces is higher, requiring a higher velocity for the particle entrainment (Cabrejos and Klinzing,
1994; Hayden et al. 2003; Rabinovich and Kalman, 2009).
Figure 2: Velocity of deposition as a function of average particle size. dp: 0 - 200 micrometers.
Figure 3 shows the plot of saltation velocity as a function of average particle diameter of 200-4000 µm. The mass flow rate of solids was maintained constant at 350 kg/h, and a horizontal pipeline with an inner diameter of 50.4 mm was used. The average particle diameter ranged from 100 to 4000 m. Sand particles were used (ρp = 2636 kg/m3
) in all simulations. The data indicate that some correlation predict an almost constant saltation velocity (Geldart and Ling, 1992 and Kalman and Rabinovich, 2008), and others very low values for the range from 0 to
2.5 m/s. Other correlations (Rizk, 1976; Matsumoto
et al., 1977; Weber, 1981; Ochi, 1991; Cabrejos and Klinzing, 1994) showed an increase in the saltation velocity with the increase in average particle diame-ter. The results of Shade (1987) showed that the saltation velocity decreases with the increase of the average particle diameter, which is not in accordance with the real physical behavior. The comparison be-tween the lowest and highest value of the saltation velocity results in a value of approximately 13 m/s.
Figure 3: Velocity of deposition as a function of average particle size. dp: 200 - 4000 micrometers.
Influence of Pipeline Diameter
Figure 4 shows a plot of saltation velocity as a function of pipeline diameter. The simulations were made with sand particles (ρp = 2636 kg/m3
) with particle diameter (dp = 200 m) at a solid mass flow rate of 350 kg/s. A great discrepancy in the results was found. Some correlations provide a practically constant saltation velocity estimation (Geldart and Ling, 1992; Ochi, 1991), showing low values for the range from 0 to 1 m/s. Other correlations (Rizk, 1976; Shade, 1987; Matsumoto et al., 1977; Cabrejos and Klinzing, 1994; Kalman et al., 2005) show an increase with the diameter of the pipeline.
Conversely, other correlation (Weber, 1981; Ochi, 1991; Geldart and Ling, 1992) show a decrease in the saltation velocity when the pipeline diameter was increased. The difference between the highest and lowest saltation velocity value for a pipe diame-ter of 200 mm is approximately 19 m/s.
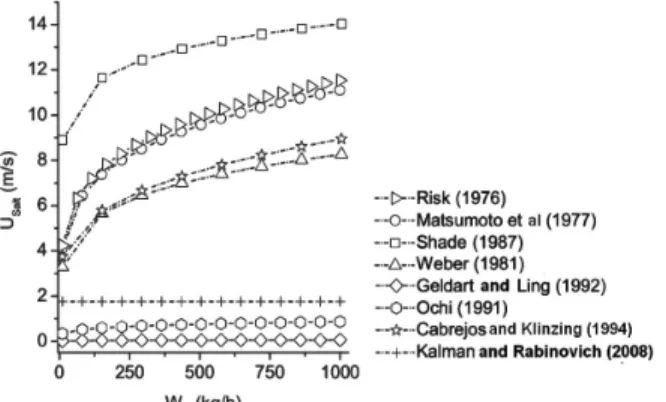
Influence of the Solids Mass Flow Rate
Figure 5 shows a plot of saltation velocity as a function of mass flow rate for solid particles of sand (ρp = 2636 kg/m3
). The simulations were carried out for particle and pipeline diameters of 200 m and 50.4 mm, respectively. The range for the solid mass flow employed was from 50 to 1000 kg/s. Some correlations (Geldart and Ling, 1992; Ochi, 1991; Kalman et al., 2008) remained constant in the range of very low saltation velocity values (between 0 and 2 m/s) and other correlations show growth with an increase in solid mass flow (Weber, 1981; Cabrejos and Klinzing, 1994; Matsumoto et al., 1977; Rizk, 1976; Shade, 1987). The saltation velocity values are very divergent. The difference between the highest and lowest saltation velocity for the solid mass flow rate of 1000 kg/s was about 14 m/s.
Figure 5: Saltation velocity as a function of the solids mass flow rate.
COMPARISON OF THE PICKUP VELOCITY CORRELATIONS
For the determination of the pickup velocity, four significant correlations available in the literature were evaluated. In all simulations air was used (ρf = 1.18 kg/m3) as the transporter gas. The goal of the simulations was to analyze the influence of the particle size, pipe diameter and particle density. This was accomplished by varying one parameter and keeping the others constant. In order to support this analysis, experimental work was also carried out. In
the following section the testing bench is described, as well the characteristics of the materials used.
The Experimental Setup
An experimental apparatus, see Figure 6, was developed to determine the pickup velocity, which consists basically a 1.5-meter-long, 50 mm diameter horizontal steel pipeline; three horizontal PVC pipe-lines (each 6 meters long and 50, 75 and 100 mm in diameter), with a butterfly valve at the end of each pipeline; three transparent sections (placed in the middle of the PVC pipelines, where the visual obser-vations were carried out); a root blower (controlled by a frequency inverter), which provides the gas flow rate and pressure necessary for picking up the particles; and a solids collector with a paper filter bag placed on its top. A complete description of this experimental setup can be found in Gomes (2011). Experiments were carried out using air as the conveying gas at ambient conditions.
Figure 6: Schematic representation of the experimental setup.
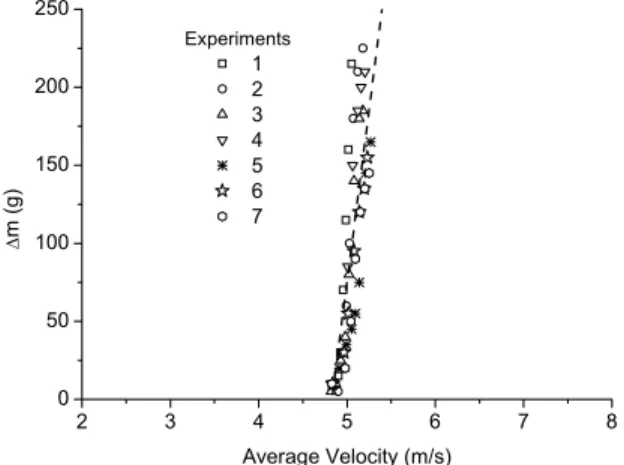
The experimental run starts with a stationary layer of particles placed in the central section of a transparent pipe. Air flow is initiated at a constant volumetric flow rate through the pipe. As the free cross-sectional area of the pipe increases, the air velocity decreases due to the removal of the particles. When the velocity is no longer sufficient to entrain any additional particles, a final state of equilibrium is automatically reached. This procedure is repeated until nearly 95 per cent of the whole material has been captured. Plotting the amount of entrained particles (weight reduction of the layer) as a function of operating gas velocity made it possible to determine the pickup velocity by the intersection of the extrapolated curve passing through the meas-ured points and abscissa (see Figure 7). Obviously, a higher number of measurements will improve the accuracy, especially if determinations with very small weight losses are in progress.
On the Prediction of Pickup and Saltation Velocities in Pneumatic Conveying 41
constant volumetric flow rate through the pipeline with one of the three butterfly valves opened. The layer started to erode slowly as the gas stream picked up the top particles.
2 3 4 5 6 7 8
0 50 100 150 200 250
1 2 3 4 5 6 7
Δ
m (g)
Average Velocity (m/s)
Experiments
Figure 7: Weight loss as a function of the average air velocity. Experimental data. dp = 179.5 m.
This experiment was performed using sand and alumina particles. The particle diameters used in the tests were obtained by the method of separation by sieves. The mean diameter was calculated as the arithmetic mean of consecutive sieve openings. Figures 8-9 show the sand and alumina particles with non-spherical shape. Table 1 presents the properties (density, size distribution, mean diameter and shape) and Geldart classification of the particles used in the measurements. The density was measured with a pycnometer. All tests were conducted with a narrow
range of particle sizes prepared by sieving.
Table 2 shows experimental data used in this paper for the pickup velocity study.
Figure 8: Alumina particles, dp = 62 m.
Figure 9: Sand grains, dp = 340 µm.
Table 1: Properties of the particles tested in this research.
Particle Density (kg/m3)
Size range (μm)
Mean Diameter (μm)
Sphericity
50-90 70
90-150 120
150-250 200 250-430 340 600-430 510 600-850 730 850-1000 930 1000-2360 1680 2360-3350 2860 Sand 2636
3350-4360 3860
ψ = 0.7
53-90 71.5
90-125 107.5
125-150 137.5 Alumina 3750
150-205 177.5
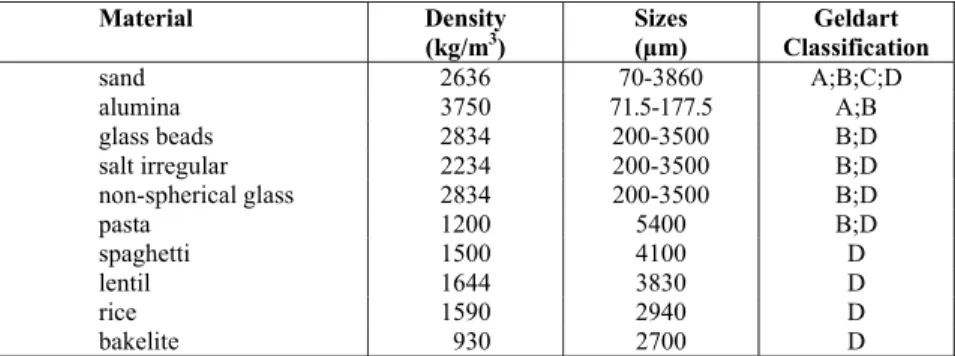
Table 2: Experimental data used in this paper for the pickup velocity study and Geldart Classification.
Material Density (kg/m3)
Sizes (µm)
Geldart Classification
sand 2636 70-3860 A;B;C;D
alumina 3750 71.5-177.5 A;B
glass beads 2834 200-3500 B;D
salt irregular 2234 200-3500 B;D
non-spherical glass 2834 200-3500 B;D
pasta 1200 5400 B;D
spaghetti 1500 4100 D
lentil 1644 3830 D
rice 1590 2940 D
bakelite 930 2700 D
Figure 10 presents the plot of the pickup velocity as a function of average particle diameter. A pipe diameter of 50.4 mm and a particle diameter ranging from 200 to 3500 m were employed in the simula-tions. Experimental data are compared for sand parti-cles (ρp = 2636 kg/m3), glass beads (ρp = 2834 kg/m3
) and irregular grains of salt (ρp = 2234 kg/m3
) with a pickup velocity of sand particles (ρp = 2636 kg/m3
) obtained from Cabrejos and Klinzing (1992), Cabrejos and Klinzing (1994), Kalman et al. (2005) and correlations from Kalman et al. (2009).
Figure 10: Experimental pickup velocity as a function of the particle diameter and correlation curves. dp: 200-3500 m.
From an analysis of the curves obtained with the use of the above mentioned correlations, it was verified that all of them show an increase in the pickup velocity as the average particle diameter is increased. However, for a given average particle size, there is a large divergence between the values of pickup velocities obtained and values predicted by the correlations. This shows that such correlations present limitations in predicting reliable values of pickup velocities. It is noted that three correlations present a fair agreement among themselves for predicting the pickup velocity up to approximately the average particle diameter of 1500 m. For
particle diameters above this limiting value, the results begin to diverge considerably. The values obtained with the correlations of Rabinovich and Kalman (2009) are usually very low and those ob-tained with the correlation of Cabrejos and Klinzing (1992) for particle average diameter above 1500 m rise very quickly. It should be noted here that the correlation of Cabrejos and Klinzing (1992) was obtained from a theoretical model and some of the parameters were adjusted empirically. The correla-tion of Cabrejos and Klinzing (1994) is fully empirical. Note also that the correlations of Cabrejos and Klinzing (1994) and Kalman et al.(2005) agree reasonably well with each other. All correlations agree reasonably well with the experimental data, although the correlations by Cabrejos and Klinzing (1994) and Kalman et al. (2005) show a better fit when the whole range of particle diameter is considered.
Figure 11 presents the plot of the pickup velocity as a function of average particle diameter for fine particles. The simulations were made with data for sand particles (ρp = 2636 kg/m3) and the results com-pared with experimental data for non-spherical glass (ρp = 2834 kg/m3), irregular salt (ρp = 2234 kg/m3
), sand (ρp = 2636 kg/m3) and glass beads (ρp = 2834 kg/m3
On the Prediction of Pickup and Saltation Velocities in Pneumatic Conveying 43
Figure 11: Pickup velocity as function the diameter of the particles. dp: 0 - 200 m
Influence of Pipe Diameter
Figure 12 presents the plot of the particle pickup velocities of irregular shaped polyester beads (ρp = 1400 kg/m3 and dp = 3 mm), glass beads (ρp = 2480 kg/m3 and dp = 0.45 mm) and non-spherical alumina (ρp = 3750 kg/m3
and dp = 0.45 mm), as a function of the pipeline diameter obtained with the use of the correlations of Cabrejos and Klinzing (1992), Cabrejos and Klinzing (1994), Kalman et al. (2005) and Rabinovich and Kalman (2009). The results obtained are compared with experimental data ob-tained by Cabrejos and Klinzing (1994). It is found that the correlation of Rabinovich and Kalman (2009) presents a behavior totally different from the other correlations, i.e., the pickup velocity decreases with increasing pipeline diameter. Values obtained with this correlation are also extremely low. The values obtained with the correlation of Cabrejos and Klinzing (1992) for the irregular polyester parti-cles are farther above the experimental results. The results obtained for glass beads and spherical alu-mina do not agree with the experimental data. The correlations of Cabrejos and Klinzing (1994) and Kalman et al. (2005) present a better fit with experi-mental values.
Figure 12: Pickup velocity as a function of pipeline diameter.
Influence of Particle Density
Figure 13 presents the plot of pickup velocity as a function of the density of sand particles with an average diameter of 1.0 mm. In the simulations the pipeline diameter was equal to 50.4 mm. The correlations of Cabrejos and Klinzing (1992) and Rabinovich and Kalman (2009) show the highest and lowest pickup velocities, respectively. For the density of 5000 kg/m3 the difference between the highest and lowest pickup velocity is approximately 16 m/s.
Figure 13: Pickup velocity as a function of particle density.
Figure 14 shows the plot of the pickup velocity as a function of particle diameter for particles of sand and alumina. The experimental data were obtained in this work. Correlations with the best agreement with the experimental data are Cabrejos and Klinzing (1994) and Kalman et al. (2005).
50 100 150 200 250 300 350 3
6 9 12 15
Alumina (Exp. - present work) Sand (Exp. - present work) Cabrejos and Klinzing (1992) Cabrejos and Klinzing (1992) Cabrejos and Klinzing (1994) Cabrejos and Klinzing (1994) Kalman et al (2005) Kalman et al (2005) Rabinovich and Kalman (2009) Rabinovich and Kalman (2009)
Up
(m
/s
)
dp (μm)
Figure 14: Pickup velocity as a function of particle density.
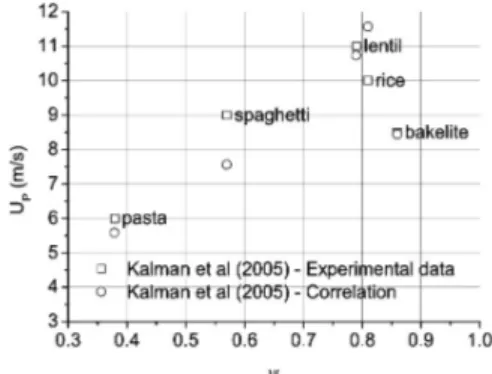
Influence of the Particles Sphericity
Figure 15 shows the pickup velocity as a function of sphericity for pasta (ρp = 1200 kg/m3
(ρp = 1500 kg/m3), lentil (ρp = 1644 kg/m3
), rice (ρp = 1590 kg /m3) and bakelite (ρp = 930 kg/m3) particulate materials. The analysis was performed only with the Kalman´s correlation (Kalman et al., 2005), since it presents a dependence of pickup velocity on sphericity. To obtain the experimental data, a pipe with a 100 mm diameter was used. The correlation shows reasonable agreement with experi-mental data. However, a careful observation of this correlation demonstrates that the pickup velocity decreases with decreasing sphericity (keeping other parameters constant), which is in contradiction to the physical phenomena involved, since the pickup velocity should increase with the reduction of the sphericity (Cabrejos and Klinzing, 1992; Cabrejos and Klinzing, 1994; Hayden et al., 2003) and not the opposite, as is the case of this correlation (see Figure 16).
Figure 16 shows the pickup velocity as a function of particle diameter for pipe diameters of 25 and 52
mm. The materials used were spherical and non-spherical glass. The experimental data are obtained from Cabrejos and Klinzing (1994), Hayden et al.
(2003) and Kalman et al. (2005). The densities are 2480, 2500 and 2834 kg/m3, respectively. The sphericity of the non-spherical glass is 0.7 (Cabrejos and Klinzing, 1994). Note that the non-spherical glass has greater velocities than the glass spheres in both pipe diameters of 25 and 50 mm. This is due to the fact that, in the case of non-spherical particles, the contact area is larger and therefore there is a greater action of the cohesion forces (Cabrejos and Klinzing, 1994; Hayden et al., 2003; Kalman et al., 2005). In Kalman’s correlation (Kalman et al., 2005) the pickup velocities of spherical particles are always larger than those for non-spherical particles, thus showing that the reasonable agreement obtained in the pickup velocity from experimental data was related to its correlation with other parameters and not necessarily with the sphericity.
Figure 15: Pickup velocity as a function of the particles sphericity.
On the Prediction of Pickup and Saltation Velocities in Pneumatic Conveying 45 CONCLUSION
Due to the different definitions of the minimum conveying velocity used by researchers and the wide scatter of the data and contradictions demonstrated in this paper, it is concluded that the correlations analyzed present great difficulty in predicting the saltation and pickup velocities. The recommenda-tions presented in this work are based on combined quantitative and qualitative analysis, so both the agreement with experimental data (quantitative) as the agreement with the observed physical phenome-non (qualitative) are considered. Based on the analy-sis of the parameters that influence saltation and pickup velocities, one may conclude that:
In the case of fine particles, the only correlation recommended for saltation velocity is the Rizk correlation (1976), since the others do not agree with the physical phenomenon in question.
It is recommended that the correlations of Rizk (1976), Matsumoto et al. (1977) and Cabrejos and Klinzing (1994) be used in determining the saltation velocity of coarse particles (average particle diameter above 200 m. The use of these correla-tions should still be considered for pipeline diame-ters ranging from 25 to 200 mm. It is noteworthy that the use of these correlations must be done with great care, since in some tests even the best correlations (those recommended here) showed low agreement with the experimental results. Nonetheless, these correlations presented the best results, but are rec-ommended here with reservations;
The correlations that presented the best per-formance for the pickup velocity prediction are those of Cabrejos and Klinzing (1994) and Kalman et al.
(2005). However, they are limited to a few tests. The Cabrejos correlation (Cabrejos and Klinzing, 1994) has the disadvantage of not providing results for very low average particle diameter (below 120 m) and also has a tendency to overestimate particle pickup velocity for very large diameters (up to 3 mm). The Cabrejo correlation must be used with caution. Thus, we recommend Kalman´s correlation for predicting pickup velocity, because it showed reasonable suc-cess in all tests, except in correlating the influence of sphericity, where it was inefficient.
ACKNOWLEDGEMENTS
The authors would like to express their gratitude for the financial support from CNPq and FAPESPA.
NOMECLATURE
A cross-sectional area of pipe m2
AH Hamaker constant N.m
Ar Archimedes number ‐
CD drag coefficient ‐
CV Solids volumetric concentration ‐ D50 inside diameter of 2'' pipe m
dp particle diameter m
DT pipe diameter m
Frmin
Froude number at the minimum
conveying velocity
-FrS
Froude number at the Saltation
velocity
-fs coefficient of sliding friction ‐ g acceleration due to gravity m/s2
GS solids flux kg/m2.s
mp particle mass kg
n Wall effect coefficient
-Re
Reynolds number related to pipe
diameter ‐
Rep
Reynolds number related to
particle diameter ‐
Rep* Reynolds number modified ‐ s
separation length between particle and the wall
m Umin minimum conveying velocity m/s Ump minimum pressure velocity m/s
Up minimum pickup velocity m/s
Up0
minimum pickup velocity for single particle
m/s
US Saltation velocity m/s
Us0
Saltation velocity of an isolated particle
m/s
Ut terminal velocity m/s
WS solids mass flow rate kg/s
Greek Letters
ε porosity
-ζ solids loading ratio
-gas dynamic viscosity kg/ms fluid kinematic viscosity m2/s
ρf fluid density kg /m3
ρp solid particle density kg /m3
ψ Particle sphericity
-REFERENCES
Cabrejos, F. J., Klinzing, G. E., Pickup and saltation mechanisms of solids particles in horizontal pneumatic transport. Powder Technology, v. 79, pp. 173-186 (1994).
Chu, K. W., Yu, A. B., Numerical simulation of complex particle-fluid flows. Powder Technology, v. 179, pp. 104-114 (2008).
Gomes, L. M., Contribution to the Dilute-Phase Pneumatic Conveying Analysis. PhD Thesis, Federal University of Pará, Brazil (2011). (In Portuguese).
Geldart, D., Liung, S. J., Saltation in high pressure conveying of fine coal. Powder Technology. v. 69, pp. 157-162 (1992).
Hayden, K. S., Park, K., Curtis, J. S., Effect of particle characteristics on particle pickup velocity. Powder Technology, v. 131, pp. 7-14 (2003). Huilin, L., Gidaspow, D., Bouillard, J., Wentie, L.,
Hydrodynamic modelling of gas-solid flow in a riser using the kinetic theory of granular flow. Chemical Engineering Journal, v. 95, pp. 1-13, (2003).
Kalman, H., Satran, A., Meir, D., Rabinovich, E., Pickup (critical) velocity of particles. Powder Technology, v. 160, pp. 103-113 (2005).
Kalman, H., Rabinovich, E., Boundary saltation and minimum pressure velocities in particle–gas systems. Powder Technology, v. 185, pp. 67-79 (2008).
Matsumoto, S., Hara, M., Saito, S. and Maeda, S., Minimum transport velocity for horizontal pneu-matic conveying. Journal of Chemical Engineering of Japan, v. 7 n. 6, pp. 425-431 (1977).
Ochi, M., Saltation velocity of the gas-solid
two-phase flow in a horizontal pipe. Proc. The First ASME-JSME Fluids Engineering Conference, FED-121, pp. 163-166 (1991).
Pirker, S., Kahrimanovic, D., Kloss, C., Popoff, B., Braum, M., Simulations coarse particle convey-ing by a set of Eulerian, lagrangian and hybrid particle models. Powder Technology, v. 204, pp. 203-213 (2010).
Rabinovich, E., Kalman, H., Generalized master curve for threshold superficial velocities in parti-cle–fluid systems. Powder Tecnology, v. 183, pp. 304-313(2008).
Rabinovich, E., Kalman, H., Incipient motion of individual particles in horizontal particle-fluid systems: B. Theoretical analysis. Powder Tecnol-ogy, v. 192, no 3, pp. 326-338 (2009).
Rizk, F., Pneumatic conveying at optimal operation conditions and a solution of Bath’s equation. Proc Pneumotransport, 3, Bath, England, pp. 443-58 (1976).
Schade, B., Zum Übergang Sprung-Strähnen-förderung bei der Horizontalen Pneumatischen Feststoffördrung. Dissertation, University of Karlsruche (1987) apud Yi, J., Wypych, P. W., Pan, R., Minimum Conveying Velocity in Dilute-Phase Pneumatic Conveying, Powder Handling & Processing, v. 10, n. 3, pp. 255-261 (1998). Yi, J., Wypych, P. W., Pan, R., Minimum conveying
velocity in dilute-phase pneumatic conveying. Powder Handling & Processing, v. 10, n. 3, pp. 255-261 (1998).