ARTIGO ORIGINAL
Comparing the Performance of the SF-6D
and the EQ-5D in Different Patient Groups
Comparação do Desempenho do SF-6D e do EQ-5D em Diferentes Grupos
de Doentes
1. Escola Superior de Gestão, Hotelaria e Turismo. Universidade do Algarve. Faro. Portugal. 2. Faculdade de Economia. Universidade de Coimbra. Coimbra. Portugal.
3. Centro de Estudos e Investigação em Saúde. Universidade de Coimbra. Coimbra. Portugal. 4. Centro de Investigação sobre o Espaço e as Organizações. Universidade do Algarve. Faro. Portugal. Recebido: 12 de Maio de 2013 - Aceite: 17 de Fevereiro de 2014 | Copyright © Ordem dos Médicos 2014
Lara N. FERREIRA1,3, Pedro L. FERREIRA2,3, Luis N. PEREIRA1,4
Acta Med Port 2014 Mar-Apr;27(2):236-245
RESUMO
Introdução: O objectivo geral deste artigo consiste em comparar o desempenho do EQ-5D e do SF-6D em quatro grupos de doentes
que sofrem de asma, doença pulmonar obstrutiva crónica, cataratas e artrite reumatóide. Em particular, este artigo tem dois objectivos específicos: 1) estudar o nível de concordância entre os índices e os sistemas descritivos das dimensões do SF-6D e EQ-5D, e 2) analisar a capacidade de discriminação dos instrumentos.
Material e Métodos: Uma amostra de 643 doentes respondeu ao SF-36v2 e ao EQ-5D. Foram analisados a capacidade de
discrimi-nação dos instrumentos, bem como o nível de concordância entre os índices e os sistemas descritivos das dimensões do SF-6D e EQ-5D. O nível de concordância entre os instrumentos foi estudado com base em coeficientes de correlação e nos gráficos de Bland-Altman, enquanto a influência da condição médica e de outras variáveis de natureza sociodemográfica nos índices foi analisada com o recurso a testes não paramétricos. Utilizaram-se também testes para amostras emparelhadas para identificar diferenças entre os scores finais dos instrumentos.
Resultados e Discussão: Verificou-se a existência de uma correlação forte e de uma concordância elevada entre os dois índices. Em
termos globais, os índices diferem por condição médica e por grupo sociodemográfico e ambos os instrumentos demonstraram uma capacidade discriminativa semelhante entre grupos sociodemográficos
Conclusão: Confirmou-se a hipótese de que o SF-6D gera valores de utilidade superiores em populações com doenças. O SF-6D
e o EQ-5D parecem comportar-se de forma diferente em cada uma das doenças analisadas, uma vez que as medidas descritivas diferem entre instrumentos e os coeficientes de correlação não são uniformes. Os resultados demonstraram que o EQ-5D e o SF-6D geram valores de utilidade diferentes, mas que existe uma concordância elevada entre os dois instrumentos. Pode-se concluir que os resultados dos instrumentos não são directamente comparáveis.
Palavras-chave: Questionários; Qualidade de Vida; Indicadores Básicos de Saúde; Portugal.
ABSTRACT
Introduction: This research aims to explore the performance of the SF-6D and the EQ-5D in patients suffering from asthma, chronic
obstructive pulmonary disease, cataracts, and rheumatoid arthritis. In particular, the aim of this research is twofold: 1) to study the level of agreement between the indexes and the descriptive systems of the dimensions of the SF-6D and the EQ-5D, and 2) to analyze the discriminative ability of the instruments.
Material and Methods: A sample of 643 patients completed both the SF-36v2 and the EQ-5D. The discriminative ability of the
instru-ments was analyzed. Furthermore, the level of agreement between the indexes and the descriptive systems of the dimensions of the SF-6D and the EQ-5D were studied. The level of agreement between instruments was investigated using correlation coefficients and the Bland-Altman plots, while the influence of medical condition and other socio-demographic variables was analyzed using non-parametric tests. Paired-samples tests were used to identify differences between the scores.
Results and Discussion: The results show a strong correlation and agreement between both indexes. Overall, questionnaire indexes
differ by medical condition and socio-demographic groups and both instruments are able to discriminate between socio-demographic groups.
Conclusion: This study confirmed the hypothesis that the SF-6D generates higher utility values in less healthy individuals. The SF-6D
and the EQ-5D seem to perform differently in each of the diseases studied since the descriptive statistics differ between instruments and the level of correlation is not uniform. Results show that the instruments generate different utility values, but there is a strong agreement between both indexes. Thus, the two instruments are not interchangeable and their results cannot be directly comparable.
Keywords: Health Status Indicators; Quality of Life; Questionnaires; Portugal.
INTRODUCTION
The use of preference-based instruments for measuring health-related quality of life, such as the EQ-5D, the SF-6D or the Health Utility Index in cost-utility analyses has been increasing over the past years. These instruments are indirect methods of valuation in health, which allow the measurement of utilities and which can be used to generate Quality Adjusted Life Years. They are an alternative to direct
methods of valuation in health, such as the standard gamble and the time trade-off, which are complex, lengthy, and whose implementation is costly. In this regard, the use of the above-mentioned instruments, which are of quick and easy application, has intensified worldwide. These instruments are being applied to almost all kinds of diseases, including rheumatoid arthritis (RA),1 diabetes,2,3 asthma,4 stroke,5
35
35 ano s a p rom ov er as ciê DI CA P ORT UGUE SA 1979 - 2014ARTIGO ORIGINAL
Revista Científica da Ordem dos Médicos www.actamedicaportuguesa.com 237 anos
35
35 ano s a p rom ov er as ciê ncia s bio méd ica s A CT A MÉ DI CA PO RTUG UESA 1979 - 2014AIDS,6 psychiatric illnesses,7 chronic obstructive pulmonary
disease (COPD),8 multiple sclerosis,9 osteoporosis,10
cancer,11,12 cataracts,13 among others. There has also been
an increase in their use in measuring health-related quality of life (HRQoL) in national14-18 or regional19 populations as
well as other sub-populations of interest.
The EQ-5D is a measure of health status developed by the EuroQol Group in order to provide a simple, generic measure of health for clinical and economic appraisal. The EQ-5D is an instrument that comprises a descriptive system, wherein each one of its five dimensions has three levels, thus defining a total of 243 health states, and a visual analogue scale (VAS).20 Respondents rate their own health
by choosing an option from each of the dimensions. The VAS is designed to look like a vertical thermometer whose scale is from 0 (worst imaginable health state) to 100 (best imaginable health state). The respondents indicate which value they would assign to their health state at that moment in time.20 A sample of 3 395 individuals, representative of the
UK population, valued 42 health states through time trade-off. Then econometric models were estimated to calculate unique preference values (utilities) for all health states.21
These values, which constitute the EQ-5D utility index, vary between -0.59 and 1.00.21 The EQ-5D is the most popular
preference-based instrument worldwide, with the largest number of translations (up until February 2013, it had been translated and validated for 102 different languages, with a further 67 at the stage of being officially ratified by the EuroQol Group). It is also the instrument that has the largest number of specific weighting systems, which allow the assigning of values to each health state described by the questionnaire. By mid-2012 there were weighting systems for at least 18 countries, although none was available for Portugal at that time (the Portuguese EQ-5D value set was published in 2013).22 Recently, a new version of the
EQ-5D has been developed, with five levels in each of the five dimensions, thus generating 3 125 different health states.23
In February 2013, there were already 97 official translations for this version.
The SF-6D is an econometric preference-based index which results from the conversion of 11 items from the SF-36 into a classification system with six dimensions, each with four to six levels, allowing the generation of a total of 18,000 different health states.24 It was developed with
the aim of allowing one of the mostly widely used health profiles in the world - the SF-36 - to be used in valuations; in other words, to allow a utility to be calculated. The authors used a representative sample of 611 individuals of the UK population who assigned values to 249 health states defined by the SF-6D, through the standard gamble.24
These values permitted the estimation of econometric models, from which weights were assigned to the different levels of the SF-6D dimensions, thus generating values for all health states defined by the SF-6D. These health states values constitute an index – the SF-6D index - which can be seen as a continuous value ranging from 0.35 to 1.00.24
At a later date, an SF-6D index derived from the SF-12
was also established,24 although the former is still more
widely used. There are now specific weighting systems for the UK, Portugal,26 Japan,27 Hong-Kong,28 Spain,29 Brazil30
and Australia,31 with a value system for Singapore currently
being determined.
Since the number of preference-based instruments has been growing in recent years, and some comparative studies have identified non negligible discrepancies between different instruments, the importance of comparing the performance of the different instruments in specific patient populations has also been recognised in order to facilitate health professionals’ and researchers’ choices as to which instrument to use in their studies. At first glance, one might think that this choice would not be particularly important, as long as the instrument was based on preferences and, therefore, measured utilities. However, although these instruments all have these characteristics, many researchers have detected discrepancies in the utility values obtained by different instruments, mainly due to differences of the descriptive part of the measure. Indeed, an analysis of some of the studies published in recent years in the area of health economics and the measurement of HRQoL,32-48 including studies with a wide diversity of
populations and interventions, shows only a weak or moderate level of agreement between different preference-based instruments.
In particular, the differences observed between the values generated by the EQ-5D and by the SF-6D have recently become the focus of attention. Several studies have been published with comparisons between these two instruments.33,49,50 However, most studies have been aimed at
comparing and analysing the performance of the instruments in the context of a specific disease,36,38,40-44,46,48,51-57 or among
specific groups of people.32,37,39 Few studies have been
devoted to the comparison of the EQ-5D and the SF-6D in the general population,45,58 along with the comparison of their
performances for more than one disease.35,59 The pattern of
findings of most of these studies is that the EQ-5D tends to generate higher utility values than the SF-6D in groups with better states of health, whilst the opposite usually occurs in groups with worse health states. Furthermore, the conclusions of these studies have indicated a ceiling effect in the EQ-5D and a floor effect in the SF-6D, especially in patients with more serious illnesses.
This paper aims to make a further contribution to the study of this problem, by comparing and analysing the performance of the three-level EQ-5D and the SF-6D (derived from the SF-36) across four patient groups. The groups were defined by respiratory diseases (namely, asthma and COPD), ophthalmological disorders (cataracts) and rheumatologic illnesses (RA).
MATERIAL AND METHODS Sample
The total sample used for the study consists of 643 individuals, 115 of whom suffer from asthma, 72 from COPD, 352 from cataracts and 104 from RA. A brief description of
ARTIGO ORIGINAL
each sub-sample, as well as the form and time period of data collection follows.
Asthma - Between June 2005 and November 2006,
asthmatic patients were recruited at Faro Central Hospital by pneumologists who agreed to collaborate in the study (which had been previously approved by the Health Ethics Committee of the Hospital).4 The inclusion criteria for
recruitment were patients with a diagnosis of asthma who had given their informed consent. The individuals answered the Portuguese versions of the SF-36 v2 and the three-level EQ-5D, always following this order.
COPD - Between October 2005 and November 2006,
a group of pneumologists in Faro Central Hospital also recruited a sample of sequential patients diagnosed with COPD, who gave their informed consent to participate in the study. The selection was based on their willingness to participate in the study. The patients were asked to complete the Portuguese versions of the SF-36 v2 and the three-level EQ-5D, by this order.
Cataracts - Between April 2005 and September
2006,13,36 patients with cataracts on a waiting list to undergo
surgery were selected in two hospitals in the Algarve, Patients who agreed to participate in the study, which had been previously approved by the Ethics Committees of the hospitals concerned, gave their informed consent and then completed the Portuguese versions of the SF-36 v2 and the three-level EQ-5D. Individuals who were not able to see the words of the questionnaires were helped by a nurse, as well as illiterate patients. The order of application of the questionnaires was maintained throughout the study. Data were also collected to characterize the individuals. The questionnaires were administered immediately before surgery.
Rheumatoid arthritis - Patients with RA who participated
in the study either belonged to the Portuguese League Against Rheumatic Diseases or were patients referred by rheumatologists who agreed to cooperate in the study.1 The
Portuguese versions of the SF-36 v2 and the three-level EQ-5D were applied to a sample of 104 patients diagnosed with RA. This order of the application of the questionnaires was maintained throughout the study. Data relating to the profile of the individual respondents were also collected. The data collection took place between December 2005 and April 2006.
Data Analysis
For the characterization of the samples, descriptive analyses were carried out by calculating empirical frequency distributions and descriptive statistics for the socio-demographic variables.
Both the EQ-5D and the SF-6D indexes were calculated using the UK value sets,21,25 since although there is an
SF-6D value set for Portugal,26 there was no EQ-5D value set
when the study was carried out.
The utilities generated by the two instruments were globally analysed by medical condition and by socio-demographic group, in order to identify their discriminative capabilities. The socio-demographic variables of gender, age and educational qualifications were used, as it has often been concluded that these variables show differences in terms of health. To this end, non-parametric tests were used since distributions of the SF-6D and the EQ-5D indexes are skewed. However, it was verified that similar results and the same conclusions were obtained if parametric tests were used.
The aim of the analysis of the indexes generated by the instruments was also to identify the existence of ceiling and floor effects among the instruments (i.e. large numbers of individuals reporting, respectively, the highest and the lowest possible values). In line with others,32 it was sought
to assess the level of agreement between the instruments using correlation coefficients between the indexes (the Pearson’s r and the intraclass) and by similar dimension (the Spearman’s rho). The intraclass correlation coefficient (ICC) was based on a two-way mixed model with absolute agreement, and it was considered that a correlation greater than 0.5 would denote that the two indexes were strong correlated.60 Additionally, it was also produced the
Bland-Altman plots61 for the SF-6D and the EQ-5D by medical
condition. The difference between the SF-6D and the EQ-5D indexes (y-axis) was plotted against the average value of the two indexes (x-axis), where the difference was calculated by subtracting the EQ-5D from the SF-6D index. Thus a point below (above) the x-axis denotes that a particular individual had a utility score that was higher (lower) according to the EQ-5D. Since the cluster of points should be around the x-axis, it was calculated the 95% limits of agreement [mean of differences ± 2 (standard deviation of differences)] and the percentage of points beyond these limits.
The data analysis was performed using the IBM SPSS
Statistics (version 20) and the Stata (version 9.1) software
programmes. Differences were considered statistically significant at levels of significance of 5% and 1%.
RESULTS AND DISCUSSION
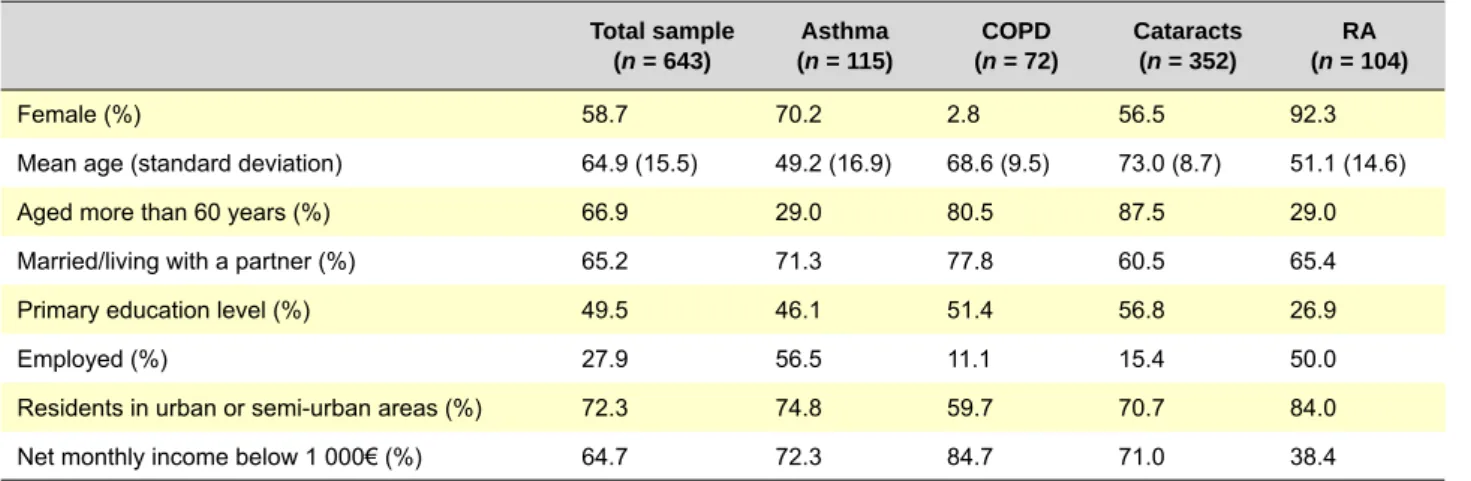
Table 1 summarizes the main characteristics of the sample, both overall and by medical condition.
Overall, the asthma and the RA sub-samples consisted mainly of fifty-year-old women, individuals who were married or living with a partner and residents in urban or semi-urban areas. The asthma sub-sample had a low level of educational qualifications, and consisted mainly of employees with unskilled or semi-skilled occupations (administrative, sales, agriculture and fisheries workers, blue-collar workers and labourers), and those with a net monthly income below 1 000€. On the contrary, individuals from the RA sub-sample had an education level higher than the primary, and consequently the majority of them earned a net income above 1 000€.
ARTIGO ORIGINAL
Revista Científica da Ordem dos Médicos www.actamedicaportuguesa.com 239
The COPD and the cataracts sub-samples consisted mainly of retired people, aged more than 60 years, married or living with a partner, residents in urban or semi-urban areas, and individuals that earned a net income above 1 000€. These sub-samples differed in what concerns
gender: almost half of the cataracts sub-sample were men whereas almost the total of the COPD sub-sample were men.
Table 2 displays the frequency distributions of individual responses to the dimensions of the SF-6D and the EQ-5D,
Table 1 – Characteristics of the total sample and by medical condition
Total sample
(n = 643) (n = 115)Asthma (n = 72)COPD Cataracts(n = 352) (n = 104)RA
Female (%) 58.7 70.2 2.8 56.5 92.3
Mean age (standard deviation) 64.9 (15.5) 49.2 (16.9) 68.6 (9.5) 73.0 (8.7) 51.1 (14.6)
Aged more than 60 years (%) 66.9 29.0 80.5 87.5 29.0
Married/living with a partner (%) 65.2 71.3 77.8 60.5 65.4
Primary education level (%) 49.5 46.1 51.4 56.8 26.9
Employed (%) 27.9 56.5 11.1 15.4 50.0
Residents in urban or semi-urban areas (%) 72.3 74.8 59.7 70.7 84.0
Net monthly income below 1 000€ (%) 64.7 72.3 84.7 71.0 38.4
COPD - chronic obstructive pulmonary disease; RA - rheumatoid arthritis.
Table 2 – Frequency distributions of individual responses to the dimensions of the EQ-5D and the SF-6D (%)
SF-6D Level PF RL SF Pa MH Vi PF RL SF Pa MH Vi Asthma COPD 1 18.3 51.3 66.1 32.2 53.9 46.1 0.0 58.3 73.6 38.9 76.4 61.1 2 27.8 31.3 14.8 7.8 33.9 29.6 25.0 36.1 9.7 5.6 18.1 23.6 3 32.2 4.3 13.0 20.0 5.2 12.2 36.1 2.8 8.3 27.8 2.8 11.1 4 14.8 13.0 4.3 25.2 6.1 8.7 29.2 2.8 5.6 19.4 2.8 1.4 5 7.0 na 1.7 14.8 0.9 3.5 5.6 na 2.8 6.9 0.0 2.8 6 0.0 na na 0.0 na na 4.2 na na 1.4 na na Cataracts RA 1 15.9 27.3 27.3 25.0 20.5 29.5 3.8 19.2 30.8 3.8 24.0 15.4 2 35.2 46.6 20.5 9.1 46.6 40.9 38.5 34.6 15.4 11.5 48.0 34.6 3 28.4 10.2 33.0 10.2 17.0 18.2 30.8 19.2 38.5 15.4 16.0 30.8 4 11.4 15.9 15.9 36.4 14.8 6.8 7.7 26.9 15.4 19.2 12.0 19.2 5 9.1 na 3.4 13.6 1.1 4.5 3.8 na 0.0 30.8 0.0 0.0 6 0.0 na na 5.7 na na 15.4 na na 19.2 na na EQ-5D Level Mo SC UA PD AD Mo SC UA PD AD Asthma COPD 1 71.3 94.8 75.7 66.1 61.7 76.4 94.4 76.4 77.8 72.2 2 28.7 5.2 24.3 33.0 37.4 23.6 4.2 20.8 22.2 26.4 3 0.0 0.0 0.0 0.9 0.9 0.0 1.4 2.8 0.0 1.4 Cataracts RA 1 62.5 89.8 62.5 30.7 38.6 46.2 65.4 38.5 15.4 23.1 2 37.5 9.1 36.4 61.3 54.6 53.8 30.8 61.5 76.9 73.1 3 0.0 1.1 1.1 8.0 6.8 0.0 3.8 0.0 7.7 3.8
Modal level is in bold; The distribution adds up to 100 by columns; Level 1 in each dimension refers to the best health state; na – not applicable; COPD - chronic obstructive pulmonary disease; RA - rheumatoid arthritis.
ARTIGO ORIGINAL by medical condition. Results presented in this table show a non-uniform frequency distribution of individual responses in both instruments across medical conditions.
The results presented in table 2 show high levels of problems in the pain dimension, mainly in RA and cataracts patients with more than 50% of respondents included in levels 4-6 of the SF-6D. Furthermore, more than 20% of respondents claimed some limitations in physical functioning (39% of COPD patients), and thus indicating a possible floor effect, which is one of the weaknesses that characterize the SF-6D.14,35,36,40,41,43,48 It is also noteworthy
that the role limitations and social functioning dimensions have non negligible percentage of individuals at the highest level (except in COPD in the case of role limitations) or at the two upper levels (in the case of social functioning). On the contrary, the results show that there is evidence of a ceiling effect in EQ-5D; that is, very few patients placed themselves at level 3 of the five dimensions. This result was expected, since (almost) all studies report that EQ-5D suffers from ceiling effect whatever the type of population (in general, healthy, suffering from specific diseases, younger, older, etc.).1,4,14,17,47,58 In fact, for the mobility, self-care and
usual activities dimensions, more than 60% of asthma, COPD and cataracts patients responded at level 1 (no limitations). Moreover, in the pain/discomfort and anxiety/ depression dimensions, more than 60% of asthma and COPD patients responded at level 1 (no limitations), and about more than half of cataracts patients and more than three quarters of RA patients responded at level 2 (some limitations). Note that no more than 8% of cataracts and RA patients responded at level 3 (severe limitations) just in the pain/discomfort and anxiety/depression dimensions. The results of the analysis of the level of agreement between the descriptive systems of the dimensions of the
instruments are shown in Table 3. Through an analysis of the correlation coefficients of similar dimensions (according to the definition used in Brazier et al35 and in Grieve et
al),54 it appears that there are moderate correlations (> 0.5)
among the following dimensions:
- Asthma: pain/discomfort and pain; pain/discomfort and vitality; usual activities and vitality;
- COPD: there are no correlations > 0.5;
- Cataracts: pain/discomfort and pain; anxiety/depression and mental health; usual activities and social functioning; anxiety/depression and vitality; pain/discomfort and vitality; - RA: pain/discomfort and pain; anxiety/depression and role limitations; mobility and physical functioning; pain/ discomfort and role limitations; usual activities and vitality. It should also be noted that despite the vitality dimension in the SF-6D not having a similar dimension explicitly included in the EQ-5D, it presents a moderate correlation with pain/discomfort, anxiety/depression and usual activities dimensions of the EQ-5D. In any event, all the correlations are far from being perfect, which can be interpreted as different discriminatory capacities in both instruments, due to the fact that variations from a given level in the dimensions of the SF-6D may not be fully captured by variations in the dimensions of EQ-5D. These results are in line with other studies in the literature.35,40,54
Table 4 presents statistics of the SF-6D and EQ-5D indexes by medical condition and socio-demographic groups.
An analysis of the first two columns of Table 4 shows that both indexes have similar and good discriminative power by medical condition, by level of problems indicated by individuals and by socio-demographic group. In fact, there were statistically significant differences between classes in each group, with the exception of age classes. These results
Table 3 – Spearman’s correlation coefficients between SF-6D and EQ-5D dimensions
SF-6D EQ-5D PF RL SF Pa MH Vi PF RL SF Pa MH Vi Asthma COPD Mo 0.413 0.245 0.412 0.219 0.210 0.305 0.334 0.245 0.207 -0.017 -0.018 0.355 SC 0.222 0.068 0.391 0.103 -0.038 0.069 0.226 0.143 0.197 0.060 -0.002 0.226 UA 0.364 0.381 0.303 0.362 0.328 0.501 0.361 0.358 0.154 0.211 0.223 0.364 PD 0.359 0.352 0.236 0.570 0.291 0.568 0.156 0.152 0.139 0.287 0.111 0.240 AD 0.269 0.294 0.229 0.302 0.461 0.491 -0.098 0.087 0.050 0.222 0.081 -0.006 Cataracts RA Mo 0.497 0.412 0.459 0.421 0.431 0.467 0.544 0.182 0.389 0.195 0.012 0.054 SC 0.281 0.241 0.383 0.297 0.427 0.286 0.109 0.139 0.136 -0.013 0.043 -0.028 UA 0.498 0.445 0.617 0.424 0.379 0.403 0.436 0.164 0.354 0.227 0.194 0.522 PD 0.403 0.308 0.369 0.770 0.520 0.521 0.458 0.526 0.430 0.722 0.179 0.364 AD 0.412 0.406 0.442 0.426 0.693 0.588 0.113 0.570 0.438 0.225 0.375 0.054
ARTIGO ORIGINAL
Revista Científica da Ordem dos Médicos www.actamedicaportuguesa.com 241 Table 4 – Statistics of the SF-6D and EQ-5D indexes by medical condition and socio-demographic groups
Mean (standard
deviation) Median Median Range Ceiling effect (%)
Pearson’s r coefficient ICC
SF-6D EQ-5D differences
a
(SF-6D -
EQ-5D) SF-6D EQ-5D SF-6D EQ-5D SF-6D EQ-5D
Medical condition Asthma 0.79 (0.14) 0.84(0.17) -0.05*** 0.80 0.85 0.45 to 1.00 -0.02 to 1.00 8.7 40.0 0.65*** 0.64*** COPD 0.81 (0.12) 0.86 (0.17) -0.02** 0.83 0.85 0.57 to 0.97 0.26 to 1.00 0.0 43.1 0.40*** 0.37*** Cataracts 0.70 (0.16) 0.69 (0.27) -0.05** 0.68 0.73 0.39 to 1.00 -0.18 to 1.00 4.5 19.3 0.64*** 0.56*** RA 0.63 (0.11) 0.61 (0.24) -0.02 0.64 0.66 0.36 to 0.85 -0.18 to 1.00 0.0 3.8 0.78*** 0.60*** pb p < 0.001 p < 0.001 N3 N3 = 0 0.74 (015) 0.79 (0.15) -0.04*** 0.71 0.75 0.39 to 1.00 0.52 to 1.00 4.5 25.6 0.74*** 0.74*** N3 = 1 0.56 (0.11) 0.09 (0.17) 0.46*** 0.58 0.12 0.36 to 0.90 -0.18 to 0.37 0.0 0.0 0.61*** 0.54*** pc p < 0.001 p < 0.001 Gender Female 0.67 (0.14) 0.64 (0.28) -0.03 0.66 0.69 0.36 to 1.00 -0.18 to 1.00 1.1 11.7 0.63*** 0.51*** Male 0.79 (0.14) 0.83 (0.16) -0.07*** 0.78 0.85 0.49 to 1.00 0.26 to 1.00 8.3 39.2 0.71*** 0.71*** pc p < 0.001 p < 0.001 Age (years) < 40 0.76 (0.15) 0.78 (0.18) 0.00 0.73 0.73 0.56 to 1.00 0.14 to 1.00 10.3 27.9 0.77*** 0.76*** 41 - 60 0.72 (0.16) 0.73 (0.27) -0.11** 0.69 0.80 0.36 to 1.00 -0.18 to 1.00 0.7 26.6 0.80*** 0.71*** + 60 0.71(015) 0.71 (0.26) -0.05*** 0.68 0.73 0.39 to 1.00 -0.18 to 1.00 4.3 21.3 0.63*** 0.54*** pb p = 0.145 p = 0.088 Education level Illiterate 0.68 (0.15) 0.66 (0.31) -0.06 0.67 0.73 0.42 to 1.00 -0.18 to 1.00 0.9 19.4 0.63*** 0.50*** Primary 0.72 (0.15) 0.73 (0.23) -0.05** 0.68 0.73 0.37 to 1.00 -0.02 to 1.00 4.1 21.4 0.66*** 0.60*** Lower Secondary 0.76 (0.16) 0.73 (0.26) -0.04 0.70 0.74 0.45 to 1.00 0.12 to 1.00 9.3 27.9 0.72*** 0.64*** Upper Secondary 0.78 (0.14) 0.78 (0.25) -0.03** 0.78 0.81 0.52 to 1.00 -0.18 to 1.00 1.9 29.7 0.67*** 0.57*** Tertiary 0.68 (0.17) 0.70 (0.27) -0.06** 0.63 0.69 0.36 to 1.00 -0.18 to 1.00 9.5 23.8 0.83*** 0.74*** pb p < 0.001 p < 0.001
aaccording to related-samples Wilcoxon signed-rank tests; baccording to Kruskal-Wallis H tests; caccording to Mann-Whitney U tests. COPD - chronic obstructive pulmonary disease;
ARTIGO ORIGINAL are similar to those found in other studies. Kontodimopoulos et al,39 for instance, reported a good discriminative ability of
the EQ-5D and the SF-6D by socio-demographic groups in individuals with different levels of health. In a similar way, Barton et al32 concluded that both instruments have a good
discriminative capacity between individuals who did or did not follow a particular medical prescription, while Fisk et al,53 Marra et al43 and Barton et al52 showed that both
the EQ-5D and SF-6D have good discriminative power regarding the severity of multiple sclerosis, RA and pain in the knees, respectively. It should, however, be noted that although Cunillera et al58 concluded that both the EQ-5D
and SF-6D show a good discriminative power by socio-demographic group and health state, the SF-6D showed less discriminative power as regards chronic physical conditions. Quercioli et al47 also found that both instruments
have similar and good capacity of discrimination by gender, by chronic diseases and by factors related to lifestyle. In addition, they found that just the EQ-5D detect some health differences between age groups.
When comparing the EQ-5D index with the SF-6D index, few statistically insignificant differences were found in terms of age and educational background, as shown in the third column of Table 4. However, differences were revealed in terms of gender, asthma, cataracts and COPD, as well as in the group in which individuals suffer from a serious problem
(N3 = 1) and in the group in which this does not occur. Similar results have been obtained by other researchers.33,39,57 In
fact, it is noteworthy that it is in the group where N3 = 1 that there is the greatest difference between the SF-6D and the EQ-5D. In addition, it can be verified by the order statistics results (fourth to seventh columns of Table 4) that only in this group is the median of the SF-6D higher than that of the EQ-5D, and that the minimum value of the SF-6D index (0.36) is approximately equal to the maximum value of the EQ-5D index (0.37). These results may be due to the fact (which is often discussed in the literature) that the SF-6D shows less discriminative power than the EQ-5D in respect to more serious health problems, and therefore tends to show higher values than the EQ-5D.39,58
The last two columns of Table 4 allow us to observe that the level of correlation between the instruments is moderate/strong and statistically significant in all classes in all of the groups considered. However, the level of correlation varies according to different medical condition and socio-demographic group. The Bland-Altman plots (Fig. 1) also indicate a strong agreement between the two instruments. Indeed, it is possible to observe that very few points are beyond the limits of agreement (asthma = 5.2%; COPD = 4.2%; cataracts = 6.8%; AR = 8.0%). It is important to note that these results are consistent with those of other studies,32,35,39,40,55 but there are studies which report a poorer
0.4 0.6 0.6 0.6 0.6 0.8 0.8 0.8 0.8 1.0 1.0 1.0 1.0
Figure 1 – Bland-Altman plots by medical condition
COPD - chronic obstructive pulmonary disease; RA - rheumatoid arthritis; UAL – upper agreement limit; LAL – lower agreement limit. Vertical axis (y-axis): Difference between SF-6D and EQ-5D indexes; Horizontal axis (x-axis): Mean of SF-6D and EQ-5D indexes
Ashtma Cataracts COPD RA 0.8 UAL = 0.28 UAL = 0.35 UAL = 0.43 UAL = 0.21 LAL = -0.38 LAL = -0.31 LAL = -0.40 LAL = -0.31 0.8 0.8 0.8 0.6 0.6 0.6 0.6 0.4 0.4 0.4 0.4 0.2 0.2 0.2 0.2 0.0 0.0 0.0 0.0 0.0 0.0 0.0 0.0 0.2 0.2 0.2 0.2 0.4 0.4 0.4 -0.2 -0.2 -0.2 -0.2 -0.4 -0.4 -0.4 -0.4
ARTIGO ORIGINAL
Revista Científica da Ordem dos Médicos www.actamedicaportuguesa.com 243
level of agreement. For example, the agreement between these two measures in populations suffering from specific diseases was higher than that observed in a population suffering from other disieases35 and in a population not
affected by specific diseases.47
Finally, the eighth and ninth columns of Table 4 present the ceiling effect by medical condition and socio-demographic groups. The ceiling effect differs considerably among the groups defined by medical condition and gender in both indexes, a finding also observed in other studies.58 However, some uniformity of the ceiling effect
in different age groups and levels of education in the EQ-5D index can be observed. However, this is not the case for the SF-6D index. It can also be noted that the ceiling effect is more pronounced in the EQ-5D index for all the groups analyzed, as has been observed in most studies using this instrument.34,45,58 One explanation for this could
lie in the descriptive system of the EQ-5D, since it has fewer dimensions and fewer levels than the SF-6D and consequently the ceiling effect is accentuated.54,62 On the
other hand, the time-period to which the instruments relate (the EQ-5D refers to the state of health ‘today’ and the SF-6D ‘in the last four weeks’) may also contribute to this result, since a longer period can allow respondents to include small effects and slight changes in their health state that might not be captured by the EQ-5D (Fig. 1).63
CONCLUSION
The use of the EQ-5D and the SF-6D in cost-utility analyses has been growing in recent years. The choice of which instrument to use can have important consequences and may lead to different results. For this reason, some researchers have focused their attention on the comparison of these two instruments. In this paper, our intention has been to make a further contribution to the study of this problem. We compared and analyzed the performance of the EQ-5D and the SF-6D (derived from the SF-36) in four patient groups.
Throughout the paper, similar analyses to those carried out by other researchers in studies comparing the measures of utilities have been presented.32,35,39,47 This approach is
justified by the implications that different utility measures may have for cost-utility analyses, which means that there is a need to further contribute to the body of evidence that, in this area, is obtained from a series of convergent experiments rather than by a single experiment.
One of the limitations of our study is due to the remarkable characteristics of the samples since they may limit the generalizability of these results for each patient group. However, the main characteristics of each sub-sample are related to the type of individuals included in the study. For instance, RA is a disease that traditionally affects more women than men, and COPD is the opposite; cataracts occur more frequently in elderly individuals. On the other hand, this limitation may only put in question the main conclusion of the paper – that EQ-5D and the SF-6D generate different utility values and that care must be taken
on choosing the instrument to use in cost-utility analysis since they may generate different results – if we were trying to prove the contrary of this. In fact, we advocate that this does not constitute a real drawback of the study given that it is sufficient to show in a particular case that the instruments generate different results to prove that that they are not the same in all cases.
From the results, we were able to confirm the hypothesis that the SF-6D and the EQ-5D showed different behaviour in each of the medical conditions analysed, since we observed that the descriptive statistics differ between instruments and the level of correlation is not uniform. Overall, the results demonstrate that the EQ-5D and the SF-6D generate different utility values, but there is a strong agreement between both indexes. Thus, the two instruments are not interchangeable and their results cannot be directly comparable, as has been argued elsewhere.32,42,47 The gap between the utility scores
obtained by these measures may be due to, at least, two reasons that may occur simultaneously. The first one is the existent difference between the descriptive systems of both measures. The dimensions are different and, even when the concepts are close, they measure different aspects. The other reason is that the differences seem to be higher for more severe diseases. So, apart from the descriptive systems, it seems more probable to obtain closer utility values from both instruments whenever the severity and the burden of illness are nearer, regardless of the diseases. In fact, in our samples of patients with asthma, COPD, cataracts and RA, we cannot assure that the distributions of the (relative) severities within each disease are similar. Therefore, a possible match between the two measures may never be linear; it has to be conditional upon the impact that a health status has on the patients’ life.
Nevertheless, in an intrinsically subjective area as the measurement of quality of life we are not dealing with exact or true measures and scores, rather with different approaches to measure the same phenomenon or the same situation.
A last question may also be raised: if we already expect that different instruments may lead to different scores when measuring the same health status, why not to accept that they also give different scores when the severity of the disease and the intensity of the impact in patients’ lives is also different?
ACKNOWLEGMENTS
We thank the anonymous reviewers for their constructive comments and suggestions which have considerably improved an earlier version of the article. We also acknowledge the medical and nursing teams from both the Barlavento Algarve Hospital Centre and the Faro Central Hospital (current the Algarve Hospital Centre) who collected the data of patients with cataracts, to pulmonologists and cardiopneumology techniques from Faro Central Hospital who collected the data of patients with asthma and COPD, to the Portuguese League Against Rheumatic Diseases and to rheumatologists and physicians that allowed the collection of data of rheumatoid arthritis.
ARTIGO ORIGINAL
CONFLICTS OF INTEREST
None stated. FUNDING SOURCES None stated for this specific work. CEISUC and CIEO are research centres funded by the Portuguese Foundation for Science and Technology (Fundação para a Ciência e a Tecnologia).
REFERENCES
1. Ferreira LN, Ferreira PL, Baleiro R. Quality of life in patients with rheumatoid arthritis. Acta Reumatol Port. 2008;33:341-2.
2. Clarke P, Gray A, Holman R. Estimating utility values for health states of type 2 diabetic patients using the EQ-5D (UKPDS 62). Med Decis Making. 2002;22:340-9.
3. Sakamaki H, Ikeda S, Ikegami N, Uchigata Y, Iwamoto Y, Origasa H, et al. Measurement of HRQL using EQ-5D in patients with type 2 diabetes mellitus in Japan. Value Health. 2006;9:47-53.
4. Ferreira LN, Brito U, Ferreira PL. Quality of life in asthma patients. Rev Port Pneumol. 2010;XVI:23-55.
5. Xie J, Wu E, Zheng Z-J, Croft J, Greenlund K, Mensah G, et al. Impact of stroke on health-related quality of life in the noninstitutionalized population in the United States. Stroke. 2006;37:2567-72.
6. Mathews W, May S. EuroQol (EQ-5D) measure of quality of life predicts mortality, emergency department utilization, and hospital discharge rates in HIV-infected adults under care. Health Qual Life Outcomes. 2007;5:5.
7. van Asselt A, Dirksen C, Arntz A, Giesen-Bloo J, Severens J. The EQ-5D: a useful quality of life measure in borderline personality disorder? Eur Psychiatry. 2009;24:79-85.
8. Ringbaek T, Brøndum, E, Martinez G, Lange P. EuroQoL in assessment of the effect of pulmonary rehabilitation COPD patients. Resp Med. 2008;102:1563-7.
9. Kobelt G, Jönsson, L, Henriksson F, Fredrikson S, Jönsson B. Cost-utility analysis of interferon beta-1b in secondary progressive multiple sclerosis. Int J Technol Assess Health Care. 2000;16:768-80.
10. Borgström F, Zethraeus N, Johnell O, Lidgren L, Ponzer S, Svensson O, et al. Costs and quality of life associated with osteoporosis-related fractures in Sweden. Osteoporosis Int. 2006;17:637-50.
11. Cella D, Michaelson M, Bushmakin A, Cappelleri J, Charbonneau C, Kim S, et al. Health-related quality of life in patients with metastatic renal cell carcinoma treated with sunitinib vs interferon-a in a phase III trial: final results and geographical analysis. Br J Cancer. 2010;102:658–64. 12. Grutters J, Joore M, Wiegman E, Langendijk J, Ruysscher D,
Hochstenbag M, et al. Health-related quality of life in patients surviving non-small cell lung cancer. Thorax 2010;65:903-7.
13. Ferreira LN, Ferreira P. Quality of life in patients with cataracts. Oftalmologia. 2008;32:159-75.
14. Ferreira LN, Ferreira PL, Pereira LN, Brazier J. An application of the SF-6D to create health values in Portuguese working age adults. J Med Econ. 2008;11:215-33.
15. Hoeymans N, Lindert H, Westert G. The health status of the Dutch population as assessed by the EQ-6D. Qual Life Res. 2005;14:655-63. 16. Johnson J, Coons S, Ergo A, Szava-Kovats G. Valuation of EuroQol
(EQ-5D) health states in an adult US sample. Pharmacoeconomics. 1998;13:421-33.
17. Sun S, Chen, J, Johannesson M, Kind P, Xu L, Zhang Y, et al. Population health status in China: EQ-5D results, by age, sex and socio-economic status, from the National Health Services Survey 2008. Qual Life Res. 2011;20:309-20.
18. Szende A, Williams A. Measuring self-reported population health: an international perspective based on EQ-5D. Budapest: SpringMed Publishing; 2004.
19. Badia X, Schiaffino A, Alonso J, Herdman M. Using the EuroQol 5-D in the Catalan general population: feasibility and construct validity. Qual Life Res. 1998;7:311-22.
20. Rabin R, Charro F, Szende A. Introduction. In EQ-5D value sets – inventory, comparative review and user guide. Szende A, Oppe M, Devlin N, editors. New York: Springer EuroQol Group Monographs; 2007. p.13-9.
21. Dolan P. Modelling valuations for EuroQol health states. Med Care. 1997;35:1095-108.
22. Ferreira LN, Ferreira PL, Pereira LN, Oppe M. The valuation of the EQ-5D in Portugal. Qual Life Res. 2014; 23:413-23.
23. Herdman M, Gudex C, Lloyd A, Janssen M, Kind P, Parkin D, et al.
Development and preliminary testing of the new five-level version of EQ-5D (EQ-EQ-5D-5L). Qual Life Res. 2011;20:1727-36.
24. Brazier J, Roberts J, Deverill M. The estimation of a preference-based measure of health from the SF-36. J Health Econ. 2002;21:271-92. 25. Brazier J, Roberts J. The estimation of a Preference-Based Measure of
Health from the SF-12. Med Care. 2004;42:851-9.
26. Ferreira L, Ferreira P, Pereira L, Brazier J, Rowen, D. A Portuguese value set for the SF-6D. Value Health. 2010;13:624-630.
27. Brazier J, Fukahara S, Roberts J, Kharroubi S, Yamamoto Y, Ikeda S, et al. Estimating a preference-based index from the Japanese SF-36. J Clin Epidemiol. 2009;62:1323-31.
28. Lam C, Brazier J, McGhee S Valuation of the SF-6D health states is feasible, acceptable, reliable, and valid in a Chinese population. Value Health. 2008;11:295–303.
29. Abellán Perpiñán JM, Sánchez Martínez FI, Martínez Pérez JE, Mendez I. Lowering the “floor” of the SF-6D scoring algorithm using a lottery equivalent method. Health Econ. 2012;21:1271-85.
30. Cruz L, Camey S, Hoffmann J, Rowen D, Brazier J, Fleck M, et al. Estimating the SF-6D value set for a population-based sample of Brazilians. Value Health. 2011;14:S108-114.
31. Norman R, Viney R, Brazier J, Burgess L, Cronin P, King M, et al. Valuing SF-6D health states using a discrete choice experiment. Med Decis Making. 2013 (in press).
32. Barton G, Sach T, Avery A, Jenkinson C, Doherty M, Whynes D, et al. A comparison of the performance of the EQ-5D and SF-6D for individuals aged >= 45 years. Health Econ. 2008;17:815-32.
33. Barton G, Sach T, Doherty M, Avery A, Jenkinson C, Muir K. An assessment of the discriminative ability of the EQ-5Dindex, SF-6D, and EQ VAS, using sociodemographic and clinical conditions. Eur J Health Econ. 2008;9:237-49.
34. Bharmal M, Thomas J. Comparing the EQ-5D and the SF-6D descriptive systems to assess their ceiling effects in the US general population. Value Health. 2006;9:262-71.
35. Brazier J, Roberts, J, Tsuchiya A, Busschbach J. A comparison of the EQ-5D and SF-6D across seven patient groups. Health Econ. 2004;13:873-84.
36. Ferreira PN, Ferreira PL, Pereira LN. How consistent are health utility values? Qual Life Res. 2008;17:1031-42.
37. Gerard K, Nicholson T, Mulle M, Mehta R, Roderick P. EQ-5D versus SF-6D in an older, chronically ill patient group. Appl Health Econ Health Policy. 2004;3:91-102.
38. Kontodimopoulos N, Pappa E, Chadjiapostolou Z, Arvanitaki E, Papadopoulos A, Niakas D. Comparing the sensitivity of EQ-5D, SF-6D and 15D utilities to the specific effect of diabetic complications. Eur J Health Econ. 20012;12:383-91.
39. Kontodimopoulos N, Pappa E, Papadopoulos A, Tountas Y, Niakas D. Comparing SF-6D and EQ-5D utilities across groups differing in health status. Qual Life Res. 2009;18:87-97.
40. Lamers L, Bouwmans C, van Straten A, Donker M, Hakkaart L. Comparison of EQ-5D and SF-6D utilities in mental health patients. Health Econ. 2006;15:1229-36.
41. Longworth L, Bryan S. An empirical comparison of EQ-5D and SF-6D in liver transplant patients. Health Econ. 2003;12:1061-7.
42. Marra C, Esdaile J, Guh D, Kopec J, Brazier J, Koehler B, et al. A comparison of four indirect methods of assessing utility values in rheumatoid arthritis. Med Care. 2004;42:1125-31.
43. Marra C, Woolcott J, Kopec J, Shojania K, Offer R, Brazier J, et al. A comparison of generic, indirect utility measures (the HUI2, HUI3, SF-6D, and the EQ-5D) and disease-specific instruments (the RAQoL and The HAQ) in rheumatoid arthritis. Soc Sci Med. 2005;60:1571-82.
44. McTaggart-Cowan H, Marra C, Yang Y, Brazier J, Kopec J, FitzGerald J, et al. The validity of generic and condition-specific preference-based instruments: the ability to discriminate asthma control status. Qual Life Res. 2008;17:453-62.
ARTIGO ORIGINAL
Revista Científica da Ordem dos Médicos www.actamedicaportuguesa.com 245
EQ-5D and SF-6D based on hypothetical preferences in a general population. Health Econ. 2005;14:1169-89.
46. Pickard A, Simon J, Jeffrey A, Feeny D. Responsiveness of generic health-related quality of life in stroke. Qual Life Res. 2005;14:207-19. 47. Quercioli C, Messina G, Barbini E, Carriero G, Fanì M, Nante N.
Importance of sociodemographic and morbidity aspects in measuring health-related quality of life: performances of three tools. Comparison of three questionnaire scores. Eur J Health Econ. 2009;10:389–97. 48. Stavem K, Frøland S, Hellum K. Comparison of preference-based
utilities of the 15D, EQ-5D and SF-6D in patients with HIV/AIDS. Qual Life Res. 2005;14:971-80.
49. Tsuchiya A, Brazier J, Roberts J. Comparison of valuation methods used to generate the EQ-5D and the SF-6D value sets. J Health Econ. 2006;25:334-46.
50. Konerding U, Moock J, Kohlmann T. The classification systems of the EQ-5D, the HUI II and the SF-6D: what do they have in common? Qual Life Res. 2009;18:1249-61.
51. Adams R, Walsh C, Veale D, Bresnihan B, FitzGerald O, Barry M. Understanding the relationship between the EQ-5D, SF-6D HAQ and disease activity in inflammatory arthritis. Pharmacoeconomics. 2010;28:477-87.
52. Barton G, Sach T, Avery A, Doherty M, Jenkinson C, Muir K. Comparing the performance of the EQ-5D and SF-6D when measuring the benefits of alleviating knee pain. Cost Eff Resour Alloc. 2009;7:12.
53. Fisk J, Brown M, Sketris I, Metz L, Murray T, Stadnyk K. A comparison of health utility measures for the evaluation of multiple sclerosis treatments. J Neurol Neurosurg Psychiatry. 2005;76:58-63.
54. Grieve R, Grishchenko M, Cairns J. SF-6D versus EQ-5D: reasons for differences in utility scores and impact on reported cost-utility. Eur J Health Econ. 2009;10:15-23.
55. Goodwin P, Ratcliffe J, Morris J, Morrissey M. Using the knee-specific Hughston Clinic Questionnaire, EQ-5D and SF-6D following arthroscopic partial meniscectomy surgery: a comparison of psychometric properties. Qual Life Res. 2011;20:1437-46.
56. Harrison MJ, Davies LM, Bansback NJ, McCoy MJ, Verstappen SM, Watson K, et al. The comparative responsiveness of the EQ-5D and SF-6D to change in patients with inflammatory arthritis. Qual Life Res. 2009;18:1195-205.
57. Szende A, Svensson K, Ståhl E, Mészáros A, Berta G. Psychometric and utility-based measures of health status of asthmatic patients with different disease control level. Pharmacoeconomics. 2004;22:537-47. 58. Cunillera O, Tresserras R, Rajmil L, Vilagut G, Brugulat P, Herdman
M, et al. Discriminative capacity of the EQ-5D, SF-6D, and SF-12 as measures of health status in population health survey. Qual Life Res. 2010;19:853–64.
59. Szende A, Leidy N, Ståhl E, Svensson K. Estimating health utilities in patients with asthma and COPD: evidence on the performance of EQ-5D and SF-6D. Qual Life Res. 2009;18;267-72.
60. Guyatt GH, Berman LB, Townsend M, Pugsley SO, Chambers LW. A measure of quality of life for clinical trials in chronic lung disease. Thorax. 1987;42:773-8.
61. Bland JM, Altman DG. Statistical methods for assessing agreement between two methods of clinical measurement. Lancet. 1986;327:307– 10.
62. Bryan S, Longworth L. Measuring health-related utility: Why the disparity between EQ-5D and SF-6D? Eur J Health Econ. 2005;50:253-60. 63. Bansback N, Sun H, Guh D, Li X, Nosyk B, Griffin S, et al. Impact of the
recall period on measuring health utilities for acute events. Health Econ. 2008;17:1413-9.