> REPLACE THIS LINE WITH YOUR PAPER IDENTIFICATION NUMBER (DOUBLE-CLICK HERE TO EDIT) < 1
Abstract— RSOA is considered a strong candidate to play an important role in realizing the next generation WDM PON, based on the wavelength reuse concept. Therefore, accurate and efficient modeling of RSOA is of significant importance.
We present a time-domain wideband model for simulation of spatial and temporal distribution of photons and carriers in a bulk RSOA. A trade-off between the accuracy and the computational efficiency of the model is studied. Multi-objective genetic algorithm is utilized for parameter extraction. Experimental validation has been performed for continuous wave input, NRZ and QPSK signaling pulses up to 40 Gb/s of bit rate, in both amplification and remodulation regimes. Saturation, noise, chirp and signal broadening are successfully predicted, while reducing the computational time compared to other wideband models.
Index Terms—modeling, optical communications, QPSK, reflective semiconductor optical amplifiers, remodulation.
I. INTRODUCTION
EFLECTIVE semiconductor optical amplifiers (RSOA) have drawn considerable attention in recent years, especially for their feasibility in cost and complexity sensitive broadband access solutions [1,2]. In particular, wavelength division multiplexing passive optical network (WDM PON) technology increasingly relies on the colorless optical network unit (ONU) concept, often based on carrier regeneration and remodulation by means of RSOA [3-5]. Moreover, RSOA has been recently used in coherent scenarios, for generation of advanced phase shift keying modulation formats [6,7]. Accurate and computationally efficient modeling for the device can thus be an important asset in efforts of defining the conditions for feasibility of such scenarios.
Upon its propagation through RSOA waveguide structure, a signal is subjected to dynamic effects that can be somewhat expected to be similar to those in a conventional semiconductor optical amplifier (SOA). However, fiber-to-
Manuscript received December 1, 2012. This work was supported by FCT/POSI through the TOMAR-PON project, as well as under contract SFRH/BD/71691/2010.
Z. Vujicic, A. Shahpari, N. B. Pavlovic and A. Teixeira are with the Instituto de Telecomunicações, University of Aveiro, Aveiro, 3810-193 Portugal (phone: 00-351-234-377-900; fax: 00-351-234-377-901; e-mail: zvujicic@av.it.pt; ali@av.it.pt; natasa@av.it.pt; teixeira@av.it.pt).
R. P. Dionísio is with the Department of Electronics and Telecommunications, Castelo Branco Polytechnic Institute, Castelo Branco, 6000-767 Portugal (e-mail: rdionisio@ipcb.pt).
fiber optical gain, noise figure (NF) and saturation characteristics of RSOA can be quite different in comparison. In describing those effects one can therefore not fully rely on well described numerical models for SOA, as the effects of counter-propagation will considerably affect the longitudinal distribution of photon and carrier densities. Furthermore, pulse propagation effects ought to be systematically studied by using dynamic modeling, rather than steady-state one [8], since RSOA is no longer employed at relatively low remodulation bitrates (i.e. 1 Gb/s or less) due to novel solutions for overcoming its limited modulation bandwidth [4,5]. Experimentally verified theoretical investigation of pulse propagation dynamics in RSOA has been recently reported [9]. However, it is of interest to provide a more general modeling including the noise contribution, supported by a more diverse experimental validation for both static and dynamic properties and their implications in a system oriented analysis. Furthermore, a model taking into account dynamic aspects of the device and providing the experimental validation for advanced modulation formats as input signals is yet to be reported in the literature. Namely, one of the ultimate goals of such modeling is in perusing advanced solutions (network architecture, modulation formats, etc.) for higher transmission capacity-distance performance of multi-gigabit broadband WDM PON systems.
We hereby present a wideband dynamic model for numerical analysis of spatial-temporal distribution of photons and carriers in RSOA. We adopt amplified spontaneous emission (ASE) modeling approach that allows us to consider both the aspects of computational efficiency and accuracy. Particular attention is paid to the parameter extraction of the actual commercial device, by using the multi-objective genetic algorithm. We experimentally validate the model for static gain and noise characteristics, as well as for propagation effects imposed on non-return to zero on-off keying (NRZ-OOK) and coherent detection quadrature phase shift keying (QPSK) signaling pulses, employed at up to 40 Gb/s bit rate. We perform qualitative experimental evaluation of model remodulation-regime performance, by employing 1.25 Gb/s NRZ format remodulation of 10 Gb/s NRZ and QPSK input signals.
The paper is organized as follows. In section II, we present in detail the theoretical formulation of the RSOA modeling. Section III presents the experimental verification along with the parameter extraction method, and the discussion of the
Efficient Dynamic Modeling of Reflective
Semiconductor Optical Amplifier
Zoran Vujicic, Rogerio P. Dionísio, Senior Member, IEEE, Ali Shahpari, Natasa B. Pavlovic and
Antonio Teixeira, Member, IEEE
obtained results. Finally, in Section IV, we stress the main conclusions.
II. RSOA MODEL
RSOA model at hand is based on rate equations for carrier and photon interaction dynamics [10], steaming from the injection and recombination dynamics, and being further affected by the dynamics of forward and backward signal and ASE photon rates. The behavior of a commercial bulk InGaAsP active material RSOA is modeled by using point-by-point time-space matrix calculation, taking into account photon and carrier density longitudinal nonuniformity as well as the temporal dynamics of both input signal and carrier injection. Signal and ASE optical fields are considered through the travelling wave equations. The treatment of ASE in this work is somewhat similar to [8], however, it is based on the equivalent ASE bandwidth calculation to estimate the overall ASE contribution to the carrier density recombination rate.
A. Spatial-temporal RSOA Sectioning
Signal pulses are amplified as they propagate in both forward and backward direction, due to the retro-reflective design of RSOA. The amplification of both counter-propagating signals thus depends on the optical field of each of them, as well as on carrier dynamics. The carrier and photon density rates in RSOA, at a given input signal wavelength λi and a single polarization state, are treated coherently by using the following rate equations:
2 3 g 2 j i tot tot
nrad rad aug
m tot tot m ase sig (z,t) (z,t)+ (z,t)+ (z,t) K+1 1+ j=11+ n( z ,t ) I v ( z ,t ) A n B n C n t qV g (λ ,z,t) g (λ ,z,t) E (z,t) S (z,t) εS (z,t) +2 εS (z,t) - -∂ = ∂ ⋅ ⋅ ×
∑
(1.1) g g i N t o t i s i g s i g m s i g E ( z,t ) E ( z,t ) 1 v ( z,t ) v ( z,t ) t z 2 g ( ,z,t ) (1 j ) ( z,t ) ( z,t ) 1 + ε S ( z , t ) E ± ± ± ∂ ∂ ± = ∂ ∂ − − × α Γ λ α (1.2) j j g g i s p a se a s e m j a s e j j to t , , 1 W H S ( z,t ) S ( z,t ) v ( z,t ) v ( z,t ) t z g ( ,z,t ) S ( z,t ) R ( z,t ) 1 S ( z,t ) ( z,t ) , , ± ± ± ∂ ∂ ± ⋅ = ∂ ∂ − + + × λ λ λ λ λ Γ α ε (1.3)where z and t are spatial and temporal coordinates, respectively. n(z,t) denotes carrier density, while Esig± ( , )z t
and Sase± ( , )z t represent the forward and backward propagating signal optical field and spontaneous emission photon density, respectively. tot( , ) tot( , )2 tot( , )
sig ase
z t E z t z t
S = +S is the total photon density at specified temporal and spatial coordinates.
( , ) ( , ) ( , )
tot
sig z t sig z t sig z t
E =E+ +E− is the total signal optical field, whereas Sasetot ( , )z t =Sase+ ( , )z t +Sase− ( , )z t represents the total noise photon density.
Carrier density dynamics is described through Eq. (1.1).
The rate of carrier density injection into the active region is given by I(z,t)/qV, where I(z,t) is the injection current, q is the elementary charge and V is the active region volume. W, H and L represent the width, height and length of RSOA active region, respectively. Γ denotes the confinement factor, representing the portion of photons that reside in the semiconductor active region volume and actually contribute to the RSOA gain. In our consideration, the modulation current I(z, t) is assumed to be uniformly distributed over the width of the active region, and independent of spatial coordinate z (i.e. travelling-wave). In addition, we hereby neglect current leakage, thus assuming maximum internal quantum efficiency of RSOA.
The second term of the right hand side of the carrier rate equation (1.1) accounts for carrier recombination, occurring due to various effects, explained in the following. The dominant radiative recombination (i.e. in which carrier recombination contributes to the amplifier gain) occurs due to bimolecular mechanism, accounted for through the corresponding coefficient Brad. The considered nonradiative carrier recombination mechanisms, known to have a significant impact on the behavior of a semiconductor device [10], are: linear nonradiative recombination, occurring due to the existence of defects in the active region, considered through Anrad, and the Auger recombination proportional to factor Caug.
The last term of the right hand side of Eq. (1.1) is due to depletion of carriers by the amplified signal and noise photon densities. Factor two in the last term of the right hand side of Eq. (1.1) is added due to the fact that spontaneous emission occurs equally likely in both orthogonal polarization states (TM/TE).
Signal and noise photon dynamics are considered through travelling-wave Eq. (1.2) and Eq. (1.3), respectively. ASE is considered at frequencies λj, i ϵ j = {1...K+1}, in a way that will be clarified in the following. The complex optical fields are normalized such that their square modulus represents the signal photon density. The experimentally measured optical power P will thereafter be related to the photon density S through the expression:
( , ) ( , ) i g z t z t P =S cWHv λ ℏ (2) where λi is the signal wavelength, and ћ is the normalized Planck constant. vg = c/ng is the group velocity of the optical field, c being the speed of light while ng denotes the active region refractive index. Hereby we account for the refractive index variation induced by the carrier injection into the waveguide. For the values of carrier density found in standard and reflective SOA devices based on InGaAsP active region, typically higher than 1024 m-3, change in refractive index versus carrier density can be approximated as a linear function [11]. Therefore, we hereby adopt the same approach, expressing the active region refractive index as
g eq g
n ( n,z,t ) n=
+
n( z,t ) dn ( n,z,t ) dn( z,t )⋅ , where neq is the equivalent refractive index without carrier injection and> REPLACE THIS LINE WITH YOUR PAPER IDENTIFICATION NUMBER (DOUBLE-CLICK HERE TO EDIT) < 3
g
dn ( z ,t ) dn( z ,t )accounts for the refractive index change due to the carrier density variations. The linewidth enhancement factor is thereafter directly calculated through the ratio between the differential of the refractive index caused by carrier injection, and the differential modal gain [12]:
4 eff N m n n g n ∂ ∂ π α = − λ ∂Γ ∂ (3)
The internal material loss coefficient, αi(z,t), is modeled as carrier density-dependent αi(z,t) = K0 + K1· n(z,t), where K0 and K1 account for the intrinsic semiconductor loss and the semiconductor loss steaming from intervalence band absorption, respectively [8].
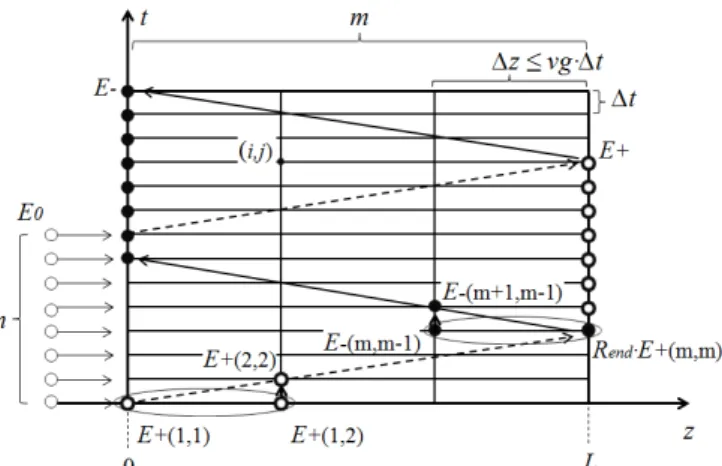
Fig. 1 depicts the numerical methodology adopted for solving the set of coupled differential Eq. (1.1-3).
Fig. 1. Longitudinal and temporal sectioning of RSOA for point-by-point calculation matrix.
The spatial and temporal derivatives are computed by using the forward and backward Euler approximation, such that:
( , ) ( , ) ( , ) ( , ) ( , ) ( , ) E i t j z E i t j z z E z z E i t j z z E i t j z E z z E i t t j z E i t j z E t t + + + − − − ± ± ± ∆ ∆ − ∆ ∆ −∆ ∂ = ∂ ∆ ∆ ∆ +∆ − ∆ ∆ ∂ = ∂ ∆ ∆ +∆ ∆ − ∆ ∆ ∂ = ∂ ∆ (4)
where i and j denote the temporal and the spatial coordinates in the numerical matrix, respectively, whereas ∆t and ∆z are the corresponding numerical step sizes. The Euler method was elected over more advanced propagation algorithms, such as the Runge-Kutta and the Bulirsch–Stoer method, since most of them would not deal with the stiffness of the numerical problem considerably better, but would decrease its computational efficiency. Instead, we aimed at adopting the numerical step that would provide stability and small truncation error, while not increasing the order of the numerical method. The spatial step ∆z is set as a lower integer of product vg·∆t, emulating signal propagation along the matrix diagonal, so that the photon density per time step per space step represents the travelling wave photon density flow. In this way, the amplification will only occur along the
direction of signal propagation, governed by its group velocity, and the interaction between the forward and backward waves will commence when the forward signal reaches the reflective end of the structure. Upon the examination of the accuracy and stability of the numerical solution for a wide range of input parameters, the optimal time-step was determined to be 0.1 ps, which yielded the spatial step of 10 µm. These numerical steps were thus adopted in all further calculations. The boundary conditions for the set of Eq. (1.1-3) are governed by the reflectivity of the high - reflection coating, which is assumed to be Rend = 0.99.
B. Material Gain Model
The phenomenological model for the semiconductor gain, which approximates gain as a linear dependency on the carrier density, is quite straight-forward [13]. However, it is limited to a specific range of carrier density, and thus might be suitable solely under small-signal conditions. Instead, the semiconductor material gain considered in this work relies on density-matrix and perturbation theory formalisms for derivation of complex susceptibility and nonlinear gain of a direct-gap bulk material active region [14]. The model accounts for the band-gap shrinkage as a result of carrier injection, and the light- and heavy-hole band transitions. Following this approach, the material gain coefficient at a given signal wavelength is obtained as [8,14]:
3 2 2 3 2 0 ( , ) ( ) 4 2 ( ) ( ( ) ( )) 2 m g g c v e hh e hh eq g n E E n c f f h m m n m m = + − ∆ × − − ℏ λ λ π τ λ λ λ (5)
where me is the electron effective mass in the conduction band, while mhh stands for the heavy hole effective mass in the valence band. fc(λ) and fv(λ) are Fermi-Dirac probability distributions for conduction and valence bands, respectively, calculated by using the Nilsson approximation for Quasi-Fermi levels [15]. τ denotes the carrier lifetime, expressed through 1/τ = Anrad+Brad·n+Caug·n2. The band-gap energy for no carrier injection, Eg0, is approximated as a quadratic function Eg0 = e(a+by+cy2), where y is the factor related to the semiconductor material composition for the active region. ∆Eg(n) is the band-gap shrinkage due to injection, calculated as ∆Eg(n) = eKgn3/2, where Kg is the band-gap shrinkage coefficient [16]. Another clear advantage of the quantum mechanical gain model is that Eq.(6) can be expressed in terms of the stimulated emission and absorption coefficients: gm=Est - Ea [14], needed for accurate inversion and noise figure prediction [17]. The nonlinear gain compression is accounted for through factor ε. The semiconductor parameters used for gain calculation are chosen for the typically employed In1-xGaxAsyP1-y active region compound, presented in Table I.
C. Amplified Spontaneous Emission Model
Theoretical treatment of ASE is essential for accurate prediction of NF and gain saturation characteristics of RSOA. In specific, RSOA typically employed in WDM PON ONUs is
fabricated to satisfy demands for high saturation gain, occurring at sufficiently low input powers. In this region of interest, signal-to-noise ratio is low enough to allow noise photon density to govern the saturation properties of the device. For this reason, the effect of ASE needs to be considered carefully, especially for applicatio
PON scenario.
Due to the random nature of its phase, ASE is hereby treated incoherently, by adopting the quantum
approach of calculating ASE photon density. The noise photon density is described through travelling-wave rate
Signal and noise photons both deplete the carrier population, at the rate described by the last term of the right
the Eq. (1.1), affecting each other through the process of carrier recombination. Furthermore, the inclusion of additional modes in the spontaneous emission process,
increase of the injection level and resulting in ASE spectrum broadening, must also be accounted for through the dependency on carrier density. ASE modeling in this work accounts for these effects through calculation of total wideband ASE dependency on carrier density. It is based on the adaptive equivalent ASE bandwidth calculation that aims at computing the overall recombination rate occurring due to ASE.
Firstly, the population inversion factor of the
expressed in terms of net stimulated emission and absorption rates, by using the expression [10]:
( , ) ( , ) ( , )-st i m n sp E n n g n λ = Γ λ Γ λ α ,
Further, the generation of spontaneously emitted photons in RSOA in Eq. (1.3) is governed by the spontaneous emiss rate per unit distance Rsp (s-1m-1). By solving Eq. (1.3) for the steady-state case (∂Sase/∂t = 0) and unsaturated gain (n(z) = const.), and relating the result to the quantum mechanical expression for the white noise photon density [18], we obtain the expression for Rsp:
( )
( , , ) , , j , {1... }
sp j st j ase
R λ z t =ΓE λ z t B j= K
where Est denotes the stimulated absorption coefficient computed from Eq. (6), whereas Bjase represents the equivalent noise bandwidth around a specific wavelength
the stimulated absorption and emission rates can be assumed to be quasi-constant. The semiconductor gain is spectrally sliced into K equivalent ASE slots around their corresponding wavelengths λj, having all ASE wavelengths that contribute to the carrier recombination at the specific carrier density level fall into one of the spectral slices. Equivalent bandwidths are computed for each value of the carrier density, in accordance to the gain flatness around the wavelengths at hand and providing that the area under the gain curve equals that of its equivalent slot. The concept of equivalent bandwidth calculation, presented for one half of the gain spectrum clarity, is depicted in Fig. 2. A simple procedure computes the equivalent bandwidths for K contributing ASE wavelengths, at a given carrier density n'. The overall ASE contribution for the fabricated to satisfy demands for high saturation gain, ow input powers. In this region of noise ratio is low enough to allow noise photon density to govern the saturation properties of the device. For this reason, the effect of ASE needs to be considered carefully, especially for applications in WDM Due to the random nature of its phase, ASE is hereby treated incoherently, by adopting the quantum-mechanical approach of calculating ASE photon density. The noise photon wave rate Eq. (1.3). Signal and noise photons both deplete the carrier population, at the rate described by the last term of the right-hand side of (1.1), affecting each other through the process of carrier recombination. Furthermore, the inclusion of additional in the spontaneous emission process, following the increase of the injection level and resulting in ASE spectrum broadening, must also be accounted for through the dependency on carrier density. ASE modeling in this work calculation of total wideband ASE dependency on carrier density. It is based on the adaptive equivalent ASE bandwidth calculation that aims at computing the overall recombination rate occurring due to Firstly, the population inversion factor of the device is expressed in terms of net stimulated emission and absorption
(6) Further, the generation of spontaneously emitted photons in RSOA in Eq. (1.3) is governed by the spontaneous emission ). By solving Eq. (1.3) for the 0) and unsaturated gain const.), and relating the result to the quantum mechanical expression for the white noise photon density [18],
( , ) , , , {1... }
R z t B j K (7)
stimulated absorption coefficient represents the equivalent noise bandwidth around a specific wavelength λj, over which the stimulated absorption and emission rates can be assumed constant. The semiconductor gain is spectrally equivalent ASE slots around their corresponding , having all ASE wavelengths that contribute to the carrier recombination at the specific carrier density level fall into one of the spectral slices. Equivalent bandwidths Bjase are computed for each value of the carrier density, in accordance to the gain flatness around the wavelengths at hand iding that the area under the gain curve equals that of its equivalent slot. The concept of equivalent bandwidth calculation, presented for one half of the gain spectrum for A simple procedure computes the contributing ASE wavelengths, at The overall ASE contribution for the
next value of carrier density
is considered with the initial value of the total ASE contribution in the previous one (
material gain peak shifts towards lower wavelengths for higher carrier densities, the contribution of lower wavelengths is included in the overall ASE induced carrier recombination rate.
Fig. 2. Concept of adaptive equivalent ASE bandwidth calculation. On the other hand, the noise power at the signal wavelength, λj = λi, is treated through a separate equation (Eq. (1.3)), with the corresponding equivalent bandwidth equal to the free spectral range of the device [8]. This assures maximum accuracy for the prediction of the ASE output power at λj. In the light of the aforementioned, the model does not focus on predicting the ASE spectrum in a single simulation cycle, but rather on deriving
wideband ASE has on signal power and NF at the observed signal wavelength λj. Thereafter, the NF can be calculated by using the semi-classical approach of cascading amplifiers [19]. The amplifier inversion factor is calculated by us
(6), and RSOA NF is thereafter calculated by using the NF cascading formula, assuming uniform inversion along a single longitudinal section of the device [20].
Fig. 3. Normalized mean square error (left) and computation time (right) versus the number of ASE spectral slices
presented in Table I. Upper limit for
Given that even the anti-reflection coating is subject to the Snell's law, we assumed 1% reflectance at the near end of RSOA. Thus, the initial value for the ASE photon density is considered to be equal to 1% of the output noise power calculated for the case of no input signal, and considered at the specific wavelength and bias current.
Since the material gain is assumed to be quasi
within equivalent ASE bandwidths, it is clear that the number next value of carrier density n'' (i.e. next computing iteration) is considered with the initial value of the total ASE
s one (n'). In this way, as the material gain peak shifts towards lower wavelengths for higher carrier densities, the contribution of lower wavelengths is included in the overall ASE induced carrier recombination
Fig. 2. Concept of adaptive equivalent ASE bandwidth calculation. On the other hand, the noise power at the signal
, is treated through a separate equation (Eq. (1.3)), with the corresponding equivalent bandwidth equal to ectral range of the device [8]. This assures maximum accuracy for the prediction of the ASE output . In the light of the aforementioned, the model does not focus on predicting the ASE spectrum in a single simulation cycle, but rather on deriving the overall effect the wideband ASE has on signal power and NF at the observed . Thereafter, the NF can be calculated by classical approach of cascading amplifiers [19]. The amplifier inversion factor is calculated by using the Eq. (6), and RSOA NF is thereafter calculated by using the NF cascading formula, assuming uniform inversion along a single longitudinal section of the device [20].
Fig. 3. Normalized mean square error (left) and computation time (right) he number of ASE spectral slices K, for the set of parameters presented in Table I. Upper limit for K is set after Ref. [8].
reflection coating is subject to the Snell's law, we assumed 1% reflectance at the near end of the initial value for the ASE photon density is considered to be equal to 1% of the output noise power calculated for the case of no input signal, and considered at the specific wavelength and bias current.
Since the material gain is assumed to be quasi-constant within equivalent ASE bandwidths, it is clear that the number
> REPLACE THIS LINE WITH YOUR PAPER IDENTIFICATION NUMBER (DOUBLE-CLICK HERE TO EDIT) < 5 of slots will dictate the simulation accuracy, as well as its
computational robustness. Thus, the model converges to the exact solution for K that allows Bjase to tend to the value of free spectral range of the device. We hereby calculated the optimal number of slots K, taking into account both computational efficiency of the model and mean square error (MSE), as a criterion for discrepancy between simulated and experimental values for signal gain and ASE power characterization. The results, for the parameters presented in Table I, are presented in Fig.3. Computation time is scaled by the duration of the most computationally efficient case (K=5). The upper limit for the number of ASE slots, K=40, corresponds to the computationally demanding ASE treatment in [8]. We hereby adopt K=24 as a trade-off value for the number of ASE wavelengths that need to be considered to assure good accuracy of the model.
III. EXPERIMENTAL VALIDATION
In this section, the experimental set-up for validation of the proposed RSOA model is shown. Furthermore, the multi-objective genetic algorithm (MOGA), used for the model parameters optimization is explained in details. Finally, the experimental results for different RSOA operation regimes will be presented and discussed.
A. Experimental System Set-up
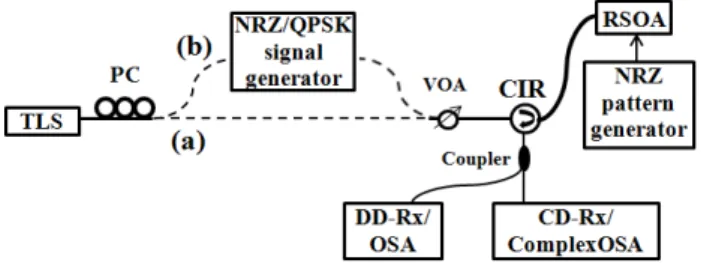
The system set-up used for RSOA characterization is presented in Fig. 4. Kamelian TO-packaged RSOA is used throughout the experimental characterization. A tunable laser (TLS) served as continuous wave (CW) input for static gain and noise characterizations (Fig. 4a), and as modulated NRZ/QPSK signal for the pulse shape analysis (Fig. 4b). In all cases, signal had 0 dBm power at the input of the variable optical attenuator (VOA), which was thereafter used to vary the signal power at the input of RSOA. Polarization controller (PC) was used to adjust the polarization prior to RSOA. The signal was monitored at the input and the output of RSOA, by using power meter and complex optical spectrum analyzer (OSA) with a spectral resolution of 0.05 nm. Upon reflection in RSOA, the signal was routed via circulator (CIR) to the complex OSA.
Fig. 4. Schematic diagram of the system set-up used for RSOA characterization in (a) CW and (b) modulated input signal regime.
NRZ signal with extinction ratios (ER) between 3 dB and 11 dB, and QPSK signal with the error vector magnitude (EVM) of 10 %, were used as inputs for pulse shape and remodulation regime analysis. NRZ pattern generator was used for direct modulation of RSOA, with the current bias
point set to 60 mA. Direct detection receiver (DD-Rx) was used for eye diagram analysis of remodulated signals, whereas coherent detection receiver (CD-Rx) served for the analysis of the QPSK constellation diagram before and after remodulation.
B. Multi-objective Genetic Algorithm
The methodology for the extraction of the simulation parameters that satisfy the best-fit criterion is based on the multi-objective genetic algorithm (MOGA). Given the model in section II and the experimental measurements described in the previous section, the goal was to use an efficient and accurate method capable to extract a set of model parameters that satisfy, at the same time, the experimental performance of several system variables. The variables considered for optimization are RSOA NF, RSOA gain and ASE power, as a function of input power. RSOA bias current was set at a constant value of 100 mA.
For each variable, the objective function that produces a best-fit criterion, and minimize the error between the set of measured and estimated data, is given by:
( )
( )
(
)
2 1 1 , 1, 2, 3 N j j j i F c i m i j N = =∑
− = (8)where Fj is the root mean square error (RMSE) between measured and estimated values, cj(i) and mj(i) are the ith estimated and measured values, respectively, and N is the number of measurements.
To satisfy all three objectives simultaneously, two main approaches are used to overcome this problem in the literature. The first one consists of the combination of the different objectives into a single one, and then using one of the techniques for single objective optimization [21, 22]. In such cases, the compromise between the objectives is a priori determined through the choice of the combination rule. The main criticism addressed to this approach is the difficulty to choose a priori the compromise. Another method is to postpone this choice after having several candidate solutions. This is the goal of the Pareto-based method using the notion of dominance between candidate solutions. In this case the goal of the search algorithm becomes the identification of a set of solutions which are non-dominated by any others, which is the main concept behind MOGA [23].
From the resulting Pareto front and the corresponding candidate solutions, the best solution is chosen by finding, between all candidate solutions, the minimum average between the values of each objective function:
( )
3 1 1 min , 1, , 3j j S F k k Ns = = = ∑
… (9)where Ns is the number of solutions.
MOGA is run for 50 generations, as a compromise between accuracy and simulation time [24]. MOGA starts to run from an initial population with 200 individuals, i.e. 200 different parameter’s sets. All members of the initial population are randomly generated from a seed individual, composed by a set
of non-random parameters selected by the user. Upper and lower boundaries were also defined and used, according to physical limits of each parameter. We performed discrimination of the optimized sets error-wise, according to Eq. (9), and then finally selected one that has the lowest error for the rest of the characterizations. The optimized solution set using MOGA is given in Table I.
TABLEI
RSOA SIMULATION PARAMETERS
Symbol Quantity Value
PARAMETERSCONSIDEREDINMOGA
Anrad Nonradiative recombination
coefficient 1.9×10
8 s-1 Brad Bimolecular radiative recombination
coefficient 1.9×10
-16 m3s-1 Caug Auger recombination coefficient 2.9×10-41 m6s-1
W Active region width 0.42 µm
H Active region height 0.47 µm
L Active region length 404µm
ε Nonlinear gain suppression factor 5.4×10⁻²³ m3 dng/dn
Carrier induced refractive index
change -2.28×10
-26 m-3 K0 Carrier independent absorption loss
coefficient 4350 m
-1
K1 Carrier dependent absorption loss
coefficient 6150×10
-24 m2 Kg Band-gap shrinkage coefficient 9.8×10⁻¹¹ eVm
FIXEDPARAMETERS
m0 Free-electron mass 9.11×10⁻³¹ kg [16]
me Electron effective mass in the
conduction band (CB) 0.045×m0 [16]
mhh Heavy hole effective mass in the valence band (VB) 0.46×m0 [25]
mlh Light hole effective mass in the VB 0.0557×m0 [25]
y Active region compound composition
parameter 0.89 [8]
a
Band-gap energy coefficients
1.35 eV [26]
b -0.775 eV [26]
c 0.149 eV [26]
Γ Optical mode confinement factor 0.3 [10]
Rend End facet reflectivity 0.99
αf Fiber coupling loss 1 dB
T Absolute temperature 300 K
RSOA simulation parameters. The extracted values are in good agreement with measurement values found in literature [8,10,12].
C. Results and Discussion
Static characterizations are preformed for CW inputs in both experiment and simulation. The simulated output ASE power at signal wavelength λi, generated along the corresponding equivalent bandwidth Biase, is scaled to correspond to the OSA wavelength resolution bandwidth. In case of the pulse propagation and remodulation analysis, temporal profiles of input signals at the input of RSOA were measured by using complex OSA, and used as inputs for simulation. The simulation results are thereafter confronted to the experimental data at the output of RSOA. For complex analysis of modulated signals, OSA required a particular configuration, where special 16-bit sequence had to be applied for the correct clocking of the device at 10 Gb/s and 40 Gb/s.
Static Characterization
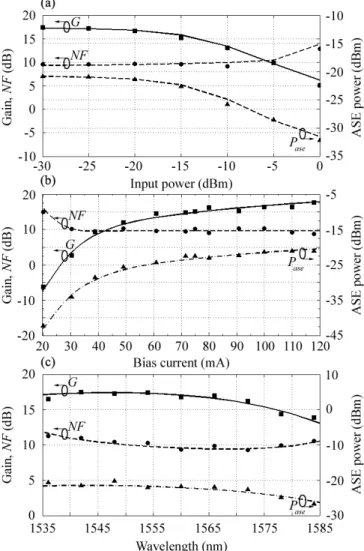
Fig. 5 reports experimental and simulation results for several static operating characteristics of RSOA. Discrepancies between the simulated and the experimental values are low (< 1 dB) for all considered cases. The characterization was performed for the TE polarization mode; however, the polarization dependent saturation gain was found to be less than 1 dB for the entire C-band.
Fig. 5. Experimental validation (markers) of the simulation results (lines). Optical gain (■), noise figure (●) and noise output power (▲) versus (a) input power at 1550 nm and 100 mA bias, (b) versus bias current at 1550 nm and input power of -20 dBm, and (c) versus wavelength at 100 mA bias and input power of - 20 dBm.
Firstly, RSOA is characterized versus input signal power. In Fig. 5(a), the experimental and simulated fiber-to-fiber gain, NF and output ASE power are compared for the 1550 nm input signal and 100 mA driving current. The predicted and experimental signal saturation gain was around 18 dB, for the input saturation power of around -15 dBm. For a low input power of -30 dBm NF is found to be 9.7 dB. However, as input power is increased to 0 dBm, NF increases to 14 dB, as for the low signal amplification RSOA is mostly adding noise photons.
Fig. 5(b) shows predicted and experimental signal gain, NF and ASE power, as functions of bias current, for input signal
> REPLACE THIS LINE WITH YOUR PAPER IDENTIFICATION NUMBER (DOUBLE-CLICK HERE TO EDIT) < 7 power of -20 dBm at 1550 nm. For moderate to high bias
currents NF was found to be around 9.8 dB.
The wavelength dependent characterization is presented in Fig. 5(c). Over the wavelengths ranging from 1535 nm to 1585 nm, the lowest value of gain for -20 dBm of input power was around 13 dB, at 1585 nm. However, within the C-band, the optical gain variation was found to be slightly less than 1 dB.
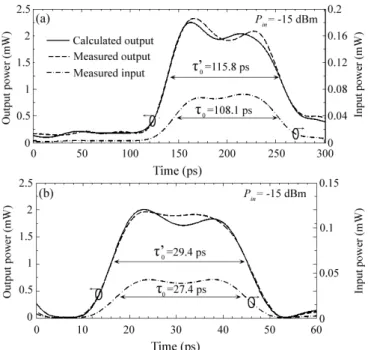
Fig. 6. Predicted versus experimental output pulse shape (left) for a -15 dBm input pulse (right) of (a) 108.1 ps, and (b) 27.4 ps width (FWHM). Driving current was set to 100 mA.
Dynamic Characterization
We further analyzed optical pulse interaction with the RSOA active region. Fig. 6 reports the experimental and simulated pulse shapes before and after propagation through RSOA biased at 100 mA. Considered input pulse full widths at half maximum (FWHM), denoted as τ0, were 108.1 ps (Fig. 6(a)) and 27.4 ps (Fig. 6(b)). Experimental and simulation results both indicated around 7 % of pulse broadening, for all considered cases of input pulse FWHM.
In Fig. 7, the output pulse shapes for various input powers, normalized for its peak power and FWHM, are shown. The output pulse shape is the result of gain dynamics, as well as the self phase modulation (SPM) imposed by the intensity dependent refractive index. For the increased input power the operation under the saturation region is approached, and the distortions in the bit pattern become more apparent. Firstly, as the device operation is set closer to the saturation regime, the pulse wings experience more amplification as opposed to its peak, which leads to the pulse broadening. The asymmetry of the pulse is the result of the gain saturation, as its leading edge experiences higher amplification due to the higher level of yet-undepleted carrier density. Furthermore, due to the finite speed of the gain saturation dynamics, the pulse will experience an overshoot at its leading edge. It is worth noticing that the magnitude of the transient behavior increases
significantly with the pulse input power for high bias current such as 100 mA.
Fig. 7. Normalized pulse powers versus normalized time, demonstrating pulse broadening of the input pulse (dotted line) for the input powers of -20 dBm (solid line) and -15 dBm (dashed line).
The estimation of chirping effects in RSOA is considered for 108.1 ps input pulse and 100 mA driving current, and is in good agreement with the experimental results. The results for various input powers and a low chirp input pulse are presented in Fig. 8, indicating a good match between the simulated and experimental results.
Fig. 8. Predicted versus experimental frequency chirp (right) of the output pulses (left) for the input pulse powers of (a) -25 dBm, (b) -20 dBm, and (c) -15 dBm.
In our further consideration of the signal propagation in RSOA, we analyzed the waveform of a 10 Gb/s QPSK signal at the output of RSOA. The results, for the near - saturation input signal power of -15 dBm and 100 mA RSOA bias current, are presented in Fig. 9. Chirping effects are well predicted for both rising and falling edges of QPSK symbols, but are slightly exaggerated between the phase transitions. Some discrepancies between the experimental and the estimated phase and amplitude variations are most likely due to the noisy nature of the input QPSK signal amplitude, and the fact that the inputs and outputs could not be recorded at the exact same moment. Nevertheless, QPSK output signal amplitude presented in Fig. 9 is predicted with less than
-15 dB of mean square error (MSE), normalized to the output signal average power, while MSE for QPSK signal phase was found to be less than -12.5 dB.
We further qualitatively analyzed the model behavior under the remodulation regime, for both 10 Gb/s NRZ and QPSK input signals, using amplitude shift keying (ASK) format.
Fig. 9. (a) Calculated and experimental amplitude and phase of a 10 Gb/s QPSK signal before and after passing through RSOA, for input power of -15 dBm. (b) Chirp of a single symbol.
ASK Remodulation
In both experiment and simulation, signal remodulation was performed by using NRZ format at 1.25 Gb/s, with 215-1 long pseudo-random binary sequence (PRBS). RSOA was driven by a bias current of 60 mA, with 40 mA peak to peak modulation. Fig. 10 reports eye diagrams for remodulated 10 Gb/s input QPSK, and NRZ signals of different ER.
Fig. 10. (a), (b), (c) Experimental, and (d), (e), (f) calculated eye diagrams of 1.25 Gb/s output NRZ signal. The output signal was generated by means of direct RSOA modulation of 10 Gb/s (a), (b), (d), (e) NRZ and (c), (f) QPSK input signals of - 20 dBm input power. Comparison is given for input NRZ signal extinction ratios of (a), (d) 3 dB, and (b), (e) 6 dB.
Simulated eye diagrams presented in Fig. 10(d) and (e) demonstrate that the model prediction of the remodulated signal quality for input NRZ signals is in a good qualitative
agreement with the experimental results, presented in Fig. 10(a) and (b). The increase of the input NRZ signal ER increases the magnitude of residing 10 Gb/s bit pattern, which will translate into additional noise at the remodulated signal receiver. As can be noted in Fig. 10, this will affect the output signal-to-noise ratio and cause considerable eye degradation, even in the back-to-back scenario considered in this work.
Remodulation of the input QPSK signal will produce phase-to-intensity fluctuations in the output NRZ signal, predominantly residing in the mark level of the eye-diagram, as seen in Fig. 10(c) and (f). However, it still allows higher quality of remodulation, particularly compared to the higher ER NRZ input signal, which is well predicted by the model (Fig. 10(c) and (d)). The effect of the remodulated QPSK signal distortion and phase noise can be observed in more detail by examining its constellation diagrams before and after remodulation in RSOA, as shown in Fig. 11.
Fig. 11. (a), (b) Experimental and (c), (d) calculated constellation diagrams of a 10 Gb/s QPSK signal of - 20 dBm input power. Comparison is given for QPSK signal (a), (c) before, and (b), (d) after being remodulated with 1.25 Gb/s NRZ format in RSOA.
As already noted, the simulation under remodulation regime in this work is restricted to the input signals generated with a short sequence, for the sake of using experimentally measured inputs and emulating more realistic conditions for our simulation. However, comparison with the experimental data, provided for a 223-1 long PRBS sequence, suggests the same qualitative behavior, as can be seen in Fig. 10 and Fig. 11.
IV. CONCLUSION
A wideband, dynamic model for simulation of spatial and temporal distribution of photons and carriers in a bulk RSOA is presented. Multi-objective genetic algorithm is used for parameter extraction. The proposed model performs well for a variety of static and dynamic characterizations and provides higher computational efficiency in comparison to other models due to its flexible ASE noise treatment. We have concluded that ASE treatment over up to 24 different wavelengths is enough to provide good accuracy.
The model can find some of its potential applications in the analysis and optimization of both direct and coherent transmission subsystems, from both device and transmission system design point of view. Namely, it can be utilized for the efficient analysis of RSOA application in high-speed broadband WDM PONs, by helping indicate its limitations and ways to optimize its characteristics for efficient operation. Furthermore, it could indicate new possibilities for high-speed modulation methods, especially for upstream transmission under cost-effective colorless ONU scenario.
> REPLACE THIS LINE WITH YOUR PAPER IDENTIFICATION NUMBER (DOUBLE-CLICK HERE TO EDIT) < 9 ACKNOWLEDGMENT
The Authors would like to thankfully acknowledge the ISCOM collaboration.
REFERENCES
[1] G. E. Wong, "Next-Generation Broadband Access Networks and Technologies," J. Lightwave Technol.. vol. 30, n.º 4, pp. 597-608, Feb. 2012. DOI: 10.1109/JLT.2011.2177960.
[2] J.-i. Kani, "Enabling Technologies for Future Scalable and Flexible WDM-PON and WDM/TDM-PON Systems," IEEE J Select Topics
Quantum Electron , vol. 16, no. 5, pp. 1290-1297, Sep. 2010. DOI:
10.1109/JSTQE.2009.2035640.
[3] W. Lee, M. Y. Park, S. H. Cho, J. Lee, C. Kim, G. Jeong, and B. W. Kim, "Bidirectional WDM-PON based on gain-saturated reflective semiconductor optical amplifiers," IEEE Photonics Technology Letters,, vol. 17, no. 11, pp. 2460-2462, Nov. 2005.
[4] I. Papagiannakis, M. Omella, D. Klonidis, J. A. Lázaro, A. N. Birbas, J. Kikidis, I. Tomkos, and J. Prat, "Design Characteristics for a Full-Duplex IM/IM Bidirectional Transmission at 10 Gb/s Using Low Bandwidth RSOA," J. Lightwave Technol., vol. 28, no. 7, pp. 1094-1101, Apr. 2010. DOI: 10.1109/JLT.2009.2039195.
[5] M. Omella, V. Polo, J. Lazaro, B. Schrenk, and J. Prat, “10 Gbps RSOA transmission by direct duobinary modulation,” in Proc. Eur. Conf. Opt.
Commun., Sep. 2008, Paper Tu3E4.
[6] K.Y.Cho, U. H. Hong, A. Agata, T. Sano, Y. Horiuchi, H. Tanaka, M. Suzuki, and Y. C. Chung , "10-Gbps, 80-km reach RSOA-based WDM PON employing QPSK signal and self-homodyne receiver," in Proc.
Opt. Fiber Commun. Conf. Nat. Fiber Optic Eng. Conf., Mar. 2012,
Paper OW1B.
[7] S. P. Jung, Y. Takushima, and Y. C. Chung, “Generation of 5-Gbps QPSK signal using directly modulated RSOA for 100-km coherent WDM PON,” in Proc. Opt. Fiber Commun. Conf. Nat. Fiber Optic Eng.
Conf., Mar. 2011, Paper OTuB3.
[8] M.J. Connelly, "Wideband semiconductor optical amplifier steady-state numerical model," IEEE J. Quantum Electron., vol. 37, no. 3, pp. 439-447, Mar. 2001. DOI: 10.1109/3.910455.
[9] M.J. Connelly, "Reflective Semiconductor Optical Amplifier Pulse Propagation Model," IEEE Photon Technol. Lett., vol. 24, no. 2, pp. 95-97, Jan. 2012. DOI: 10.1109/LPT.2011.2173184.
[10] L. A. Coldren and S. W. Corzine, Diode Lasers and Photonic
Integration Circuits, New York: Wiley, 1995, ch. 5.
[11] B. R. Bennett, R. A. Soref, and J. A. D. Alamo, “Carrier-Induced change in refractive index of InP, GaAs and InGaAsP,” IEEE J. Quantum
Electron., vol. 26, no. 1, pp. 113–122, Jan. 1990. DOI: 10.1109/3.44924.
[12] N. Storkfelt, B. Mikkelsen, D. S. Olesen, M. Yamaguchi, and K. E. Stubkjaer, “Measurement of carrier lifetime and linewidth enhancement factor for 1.5-µm ridge-waveguide laser amplifier,” IEEE Photon.
Technol. Lett., vol. 3, no. 7, pp. 632-634, Jul. 1991.
[13] G. Talli, and M.J. Adams, "Amplified spontaneous emission in semiconductor optical amplifiers: modeling and experiments," Opt.
Commun., vol. 218, no. 1–3, pp. 161-166, Mar. 2003.
[14] A. Yariv, Quantum Electronics, New York: Wiley, 1988, ch. 8, 11. [15] N. G. Nilsson, "Empirical approximations for the Fermi energy in a
semiconductor with parabolic bands,"Appl. Phys. Lett., vol. 33, no. 7, pp. 653, Jul. 1978. DOI: 10.1063/1.90452.
[16] S. Adachi, Physical Properties of III IV Semiconductor Compounds, New York: Wiley, 1992, ch. 6.
[17] G. Giuliani, and D. D'Alessandro, "Noise analysis of conventional and gain-clamped semiconductor optical amplifiers," J. Lightwave Technol., vol. 18, no. 9, pp. 1256-1263, Sep. 2000. DOI: 10.1109/50.871703. [18] N. K. Dutta and Q. Wang, Semiconductor Optical Amplifiers, Singapore:
World Scientific Publishing Co. Ltd, 2006, ch. 6.
[19] D. D'Alessandro, G. Giuliani, and S. Donati, "Spectral gain and noise evaluation of SOA and SOA-based switch matrix," in IEE Proc.
Optoelectron., vol. 148, no. 3, pp. 125-130, Jun 2001. DOI:
10.1049/ip-opt:20010522.
[20] P.C. Becker, N.A. Olsson, and J.R. Simpson, Erbium-doped fiber
amplifiers : fundamentals and technology, San Diego: Academic Press,
1999, ch. 7.
[21] S. Luke (2009, July 1). Essentials of metaheuristics (1st ed.) [Online]. Available: http://cs.gmu.edu/~sean/book/metaheuristics/.
[22] L. Ingber, “Simulated annealing: practice versus theory,” Math. Comput. Modelling, vol. 18, pp. 29–57, Dec 1993.
[23] C. Coello, G. Lamont, and D. Veldhuizen, Evolutionary algorithms for
solving multi-objective problems, Berlin: Springer, 2007, ch. 2.
[24] R. Poli, W. B. Langdon, and N. F. McPhee (2008, March 1). A field
guide to genetic programming (1st ed.) [Online].
Available: http://www.gp-field-guide.org.uk.
[25] J. Leotin, R. Barbaste, S. Askenazy, M.S. Skolnick, R.A. Stradlin, and J. Tuchendler, "Hole mass measurement in p-type InP and GaP by submillimetre cyclotron resonance in pulsed magnetic fields," Solid
State Communications, vol. 15, no. 4, pp. 693-697, 15 Aug. 1974. DOI:
10.1016/0038-1098(74)90242-7.
[26] T. P. Pearsall, GalnAsP Alloy Semiconductors, Chichester: Wiley, 1982, p. 295.
Zoran Vujicic was born in Kotor, Montenegro, in 1983. He received the B.Sc
and M.Sc. degrees in electrical engineering, major in optical telecommunications, from University of Belgrade, Serbia, in 2008 and 2010, respectively. In 2010, he joined the Instituto de Telecomunicações (IT), University of Aveiro, where he works as a Researcher, in the framework of TOMAR PON project, toward the Ph.D. degree.
He has been involved in scientific topics that include enhancement of the overall performance of high speed, extended reach WDM PON, optimization of RSOA and IL-FPLD transmitters for multigigabit broadband WDM PON systems, and investigation of nonlinear-effects in optical fibers. He is actively involved as a Reviewer of various peer-reviewed journals.
Rogerio P. Dionísio (M’02, SM’12) was born in France, in 1973. He received
his Bachelor and Master degrees in Electronics and Telecommunications Engineering from the University of Aveiro (Portugal), in 1997 and 2004 respectively. From 1999, he has been a professor of Electrical Engineering at the Polytechnic Institute of Castelo Branco. In 2006, he joined the Instituto de Telecomunicações as a research associate.
His research interests are all-optical signal processing for optical communication systems, cognitive radio systems and spectral coexistence analysis. He is currently working toward the Ph.D. degree at the University of Aveiro.
Ali Shahpari was born in Golpayeghan, Iran, in 1979. He received his M.Sc.
degree in Electrical Engineering – Telecommunications (2003) from Shiraz University, Iran. He has been working towards his Ph.D. degree at University of Aveiro and Instituto de Telecomunicações since 2010.
His research topics include techno-economic and energy efficiency in next-generation optical access and optical modulation formats with using coherent and direct detection receivers.
Natasa B. Pavlovic received the Dipl. Ing. and the M. Sc. degrees in
electro-technical engineering, major in Telecommunications from Faculty of Electro-Technical Engineering, Belgrade University, Serbia, in 2001 and 2003, respectively, and the Ph. D. degree in optical communications at Instituto Superior Técnico, Lisbon, Portugal, in 2008. Her Ph. D. thesis was on the signaling formats for ultra dense wavelength division multiplexing systems. Since 2001, she has been researcher at Instituto de Telecomunicações (IT), Lisbon and Aveiro, Portugal, where she was involved in many national and international projects.
Her research interests were in the field of transmission and advanced modulation formats for high spectral efficient optical communication systems. Since 2009, she has been also with the Nokia Siemens Networks, R&D team, Lisbon, Portugal, where her field of interests are in the area of the transmission modeling and optimization of the 40/100G submarine and single span links upgrades with advanced modulation formats. She is actively involved as a reviewer of several peer-reviewed journals.
Antonio Teixeira(S’98–M’01) was born in Portugal, on November 17, 1970.
He received the Licenciatura degree in Electronics Engineering and Telecommunications, in July of 1994 and the PhD degree in Electrical Engineering, in 1999, all from the University of Aveiro, Portugal. He is currently an Assistant Professor at the Department of Electronics, Telecommunications and Informatics of the University of Aveiro and researcher at the Instituto de Telecomunicações - Aveiro.
His research interests include DWDM optical networks, dispersion compensation, fiber Bragg gratings, and radio over fiber technologies.