Abstract
Finite element mesh of multi-directional 4D carbon/carbon (C/C) composite was reconstructed from 2D images obtained by X-ray tomography. Thus, imperfections in the composite such as voids, misalignment and cross-section distortion of the fibre bundles were directly incorporated in the finite element mesh. 2D images of the composite were also used for the characterization of the porosity in the composite. The effect of these micro structural imperfec-tions was studies by assuming perfect bonding at the bun-dle/matrix interface. The initial mechanical properties of the com-posite were obtained from unit cell analysis using asymptotic homogenization and moduli in x, y and z directions were 39, 25 and 44 GPa. However, matrix and bundle/matrix interfacial cracks were also clearly visible in the X-ray tomographic images. Later, the effects of debonding was incorporated by using friction-al cohesive interaction at bundle/matrix interfaces and matrix cracking was modeled by degrading the elastic properties of ma-trix. Final, the response of the composite was studied under six individual load cases.
Key words
Carbon/Carbon composites; Homogenization; X-ray tomography reconstruction; Image based FEM; Cohesive surfaces.
Finite Element Analysis for Mechanical Characterization of
4D Inplane Carbon/Carbon Composite with Imperfect
Mi-crostructure
1 INTRODUCTION
The multi-directionally reinforced carbon/carbon (C/C) composites are extensively used in aero-space industry due to their high performance mechanical properties. These composites have signifi-cant damage induced during the manufacturing process (Jortner (1986), Sharma (2012), Siron (1998)). Damage in the form of matrix cracking, debonding of fiber/matrix and fiber bundle/matrix interfaces occurring during manufacturing, affects the properties adversely (Sharma (2012), Rao
(2008)ab). These imperfections in the composite were broadly divided into two categories, local and
global imperfections. Local imperfections contained defects like voids and cracks, whereas global imperfections were referred to cross-sectional distortions and misalignments. The voids and cracks
Rajn ees h Sh arma * Atul Rames h Bh aga t P un eet Ma hajan
Department of Applied Mechanics, Indian Institute of Technology Delhi, New Delhi 110016, India
Received in 06 Oct 2012 In revised form 03 May 2013
Latin American Journal of Solids and Structures 11(2014) 170 - 184
are the dominating defects in the composite. Some of these imperfections can be considered directly in the analysis by obtaining the finite element (FE) mesh from X-ray tomographic images. This technique of analysis is called as image-based finite element analysis. Many applications of this ap-proach for reconstruction of FE mesh are found in the area of biomechanics, metal matrix compo-site, foam, and cement paste (Magne (2006), Wolodko (2000), Youssef (2005), Hain (2008)).
A 3D FE mesh of the composite obtained by using X-ray micro tomography was used by Au-bard et al. (2000) and Szeremi et al. (2008) for the analysis of C/C composite. Piat et al. (2006, 2009) obtained 3D structural information of voids for C/C laminates using X-ray computed tomog-raphy images and predicted the effective elastic properties of the carbon felts by involving statistical analysis of the microstructure of pores. Vorel et al. (2010) reconstructed the statically equivalent unit cell for plain weave C/C composite from X-ray tomography for homogenization.
Ali et al. (2009) simulated the tension test using ideal and reconstructed FE meshes of the mi-crostructure of plane woven C/C composite. The mechanical properties used for the constituents were determined by nanoindentation test. Sharma et al. (2010) studied the effect of the variation in the microstructure of 3D C/C composite on the mechanical properties by reconstructing FE mesh form X-ray tomographic images. The asymptotic homogenization technique with periodic boundary condition was used for the analysis of the reconstructed unit cells to determine the mechanical properties. The volume average properties of the unit cells were considered as the effective homoge-nized properties of the composite. The bundles/matrix interfaces were assumed perfectly bonded in the studies discussed above. Sharma et al. (2012) have introduced the cohesive surface interactions at the bundle/matrix interfaces of the reconstructed FE mesh for the simulations of fiber bundle push-out test.
In present study, the inherent micro-structure of the 4D C/C composite was reconstructed by using X-ray tomography. The 2D images obtained from X-ray tomography were used to reconstruct 3D FE mesh having some of the imperfections such as distortion of the fiber bundles and voids. Asymptotic homogenization with periodic boundary conditions was used for unit cell analysis of the composite for perfectly bonded interfaces. Next, matrix cracking was modeled by degrading the elastic properties and interfacial damage was modeled using frictional cohesive surfaces. The re-sponse of the unit cells under six individual load cases was studied. The results were compared to the experimental data available in literature.
2 COMPOSITE MATERIAL
C/C composite consists of circular bundles in four directions with nearly 80% volume fraction of fibers. The architecture contains 0/60/120 inplane bundles in xy plane and z-directional bundles in out of plane. C/C composite under consideration was prepared by pitch based matrix impregnation. The coal-tar pitch was used as precursor and carbonization was carried out under high pressure
nearly 100 MPa and at 1000 oC (Devi and Rao (1993)). The graphitization temperature for the
composite was nearly 2200 oC. Specimens for the X-ray tomographic observations were taken from
Latin American Journal of Solids and Structures 11(2014) 170 - 184
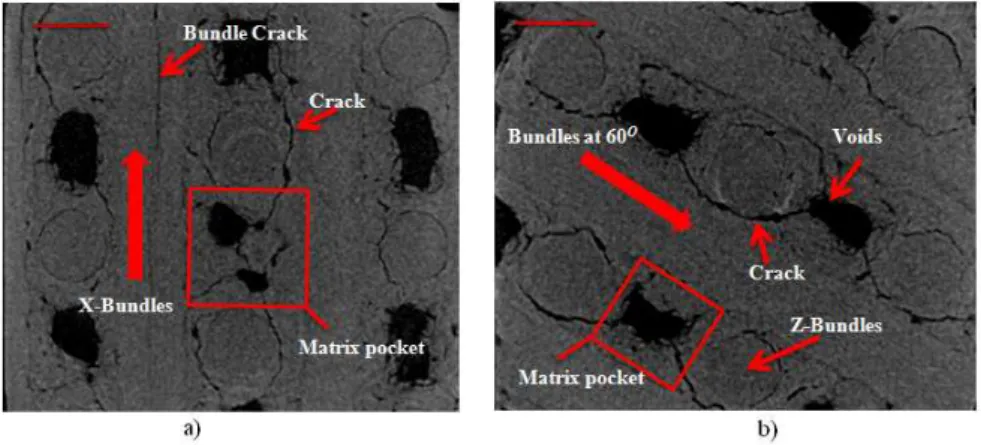
cracks (cracks joining to adjacent voids) was observed in these images (see Fig.1). The intra bundle cracks were also observed at some locations as shown in Fig.1a.
Figure 1 Reconstructed 2D images of the 4D C/C composite a) cross section showing x and z bundles, b) cross section showing bundles at 60o and z directions.
Interfacial cracks around the z-bundles were observed propagating though matrix and merging with voids at some locations (see Fig.1b).
The voids were observed all most in all the matrix pockets and therefore, can be considered as periodically distributed in the composite. However, the size and shape of the voids differs in each pocket. To have an overall idea of the size and shape of voids in the composite, structural parame-ters such as thickness distribution and structural model index (SMI) were measured using commer-cial software “CTvol” (SkyScan 1172). The typical distribution of the structure thickness is given in the Fig.2. The contribution of the thickness less than 100 µm is around 30%. The Structure model index of the voids was nearly 4, which shows that the voids were spheres. The volume fraction of the voids was nearly 2-3% in the composite.
0.0 0.1 0.2 0.3 0.4 0.5 0.6 0.7
0 5 10 15 20 25 30
Percentage %
Mean size (mm)
1
2
3 4
5
6
7 8
9
Latin American Journal of Solids and Structures 11(2014) 170 - 184
The 2D images of the composite were also utilized to reconstruct the finite element FE mesh of the unit cells of composites as discussed in next section.
3 RECONSTRUCTED FE MESH
A 3D image of the composite was reconstructed from the 2D images and three randomly chosen unit cells of the composites were cropped. The segmentation process of the constituent was dis-cussed in detail by Sharma at al. (2010). The volume fraction of the constituents in the unit cells is given in Table 2.
Table 1 Volume fraction of the constituents.
Sample X-fiber 600
-fiber 1200
-fiber Z-fiber Matrix Voids
A 10 8.5 8.3 12 59.5 1.7
B 8 8.2 7.8 11.8 62.2 2
C 9 9.3 9.5 11.8 58 2.4
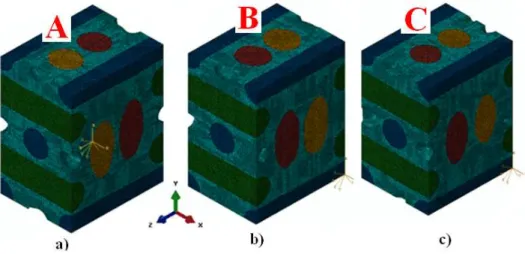
Micro cracks present in matrix were ignored during the reconstruction of the 3D image as a fine mesh needed in their vicinity which increases the number of elements drastically and FE mesh ob-tained was computationally uneconomical. However, the effect of the matrix cracking was consid-ered by degrading the material properties and bundle/matrix interfacial cracks were modeled by frictional cohesive interactions. The reconstructed finite element meshes of three randomly chosen unit cells are shown in Fig.3.
Figure 3 FE meshes for randomly chosen unit cells.
Latin American Journal of Solids and Structures 11(2014) 170 - 184
was studied for six independent load cases. The material properties of the constituent were taken
from the work of Rao at el. (2008)b and are given in Table 2.
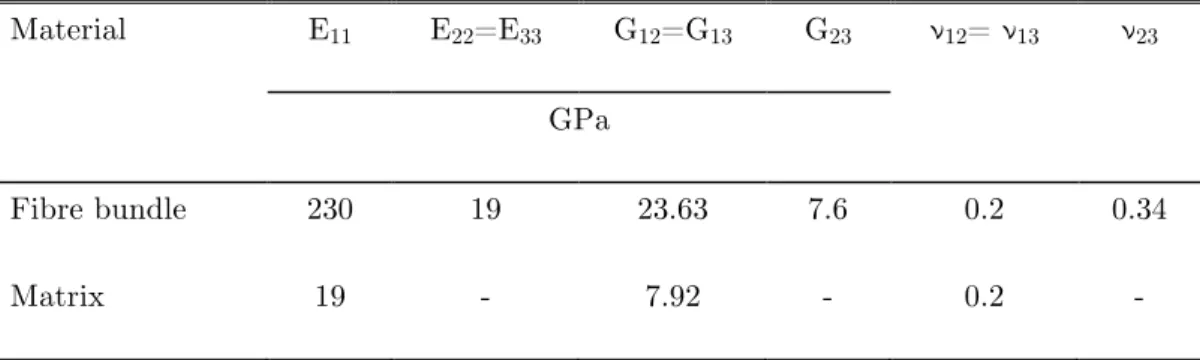
Table 2 Effective properties of fibre bundle and matrix GPa
Material E11 E22=E33 G12=G13 G23 ν12= ν13 ν23
GPa
Fibre bundle 230 19 23.63 7.6 0.2 0.34
Matrix 19 - 7.92 - 0.2 -
4 HOMOGENIZATION AND PERIODIC BOUNDARY CONDITIONS
Three reconstructed unit cells of the composite were analyzed using asymptotic homogenization and periodic boundary conditions. In this technique, the composite was considered homogeneous at full length scale and inhomogeneous at local scale. The macro scale constitutive relation can be defined
by the eqn.1 using asymptotic homogenization (Rao (2008)b, Stefan (1992)).
σ
ij
=
C
ijkl H(
e
)
e
kl (1)Here,
C
ijklH is the homogenized stiffness matrix, which is a function of micro-strain.e
kl is the
volume average strain tensor and
σ
ij is the volume average stress tensor.
σ
ij
=
1
v
σ
ij
dv
v∫
(2)e
ij=
1
v
ve
ijdv
∫
(3)Here, v is the volume of the RVE. In case of imperfect bonding at the interface the above
equa-tion of the average strain can be modified as given below (Rao (2008)b, Stefan (1992)).
e
ij=
1
V
e
ijdv
+
Vme
ijdv
∫
+
1
2
⎡⎣ ⎤⎦
u
in
j+
u
j⎡
⎣
⎤
⎦
n
i(
)
ds
sm/sf
∫
vf
∫
⎡
⎣
⎢
⎢
⎤
⎦
⎥
Latin American Journal of Solids and Structures 11(2014) 170 - 184
Here,
v
f ,v
mand
s
correspond to fiber, matrix and interface domains in the unit cell.⎡⎣ ⎤⎦
u
i isthe jump in the displacement components across the fiber bundle/matrix interface with outward
normal
n
i. The bundle/matrix interfaces in the composite was modeled by using cohesive surface
interactions and node to surface contact algorithm as inbuilt in “Abaqus Standard” (Abaqus 6.10). The unilateral contact and adhesion conditions in the normal directions are given as (Alfano (2006), Sharma (2013)).
τ
1
( )
x
−
(
1
−
ω
int( )
x
)
K
1δ
1( )
x
≤
0;
(5)or
δ
1
( )
x
≥
0;
and
τ
1
( )
x
−
(
1
−
ω
int( )
x
)
K
1δ
1( )
x
{
}
δ
1
( )
x
=
0;
(6)Here ωint is the interfacial damage parameters. K1 and K2 are stiffness in the normal and
tangen-tial directions, respectively. The tractions law in pure shear is governed by following equations
τ
2
( )
x
=
τ
2a
x
( )
+
τ
2
f
x
( )
,
(7)τ
2ax
( )
=
(
1
−
ω
int(
x
)
)
K
2δ
2(
x
)
(8)τ
2f(
x
)
=
ω
int(
µ
τ
1)
(9)ω
intis interfacial damage variable and variation of
ω
intis given as below;ω
int=
δ − δ
0δ
f−
δ
0δ
fδ
0⎛
⎝⎜
⎞
⎠⎟
(10)The six independent load cases of macro strains (
e
kl) are applied one by one to obtain the
Latin American Journal of Solids and Structures 11(2014) 170 - 184
u
x=0
=
0 &
u
x=lx
=
l
xε
11v
y=0=
0 &
v
y=ly
=
l
yε
22w
z=0
=
0 &
w
z=lz
=
l
zε
33⎫
⎬
⎪
⎪
⎭
⎪
⎪
(11)here 1, 2, and 3 corresponds to x, y and z direction. u, v and w are the displacements and lx, ly and
lz are the lengths of unit cell in x, y and z directions. The boundary conditions under shear loading
are given in eqns. (4-6).
u
x=0=0 ux=lx=0
u
y=0= wy=0=0 uy=ly= wy=ly =0
u
z=0= vz=0=
0 u
z=lz=
0 &v
z=lz =lzγ23 ⎫ ⎬ ⎪ ⎪ ⎭ ⎪ ⎪ (12) v
x=0=wx=0=
0 v
x=lx=wx=lx =0 v
y=0=
0 v
y=ly
= 0
u
z=0= vz=0=
0 u
z=lz=lzγ13 &vz =lz =0
⎫ ⎬ ⎪ ⎪ ⎭ ⎪ ⎪ (13) v
x=0=w x=0=
0 v
x=lx=w x=lx =0
u
y=0=w y=0=
0 u
y=ly=lyγ12
&w
y=ly=
0
w
z=0=
0 w
z=lz =0
⎫ ⎬ ⎪ ⎪ ⎭ ⎪ ⎪ (14)
The six loading cases in terms of macroscopic strains along with above six boundary conditions were applied to obtained homogeneous stiffness matrix. The results obtained for three unit cells are discussed in next section.
5 RESULTS AND DISCUSSION
5.1 Perfectly bonded interfaces (Case-1)
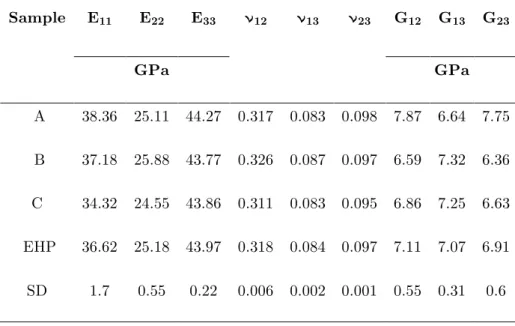
Latin American Journal of Solids and Structures 11(2014) 170 - 184 Table 3 Mechanical properties of the composite (Here E and G are in GPa).
Sample E11 E22 E33 ν12 ν13 ν23 G12 G13 G23
GPa GPa
A 38.36 25.11 44.27 0.317 0.083 0.098 7.87 6.64 7.75
B 37.18 25.88 43.77 0.326 0.087 0.097 6.59 7.32 6.36
C 34.32 24.55 43.86 0.311 0.083 0.095 6.86 7.25 6.63
EHP 36.62 25.18 43.97 0.318 0.084 0.097 7.11 7.07 6.91
SD 1.7 0.55 0.22 0.006 0.002 0.001 0.55 0.31 0.6
Effect of the variation in microstructure of the composite on Young’s moduli was within 10%. The Poisson’s ratio varied in the rage of 5%. The shear moduli were affected more as compare to other properties and the variation was in the range of 18% among all the unit cells.
5.2 Imperfectly bonded interfaces (Case-2)
The fiber bundle/matrix interfaces in the composite had partially damaged during the manufactur-ing process. The interfacial cracks were partly propagated through matrix, which makes debonded surfaces highly rough. The interfacial cracks were modeled using cohesive surface interaction be-tween the bundle/matrix interfaces. The bundle/matrix interfaces in the composite for unit cells are shown in the Fig.4.
Figure 4 Bundle/matrix interfaces in the unit cells of the composite.
Latin American Journal of Solids and Structures 11(2014) 170 - 184
element mesh is smooth at the interfaces and not able to capture roughness amplitudes of the debonded surfaces in the composite. Therefore, a compressive radial stress was applied by expand-ing the bundle in radial direction to account for the roughness amplitudes of debonded surfaces. The properties for the cohesive surfaces such as coefficient of friction, radial strain, debond strength and fracture energy release rate are given in Table 4. The cracks in matrix were modeled by degrad-ing the properties usdegrad-ing linear isotropic damage criterion for damage evolution as inbuilt in “Abaqus Standard” algorithm (Abaqus 6.10). The element stiffness was linearly degraded, once the von-Misses stress reached 20 MPa for the particular element of matrix. The unit cells were analyzed for six independent load cases and are discussed as follows.
Table 5 Interfacial properties for fiber bundle/matrix interface (Sharma (2013)).
Coefficient of friction Debond strength Radial strain Fracture energy
0.75 3 3.87 0.05
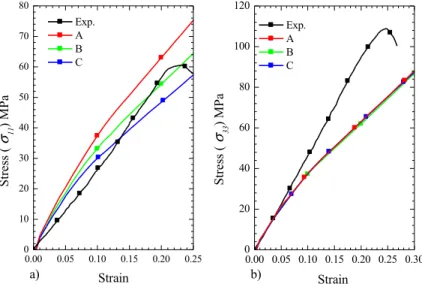
5.3 Under e11 and e33 loading
The stress-strain response of the unit cells is shown in Fig.5 for e11 and e33 loading conditions. The
response of the stresses was nonlinear nearly up to 0.1% strain and followed by an almost linear part up to peek.
0.00 0.05 0.10 0.15 0.20 0.25 0.30 0
20 40 60 80 100 120
b)
Exp. A B C
St
re
ss (
σ33
) MPa
Strain a)
0.00 0.05 0.10 0.15 0.20 0.25 0
10 20 30 40 50 60 70 80
Exp. A B C
St
re
ss (
σ11
) MPa
Strain
Figure 5 Response under a) e11, and b) e33 loading.
Latin American Journal of Solids and Structures 11(2014) 170 - 184
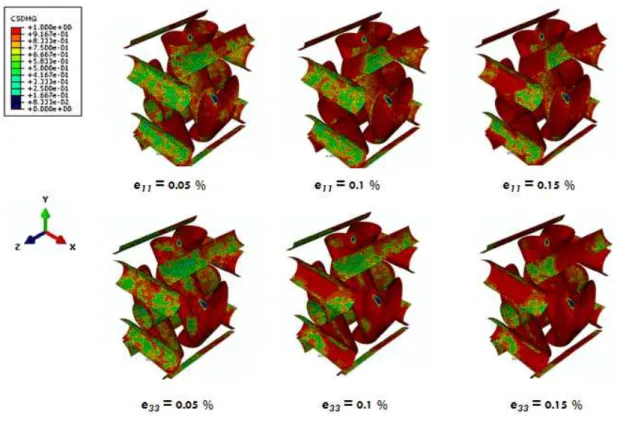
other than the bundles in x-direction was nearly completed at 0.1% of strain. Also the damage at the interfaces of x-bundles was progressed more than 50% for this strain.
Figure 6 Interfacial damage at the bundle interfaces under e11 and e33 loading.
The effect of this damage can also be observed from the stress-strain curves shown in Fig.5, be-cause there is a significant degradation in the modulus of the composite up to 0.1%. Further degra-dation at the x-bundle interfaces was complete up to 0.2% strain and a small effect of this can be observed in the stress-strain curves. The progression of the interfacial damage was observed nearly similar for both cases. The bundles parallel to loading direction had slow progressive damage rather than the bundles in other directions. Hence, the debonding was first completed at the surfaces sub-jected to mode-I failure and then progressed in mode-II. The stresses in the elements of matrix at some locations were also approached to the failure stress at 0.15 % and the fiber bundle stresses were reached to the failure stress in tension at nearly 0.22%.
5.4 Under e22 loading
The response of composite under e22 was entirely different as compared to e11 and e33 load cases.
bun-Latin American Journal of Solids and Structures 11(2014) 170 - 184
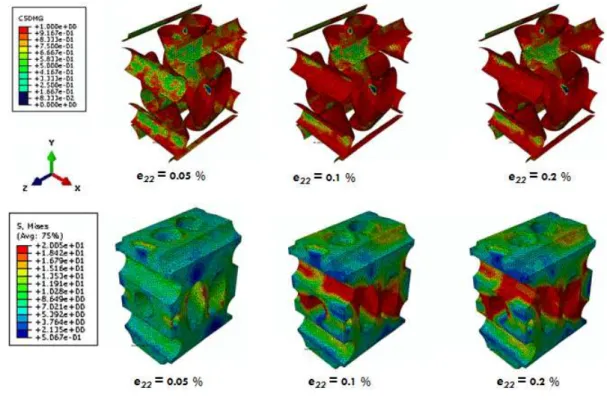
dle/matrix interfaces. The interfacial damage at the bundle/matrix interfaces is shown in Fig.8 and almost identical for all unit cells.
0 .0 0 .1 0 .2 0 .3 0 .4 0 .5
0 2 4 6 8 1 0 1 2 1 4
St
re
s
s
(
σ 22
)
M
P
a
S tra in %
A B C
Figure 7 Response of the composite under e22 loading case.
As, the surfaces were subjected to mixed mode failure at most of places, the debonding was pro-gressed much faster at the interfaces and nearly completed at 0.1%. The state of damage had not changed in some elements (Ref. green areas of strain increments 0.1 and 0.2 in Fig.8) with further increment of strain. This may be due to the change in the contact at the interfaces.
Latin American Journal of Solids and Structures 11(2014) 170 - 184
The progression of failure with the stain increments has been shown in Fig.8b. The Misses stress in few elements of matrix was approached to failure strength of matrix at 0.05% strain. Most of elements of matrix along the length of the x-directional bundle have been reached to failure strength at 0.1% strain. The further progression of failure can be observed at 0.2% strain as shown in Fig.8. This means that matrix had started taking loading from 0.5% of strain and at 0.1% of strain sufficient elements of the matrix had reached to the failure stress. This can be confirmed from the strain-strain curves as the peak was falling in between 0.05 and 0.1% strain.
5.5 Under shear loading (e12, e13, e23)
Unit cells response under shear loadings was almost identical in all the cases of shear loadings as shown in Fig.9. Figs.9a&c show that shear stress increases nonlinearly up to the peak followed by
an almost flat region in case of e13 and e23. Whereas in case of e12 loading, the post peak curve had
an increasing trend in slope (ref. Fig.9b).
0.0 0.1 0.2 0.3 0.4 0.5 0 1 2 3 4 5 6 7 8 A B C Stress ( σ23 ) MPa Strain
0.0 0.1 0.2 0.3 0.4 0.5 0 1 2 3 4 5 6 7 8 9 10 11 12 A B C E xp. Stress ( σ12 ) MPa Strain
0.0 0.1 0.2 0.3 0.4 0.5 0 1 2 3 4 5 6 7 8 9 10 c ) b) A B C E xp. Stress ( σ13 ) MPa Strain a )
Latin American Journal of Solids and Structures 11(2014) 170 - 184
The state of damage at the interface and matrix during loading at 0.05 and 0.1 % is shown in Fig10. As one can observe that the interface damage variable (CSDMG) had been reached to max-imum value for many nodes present on the bundle/matrix interfaces at 0.05% strain (see the red color on the interfaces in Fig.10a). The further progression of the damage can be observed from Fig.10a As the strain is increased to 0.1%. Most of interfaces had been damaged at 0.1% strain, however at some locations the interfacial surfaces were got locked under compressive contact and therefore no further progression of damage was observed. Mises stress in the elements of matrix at
few locations reached to failure strength at 0.05% strain in e12 loading case and it had progressed
significantly at 0.1% strain (see Fig.10).
Figure 10 Interfacial damage and Misses stress in matrix under shear loads.
The debonding was nearly completed at 0.1% strain (see in Fig.10) and the peak in the stress-strain curves was also observed near to 0.1%. Therefore initial nonlinearity in the shear stress-stress-strain
curves (ref. Fig.9) was mainly due the progression of the damage at the interfaces. In case of e12
loading, further increase in the stress from 0.1% strain was due to the contribution of the matrix.
Latin American Journal of Solids and Structures 11(2014) 170 - 184
matrix. Therefore, stress in the elements of the matrix at some location reached to failure strength (see Fig.10b). In other cases of shear, the contribution of the matrix was less and therefore the stress-strain curves had almost fatter portion in post peak region. The shear behavior of the
compo-site was also compared to the experiment carried out previously by Rao et al. (2008)b. The behavior
of the composite was identical to the experiments and shear strength of composite was obtained 7.8 MPa from simulations.
6 CONCLUSION
X-ray tomography was used to reconstruct the microstructure of 4D inplane C/C composite. The finite element meshes were reconstructed for the composite including the defects such as distortion of bundles and voids. Three unit cells were analyzed using asymptotic homogenization technique along with periodic boundary conditions. The effective initial homogenized Young’s moduli in x, y, and z directions obtained as 36.93, 25.37, and 44.32 GPa. The variation in the Young’s moduli was within 10% whereas shear moduli varied maximum upto 18%. Next, matrix cracking was modeled by degrading the properties of the matrix and interfacial damage was modeled by introducing fric-tional cohesive surfaces on the bundle/matrix interfaces. The response of the composite was
ob-served under six individual load cases. The strength of the composite obob-served very low in e22
load-ing and compare to e11 and e33 in uniaxial tension. This was mainly due to the weak interface
be-tween bundle and matrix. The interfaces were observed nearly full debonded at 0.1% strain in al-most all load cases. Therefore, the contribution of the fiber reinforcement was very less due to the interfacial damage started from the very early stage of loading.
Acknowledgement Authors are thanks full to snow and avalanche study establishment, Manali for providing the access to the X-ray tomography facility.
References
Abaqus 6.10; http//.www.simulia.com
Alfano G, Sacco E. (2006). Combining interface damage and friction in a cohesive-zone model, International Journal for Numerical Methods in Engineering 68: 542–582.
Ali J, Farooqi JK, Buckthorpe D, Cheyne A, Mummery P. (2009). Comparative study of predictive FE methods for mechanical properties of nuclear composites, Journal of Nuclear Materials 383(3): 247-253.
Aubard X, Cluzel C, Guitard L, Ladevze P. (2000). Damage modeling at two scales for 4D carbon/carbon com-posites. Computers and Structures 78 (13): 83-91.
Devi GR, Rao KR. (1993). Carbon-Carbon Composites -An Overview. Defence Science Journal 43(4): 369-383. Hain M, Wriggers P. (2008). Computational homogenization of micro-structural damage due to frost in hardened cement paste, Finite Elements in Analysis and Design 44: 233 - 244.
Jortner J. (1986). Macroporosity and interface cracking in multi-directional carbon-carbons, Carbon 24(5): 603-613.
Latin American Journal of Solids and Structures 11(2014) 170 - 184
Piat R, Tsukrov I, Mladenov N, Guellali M, Ermel R, Beck T, Schnack E, Hoffmann MJ. (2006). Material mod-eling of the CVI-in¯ltrated carbon felt II. Statistical study of the microstructure, numerical analysis and experi-mental validation. Composites Science and Technology 66(15): 2769-2775.
Piat R, Bhlke T, Dietrich S, Gebert JM, Wanner A. (2009). Modeling of effective elastic properties of car-bon/carbon laminates, Proceedings of Seventeenth International Conference on Composite Materials Edinburgh, UK.
Rao MV, Mahajan P, Mittal RK. (2008)a. Effect of architecture on mechanical properties of carbon/carbon
com-posites, Composite Structure 83:131-142.
Rao MV, (2008)b. Mechanical characterization of multi-directional carbon/carbon composites, Ph.D. Thesis,
In-dian Institute of Technology Delhi.
S. Li, (2008). Boundary conditions for unit cells from periodic microstructures and their implications, Composites Science and Technology 68: 1962-1974.
Sharma R, Mahajan P, Mittal RK. (2010). Image-based finite element analysis of 3D-orthogonal carbon-carbon composite, Proceedings of the World Congress on Engineering, London, U.K. 2:1597-1601.
Sharma R, Mahajan P, Mittal RK. (2012). Fiber bundle push-out test and image-based finite element simulation for 3D carbon/carbon composites, Carbon 50(8): 2717-2725.
Sharma R, Mahajan P, Mittal RK, (2013). Elastic modulus of 3D carbon/carbon composite using image-based fi-nite element simulations and experiments, Composite Structures, 98: 69-78.
Siron O, Lamon J. (1998). Damage and failure mechanisms of a 3-directional carbon/carbon composite under uniaxial tensile and shear loads, ActaMaterialia 46(18): 6631-6643.
SkyScan 1172, http://www.skyscan.be/home.htm.
Stefan Jansson, (1992). Homogenized nonlinear constitutive properties and local stress concentrations for compo-sites with periodic internal structure, International Journal of Solids and Structures 29(17): 2181-2200.
Szeremi V, Calvo PF, Margetts L, Mummery P. (2008). 3D image-based modeling of a carbon/ carbon compo-site, 8th World Congress on Computational Mechanics (WCCM8) Venice, Italy: June 30 - July 5.
Vorel J, Zeman J, Sejnoha M, Tomkova B. (2010). Homogenisation of plain weave Carbon/Carbon composite with imperfect microstructure, Submitted to Condensed Matter. http://arxiv.org/abs/1001.4063v3
Wolodko JD, Xia Z, Ellyin F. (2000). Analysis of Al/Al2 O3 metal matrix composites under biaxial cyclic loading using a digital image based finite element method, Material Science and Technology 16: 837-842.