Catarina Isabel de Sousa Lopes
Bachelor Degree in Human Biology
Using AFM to study erythrocytes’
biophysical properties on Stroke and
Amyotrophic Lateral Sclerosis
Dissertation to obtain the Master of Science Degree in Molecular Genetic and Biomedicine
Supervisor: Professora Doutora Filomena A. Carvalho
Júri:
Presidente: Prof. Doutora Margarida Castro Caldas Braga, FCT-UNL Arguente: Prof. Doutora Ana Cecília Roque, FCT-UNL
Orientadora: Prof. Doutora Filomena A. Carvalho, IMM
T ít u lo d a Disse rt aç ão ( Ti po de l et ra: A ri al , 10 pt no rm al ) P ri mei ro e úl ti mo no m e do cand ida to (a) ( Ti po de l et ra: A ri al , 10 pt no rm al ) 2016 Usi ng A FM to s tu d y e ry th roc yte s ’ bi op h ys ic a l prop e rtie s o n Strok e a nd A m yotrop hi c L a te ral Sc le ro s is Cata rina Is a be l de So us a L o pe s
Catarina Isabel de Sousa Lopes
Bachelor degree in Human Biology
Using AFM to study erythrocytes’
biophysical properties on Stroke and
Amyotrophic Lateral Sclerosis
Dissertation to obtain the Master of Science Degree in Molecular Genetic and Biomedicine
Supervisor: Professora Doutora Filomena A. Carvalho
Using AFM to study erythrocytes’ biophysical properties on Stroke and Amyotrophic Lateral Sclerosis
Copyright © Catarina Isabel de Sousa Lopes, Faculdade de Ciências e Tecnologia, Universidade Nova de Lisboa
The Faculty of Science and Technology and the NOVA University of Lisbon have the perpetual right, and without geographical limits, to archive and publish this dissertation through press copies in paper or digital form, or by other known form or any other that will be invented, and to divulgate it through scientific repositories, to admit its copy and distribution with educational or research objectives, non-commercial, as long as it is given credit to the author and editor.
A Faculdade de Ciências e Tecnologia e a Universidade Nova de Lisboa têm o direito, perpétuo e sem limites geográficos, de arquivar e publicar esta dissertação através de exemplares impressos reproduzidos em papel ou de forma digital, ou por qualquer outro meio conhecido ou que venha a ser inventado, e de a divulgar através de repositórios científicos, de admitir a sua cópia e distribuição com objetivos educacionais ou de investigação, não comerciais, desde que seja dado crédito ao autor e editor.
Acknowledgments
Firstly, I would like to thank Prof. Nuno C. Santos, for kindly receiving me in his research group (Biomembranes Unit), and for the opportunity to develop my project thesis. I am very grateful for all excellent working conditions that he provided in our lab, which improved my scientific education. I also thank him for believing in my capabilities to develop this project.
Secondly, I am also grateful to my awesome supervisor, Prof. Filomena A. Carvalho, with whom I worked every day, during the development of my thesis. I would like to thank for her attention and patience with me, for teaching and showing me how to do science, and for believing in my capabilities.
I also would like to thank Prof. Mamede de Carvalho and Ana Catarina Pronto Laborinho for the opportunity to work in Amyotrophic Lateral Sclerosis disease, and for the great discussions of the results included on this thesis.
I am grateful to Ana Filipa Guedes, my partner during this project, who helped me along this year, for her attention and time spent explaining some methodologies used on this project. I would also like thank Teresa Freitas, for her friendship and help during this thesis. To all the researchers of the Biomembranes Unit, especially, to Patrícia Silva, I am grateful for her friendship and for every moments in the laboratory and snapchats and dramas along the development of the thesis.
To my dear friends Filipa Gonçalves, Margarida L. Ferreira, Ana Pinto, Catarina Morgado, Mafalda Azevedo Gomes, for their friendship, adventures, patience, positive support and relaxing moments, specially during this year.
To all my friends and every people that make me be a better person.
I would like to thank all my family (grandmothers, uncle and cousins), for their positive support along this year.
Finally, a very special thanks to my parents, João and Maria, and my sister, Sara, for all their love and encouragement. Without them it will be impossible to finish this thesis.
Abstract
Stroke is the most common cause of death worldwide. It is associated with high fibrinogen levels in plasma. Fibrinogen promotes clot formation, which in some situations can promote venous thromboembolism. Amyotrophic Lateral Sclerosis (ALS) is a devastating and fatal neurodegenerative disease, leading to severe respiratory insufficiency and hypoxia.
The main goals of this study were: (i) to study the influence of fibrinogen on erythrocytes adhesion in stroke patients; and, (ii) to evaluate morphological and elasticity changes on erythrocytes from ALS patients.
Human blood samples from stroke and ALS patients were analysed and compared with healthy donors (control).
Samples were analysed by Atomic Force Microscopy (AFM) and through haemorheological parameters. AFM was used to measure fibrinogen-erythrocyte and erythrocyte-erythrocyte interactions, as well as erythrocyte stiffness and morphology. Erythrocyte membrane fluidity and zeta-potential were also assessed on ALS.
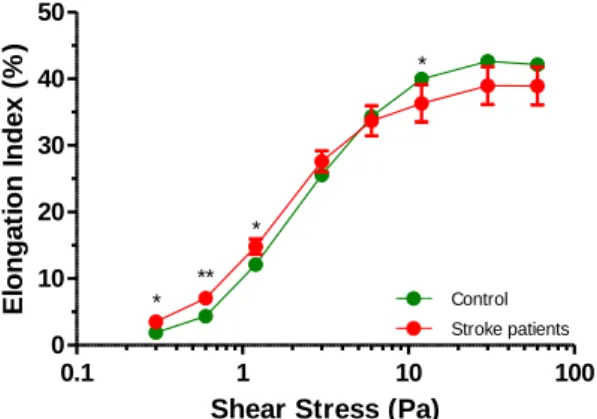
Erythrocytes from stroke patients are less deformable and have more propensity to aggregate. Fibrinogen-erythrocytes interactions on stroke are stronger than for the control group. They also have an increased concentration of ´ fibrinogen variant. These changes could be associated with high risk of cardiovascular events and a worst prognostic of the disease.
Erythrocytes from ALS patients are more capable to deform and present morphological changes. Changes in erythrocytes physical-chemical and electrical properties and on their membrane organization were also observed.
These findings could help to consider the fibrinogen-erythrocyte binding as a new cardiovascular risk factor for stroke disease. Understanding the role of fibrinogen on erythrocyte aggregation may be relevant for potential future drug interventions to reduce aggregation and enhance microcirculatory flow conditions. Fibrinogen in ALS disease could promote venous thrombotic events. In the future, finding a molecular biomarker of early respiratory dysfunction in ALS disease that could comprise prognostic value will be essential.
Keywords: Stroke; Amyotrophic Lateral Sclerosis (ALS); Atomic Force Microscopy (AFM); Erythrocyte; Fibrinogen.
Resumo
O acidente vascular cerebral (AVC) é a maior causa de morte mundial. A ele estão associados elevados níveis de fibrinogénio plasmáticos. O fibrinogénio promove o processo de coagulação sanguínea, podendo nalgumas situações conduzir a tromboembolismo venoso. A Esclerose Lateral Amiotrófica (ELA) é uma doença neurodegenerativa fatal, podendo conduzir a insuficiência respiratória e hipóxia.
Os principais objetivos deste estudo foram: (i) estudar a influência do fibrinogénio na adesão eritrocitária em doentes com AVC; (ii) avaliar alterações morfológicas e de elasticidade nos eritrócitos de doentes com ELA.
Amostras de sangue humano de doentes com AVC e ELA foram comparadas com amostras de dadores saudáveis (controlo). Estas foram analisadas por microscopia de força atómica (AFM) e por parâmetros hemorreológicos. Por AFM estudaram-se interações fibrinogénio-eritrócito e adesão eritrócito-eritrócito, assim como a elasticidade e morfologia eritrocitárias. A fluidez da membrana e o seu potencial zeta foram também avaliados na ELA.
Os eritrócitos de doentes com AVC são menos deformáveis e têm mais propensão para agregar. As interações fibrinogénio-eritrócito são mais fortes que no grupo controlo. Estes doentes têm também um aumento da concentração de fibrinogénio ´. Estas alterações poderão estar associadas ao elevado risco de eventos cardiovasculares e ao mau prognóstico da doença.
Os eritrócitos de ELA são mais deformáveis e têm alterações morfológicas. Alterações físico-químicas e das propriedades elétricas dos eritrócitos, bem como da sua membrana foram também observadas. Estes resultados permitem identificar a interação fibrinogénio-eritrócito como novo fator de risco cardiovascular em AVC. O papel do fibrinogénio na agregação eritrocitária poderá ser relevante na futura utilização de fármacos que reduzam a agregação e melhorem a microcirculação. Em ELA, o fibrinogénio poderá promover tromboembolismo venoso. O desenvolvimento de um biomarcador molecular precoce de disfunção respiratória na ELA com valor no prognóstico da doença é assim essencial.
Palavras-Chave: Acidente Vascular Cerebral (AVC); Esclerose Lateral Amiotrófica (ELA); Microscópio de Força Atómica; Eritrócito; Fibrinogénio.
Table of Contents
Acknowledgments ... V Abstract ... VII Resumo ... IX Table of Contents ... XI List of Figures ... XIII List of Tables ... XV Abbreviations ... XVII
I) General Introduction ... 1
1) Stroke ... 1
1.1) Cardiovascular Risk Factors ... 2
2) Erythrocytes ... 3
3) Fibrinogen ... 4
3.1) Total Plasma Fibrinogen ... 4
3.2) γ’ Fibrinogen ... 8
4) Amyotrophic Lateral Sclerosis ... 10
5) Atomic Force Microscopy ... 13
5.1) Atomic Force Microscopy Applications ... 14
II) Objectives ... 19
III) Material and Methods ... 19
1) Blood collection ... 19
2) Haemogram ... 20
3) Human Blood Cells Isolation ... 20
4) Atomic Force Microscopy ... 20
4.1) AFM Scanning Images of Human Blood Cells ... 20
4.2) AFM – based Force Spectroscopy ... 21
5) Haemorheological Parameters ... 23
5.1) Erythrocyte Deformability ... 24
5.3) Whole Blood Viscosity ... 27
6) Fibrinogen Quantification ... 28
6.1) Total Plasma Fibrinogen Quantification ... 28
6.2) γ’ Fibrinogen Quantification ... 29
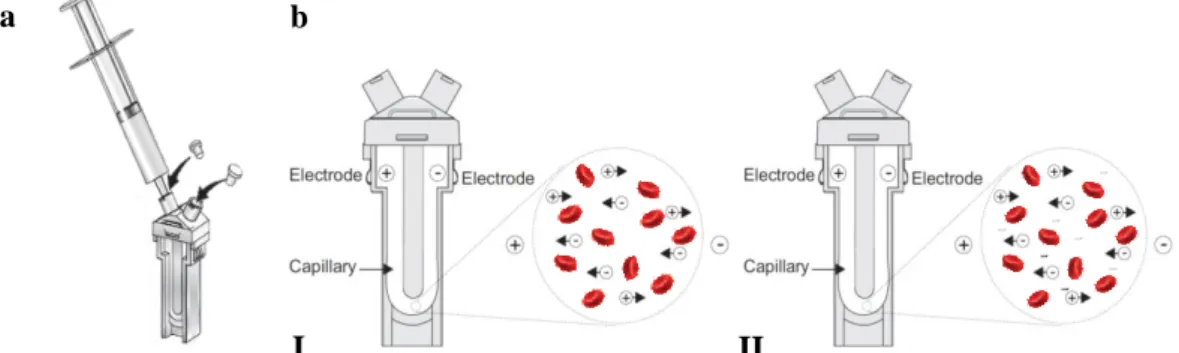
7) Zeta-Potential ... 30
7.1) Introduction of the method ... 30
7.2) Samples preparation and measurement ... 31
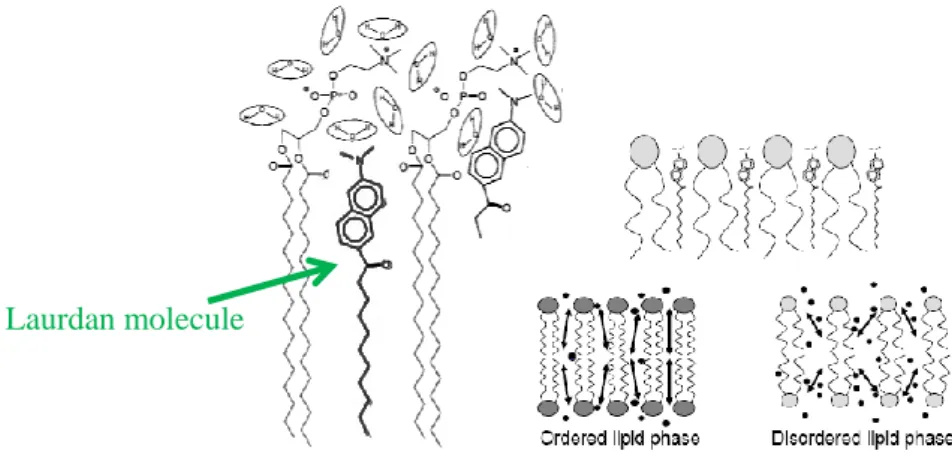
8) Fluorescence Generalized Polarization ... 32
8.1) Introduction of the method ... 32
8.2) Samples Preparation and Measurement ... 33
9) Statistical Analysis ... 34
IV) Results and Discussion ... 35
1) Results with Stroke patients ... 35
2) Results with Amyotrophic Lateral Sclerosis patients ... 43
2.1) Special clinical cases ... 50
V) General Conclusions and Future Work ... 59
List of Figures
Figure I.1 ... 1 Figure I.2 ... 1 Figure I.3 ... 2 Figure I.4 ... 4 Figure I.5 ... 5 Figure I.6 ... 5 Figure I.7 ... 6 Figure I.8 ... 7 Figure I.9 ... 7 Figure I.10 ... 8 Figure I.11 ... 9 Figure I.12 ... 11 Figure I.13 ... 13 Figure I.14 ... 14 Figure I.15 ... 15 Figure I.16 ... 17 Figure I.17 ... 18 Figure III.1 ... 23 Figure III.2 ... 24 Figure III.3 ... 25 Figure III.4 ... 28 Figure III.5 ... 29 Figure III.6 ... 31 Figure III.7 ... 31 Figure III.8 ... 33 Figure IV.1 ... 35 Figure IV.2 ... 36 Figure IV.3 ... 37 Figure IV.4 ... 38 Figure IV.5 ... 38 Figure IV.6 ... 39 Figure IV.7 ... 40 Figure IV.8 ... 41 Figure IV.9 ... 44 Figure IV.10 ... 44Figure IV.11 ... 45 Figure IV.12 ... 46 Figure IV.13 ... 46 Figure IV.14 ... 47 Figure IV.15 ... 48 Figure IV.16 ... 48 Figure IV.17 ... 49 Figure IV.18 ... 50 Figure IV.19 ... 51 Figure IV.20 ... 52 Figure IV.21 ... 52 Figure IV.22 ... 53 Figure IV.23 ... 53 Figure IV.24 ... 55 Figure IV.25 ... 55
List of Tables
Table IV.1 ... 43 Table IV.2 ... 54
Abbreviations
AFM
Atomic Force Microscopy ALS
Amyotrophic Lateral Sclerosis AMI
Acute Myocardial Infarction APTES
3-aminopropyl-triethoxysilane
BIOTIN-BSA
Biotinylated Bovine Serum Albumin BSGC
Buffered Saline Glucose-Citrate CHD
Coronary Heart Disease CV Cardiovascular CVD Cardiovascular Disease DMSO Dimethyl sulphoxide ECM Extracellular Matrix ELISA
Enzyme-Linked Immunosorbent Assay FALS
Familial Amyotrophic Lateral Sclerosis
GP Generalized Polarization JC Junctional Complex LAURDAN 2-dimethylamino-6-lauroylnaphthalene MND
Motor Neuron Disease PBS
Phosphate Buffered Saline RBC
Red Blood Cell SEM
Standard Error of the Mean SALS
Sporadic Amyotrophic Lateral Sclerosis SCFS
Single-Cell Force Spectroscopy SMFS
Single-Molecule Force Spectroscopy SOD
Super Oxide Dismutase TF
Tissue Factor VTE
I) General Introduction
1) Stroke
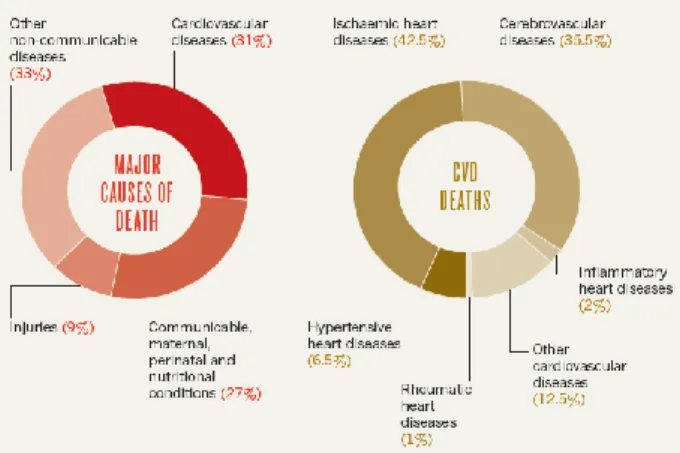
The cardiovascular diseases (CVD) are the most common cause of death in the world. In 2012, it was estimated that 17.5 million people died from CVD, from which an estimated 7.4 million deaths were due to coronary heart disease and 6.7 million were due to stroke (World Health Organization, 2016). Coronary heart disease (CHD) and stroke are prevalent in the world, and 35%–65% of all deaths can be traced to CVD (vd. Figure I.1). Typically, the rate of CHD deaths exceeds that of stroke by a ratio from 2:1 to 3:1. During this period, average life expectancy surpasses 50 years. Roughly, 35% of the world's population falls into this category (Longo et al., 2012).
Figure I.1 - Cardiovascular diseases are the main cause of death in the world (31%). The ischaemic heart diseases and the
cerebrovascular diseases promote the major part of the CVD deaths. Adapted from (Cannon, 2013).
In Portugal, cardiovascular diseases are also the leading cause of death. In 2012, 32,859 people died from CVD; from those, 14,393 were male and 18,466 female (Sociedade Portuguesa de Cardiologia, 2015).
By 2030, when the world population is expected to reach 8.2 billion, 33% of all deaths are expected to be of CVD (v.d. Figure I.2). Also, it is expected that 14.9% of deaths which will occur in men and 13.1% of deaths occur in women will be due to CHD. Stroke is being responsible for 10.4% of all male deaths and 11.8% of all female deaths (Longo et al., 2012).
Figure I.2 - By 2030, it is expected that cancer, ischaemic heart disease and stroke will be responsible for an increase of
The development of a clot in the coronary or cerebral circulation is the cause of an acute myocardial infarction or ischaemic stroke, respectively (Jackson, 2011). Acute myocardial infarction (AMI) and stroke are the most frequent cardiovascular diseases. In real life, stroke does not always have an announcement. It can be silence and quick. Acute events are mainly caused by a blockage of blood circulation that prevents blood from flowing to the heart or brain. This process is mainly due to atherosclerosis. Atherosclerosis happens when coronary arteries, which supply the heart with blood, slowly become thicker and harder from a build-up of fat, cholesterol and other substances, forming an atherosclerotic plaque. If an atherosclerotic plaque ruptures, a blood clot can be formed, and it can travel through the bloodstream, where it can lodge on the artery of the brain, blocking the flow of the oxygen-rich blood. When the blood flow is blocked, the supply of oxygen does not reach part of brain cells and these are damaged or die (Sociedade Portuguesa de Cardiologia, 2015).
Stroke can also be caused by bleeding from a blood vessel in the brain or from blood clots (World Health Organization, 2016). As, it can be seen in Figure I.3, stroke is caused by the disruption of the blood supply to the brain. This may result from either blockage (ischaemic stroke) or rupture of a blood vessel (haemorrhagic stroke) (World Health Organization, 2002).
Figure I.3 - Process of a blood clot blocking the blood flow, in the brain artery. When this process occurs, blood flow is
blocked, promoting a stroke.
Figure from (http://www.ncbi.nlm.nih.gov/pubmedhealth/PMH0063013/bin/stroke_ischemic.jpg).
1.1) Cardiovascular Risk Factors
The evaluation of novel risk factors can help to identify individuals at higher cardiovascular risk. The prevention of CVD focuses on identifying and managing risk factors, both on the entire population and at individual levels through primordial, primary and secondary prevention. Other causes of CVD are usually the presence of a combination of risk factors, such as unhealthy diet, obesity, physical inactivity, tobacco and alcohol habits. These CV risk factors may lead to other clinical complications, such as hypertension, diabetes mellitus and hyperlipidaemia (Sociedade Portuguesa de Cardiologia, 2015). At the individual level, for the prevention of the first cases of cardiovascular disease, individual
health-care intervention needs to be targeted to those at high cardiovascular risk and high risk factor levels. For the secondary prevention of cardiovascular diseases, medication becomes necessary. Studies concerning high levels of fibrinogen in blood plasma have associated it with a wide variety of thrombotic diseases, such as stroke. Fibrinogen has been identified as a major independent risk factor for cardiovascular disease (De Oliveira et al., 2012). High fibrinogen levels promote fibrin formation and it is a major contributor to plasma viscosity (Stec et al., 2000). Increased levels of plasma fibrinogen result in changes in blood rheological properties, and these alterations exacerbate the complications in peripheral blood circulation during cardiovascular pathologies. Erythrocyte aggregation is also important, together with fibrinogen and lipids concentration on plasma to understand the risk of primary and secondary cardiovascular events. The interaction between fibrinogen and erythrocytes could be an important indicator of a high cardiovascular risk.
2) Erythrocytes
Erythrocytes, or red blood cells (RBC), are the most abundant cell type in blood. They are flexible, biconcave, enucleate cells derived from bone marrow. Erythrocytes circulate at 4.2-6.1×10⁹ cells/mL in humans, having men slightly higher values than women. Erythrocytes are highly specialized cells that carry oxygen from the lungs to the body cells and tissues to the lungs via its haemoglobin-rich cytoplasm (Baskurt & Meiselman, 2003; Dzierzak & Philipsen, 2013; Aleman et al., 2014). Human erythrocytes have an in vivo life span of approximately 120 days and they are selectively removed from circulation via phagocytosis. During its life span, the erythrocyte undergoes progressive physical and chemical changes, such as the decrease on cell volume with cell aging. This is presumably due to the loss of potassium and the loss of membrane patches by microvesiculation, resulting in an increase on cell density (Carvalho et al., 2011).
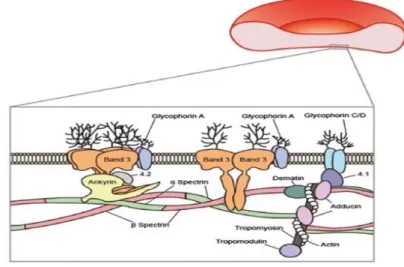
Usually, mature erythrocytes are biconcave disks, with about 8 μm in diameter, however erythrocytes can measure between 6.6 to 7.5 μm. Healthy erythrocytes have a thickness of 2 μm, surface area of 135 µm2 and volume of 90 fL. They are composed by haemoglobin (32%), water (65%), and membrane tissue (3%) (Yurkin et al., 2005). The erythrocyte membrane is composed of a lipid bilayer, transmembrane proteins, and a filamentous meshwork of proteins that forms a membrane skeleton along the entire cytoplasmic surface of the membrane, as it can be seen in Figure I.4. The erythrocyte membrane skeleton has spectrin as its most abundant protein, which forms long, flexible heterodimers through the lateral association between chains. These chains can form heterotetramers that bind a junctional complex (JC) composed of F-actin, protein 4.1 and the actin-binding proteins dematin, adducin, trompomyosin and tropomodulin. Spectrin and actin are two main structural proteins and, together, form a submembranous cytoskeletal meshwork. It is responsible for the viscoelastic properties of the erythrocyte membrane. Band 3, or the anion channel, other compound of the erythrocyte membrane, is a major transmembranous protein involved in the transport of water and
anions. It is a carrier of the blood-group-I antigen. Glycophorin A, a sialic acid-rich glycoprotein, is the major contact or receptor membrane polypeptide that also spans the lipid bilayer. This network is tethered to the cell membrane at two sites: one mediated by ankyrin, that couples spectrin to band 3, and the other mediated by protein 4.1, that couples the junctional complex to glycophorin C/D (Kim et al., 2015).
Figure I.4 - The erythrocyte membrane is composed by a lipid bilayer, transmembrane proteins and a filamentous meshwork
of proteins that forms a membrane skeleton along the entire cytoplasmic surface of the membrane. Membrane proteins are also asymmetrically oriented within the lipid bilayer and can be divided into three functional sets: structural, catalytic and receptor proteins. Figure from (Kim et al., 2015).
3) Fibrinogen
3.1) Total Plasma Fibrinogen
Fibrinogen is a natural occurring protein in human blood. It is a large, complex and multifunctional plasma glycoprotein synthesised by hepatocytes (Mannila et al., 2007) in the liver that is essential for haemostasis (stopping blood loss from damaged tissues), wound healing, fibrinolysis, inflammation, angiogenesis, cellular and matrix interactions, and neoplasia (Averett & Schoenfisch, 2010; De Oliveira et al., 2012). Normally, fibrinogen in circulation has concentrations ranging from 2 to 4 mg/mL (6-12 µM) (De Oliveira et al., 2012; Ariëns, 2013; Aleman et al., 2014), but people usually carry about 2.5 mg/mL of blood (Xu & Siedlecki, 2009). Sometimes, fibrinogen can circulate in excess, up to 7 mg/mL during acute inflammation (Wolberg, 2016). Fibrinogen is the third most abundant plasma protein and plays a prominent role on the development of surface-induced thrombosis due to its multi-functional role in serving as a ligand for platelet adhesion, linking platelets together into aggregates and stabilizing thrombi by forming a fibrin polymer (Xu & Siedlecki, 2009; Ariëns, 2013). Elevated fibrinogen levels are associated with increased risk of cardiovascular disease, primarily linked to myocardial infarction and stroke (Lovely et al., 2010; Kotzé et al., 2014; Domingues et al., 2016; Wolberg, 2016).
Fibrinogen is a dimeric 340 kDa plasma protein, composed by three pairs of polypeptides chains with bilateral symmetry (Aα2, Bβ2 and γ2) and 29 disulphide bonds (Mannila et al., 2007; Ariëns, 2013). Fibrinogen has an isoelectric point of about 5.5 at physiological conditions (vd. Figure I.5).
Figure I.5 - Fibrinogen molecule. The polypeptides chain pairs are formed by Aα (blue), Bβ (red) and γ (green). They are
oriented so that all six N-terminal ends meet to form the central E domain. Two regions of coiled-coil α helices stretch out on either side of the E domain. Each coiled-coil region ends in a globular D domain, containing the C-terminal ends of Bβ and γ chains, as well as part of Aα chain. The C-terminal end of the Aα chains protrudes from each D domain as a long strand (Mannila et al., 2007; Averett & Schoenfisch, 2010). The β- and γ-nodules are homologous and each of them contains three distinct globular domains. Adapted from (Zhmurov et al., 2011).
Fibrinogen is involved in the coagulation cascade that leads to blood clotting, and it has a rapid response to tissue damage. Blood coagulation is a complex process that involves many collective players and factors. The physiological process of blood clotting and the subsequent dissolution of the clot, after repair of the injured tissue, are essential components of blood haemostasis (Wagner et al., 2013). The coagulation cascade has been divided in two pathways: the intrinsic and the extrinsic pathways, this last one also named tissue factor pathway (Kilinç et al., 2011). After the damage of a vessel wall, there is the exposure of tissue factor (TF) to the bloodstream, initiating a fast cascade system (vd. Figure I.6).
Figure I.6 - Blood coagulation cascade.
(Adapted from http://www.ebi.ac.uk/interpro/potm/2006_11/Page1.htm).
The coagulation cascade begins with a tissue factor, known by thromboplastin, which is a 47 kDa protein expressed in both vascular and nonvascular cells. The tissue factor in circulation activates many other factors initiating the cascade. When the complex is in the presence of factor Va and calcium, factor Xa catalyses the conversion of prothrombin (FII) to thrombin (FIIa). Thrombin converts fibrinogen to fibrin, thereby leading to fibrin deposition, platelet activation and formation of a thrombus (Zhmurov et al., 2011). The activation of factor XIII to factor XIIIa can stabilise blood clots by cross-linking them (Steffel et al., 2006; Kilinç et al., 2011).
Fibrin clots are proteinaceous gels that polymerize in the blood, as a consequence of the biochemical cascade presented above, at sites of vascular injury. Together with platelets, this meshwork stops the bleeding and supports active contraction during wound healing (Brown et al., 2009).
Fibrin is the main contributor for cardiovascular disorders. The plaque rupture can provide a scaffold for thrombi. Clots block blood vessels and cause tissue damage, leading to myocardial infarction, ischaemic stroke, or other cardiovascular diseases (Brown et al., 2009; Stefanelli & Barker, 2015). The process of conversion of fibrinogen to fibrin, namely the molecular mechanism that occurs when a blood clot is formed, is presented in Figures I.7 and I.8. Fibrinogen contains the central E region or domain, which includes the cleavage sites for thrombin. The E region is connected with two D domains that contain binding pockets important for polymerization. The elasticity of fibrinogen result by the connection of D and E regions through two coiled coil chains (Ariëns, 2013). Both these domains contain important binding sites for the conversion of fibrinogen to fibrin, fibrin assembly and crosslinking, and platelet aggregation. The calcium ions are important to help maintaining the structure of fibrinogen. The N-terminus of Aα and Bβ polypeptides are cleaved by thrombin in order to turn soluble fibrinogen into gel-forming fibrin. Once cleaved from fibrinogen, the N-terminal ends are known as fibrinopeptide A (from Aα polypeptide) and fibrinopeptide B (from Bβ polypeptide). It is known that fibrinogen is a component of the coagulation cascade as well as a determinant in plasma viscosity and erythrocyte aggregation (De Oliveira et al., 2012).
Figure I.7 - Conversion of fibrinogen to fibrin. First, fibrinogen can be cleaved by serine protease thrombin to remove the
fibrinopeptides A (blue chain) and B (pink chain), from the central N-terminal disulphide knot ends of Aα and Bβ. This can expose the terminal ends on the E domain, enabling the interaction with the holes (“a” and “b”) present on the D domains. Thereby, the fibrinogen monomers are transformed in fibrin. Adapted from (Stefanelli & Barker, 2015).
The Aα protuberances can interact with each other and with the E domain of the fibrinogen molecule during fibrin clot crosslinking (Mannila et al., 2007; Averett & Schoenfisch, 2010). Fibrinopeptide A is cleaved at a faster rate than fibrinopeptide B. Fibrinopeptide A exposes a binding site (GPR) on the fibrin E region for a specific binding of one fibrin molecule with two other fibrin molecules (Ariëns, 2013).
Figure I.8 - Fibrin protofibril formation process. Fibrin molecules can link together through the interaction of the E domain
on one fibrin molecule to the D domains on other fibrin molecules, thereby polymerising to form staggered oligomers that build up into protofibrils. The knobs “A” (blue colour) are as prominent as knobs “B”(pink colour) for protofibril formation. The non-covalent knobs “A” are exposed more rapidly, but the knobs “B” are more important for the lateral aggregation of protofibrils. As the fibrin oligomers aggregate, these protofibrils continue to lengthen to make long fibres that can wind around one another to make multi-stranded, thick bundles, and which can branch into a 3-dimentional network of entangled fibres, the fibrin clot. When the transglutaminase factor XIII (FXIIIa) is activated and stabilised subsequently by crosslinking with adjacent D regions within a protofibril form DD-Dimers. This occurs between the C-terminal ends (Aα protuberances) of the Aα polypeptides, as well as (more slowly) at other sites, such as between the C-terminal ends of γ chains (green colour). Only Aα and γ chains become crosslinked by FXIIIa. When fibrin is cleaved by plasmin, the resulting products are DD(E) complex, DD-dimer and E-fragment. Adapted from (Stefanelli & Barker, 2015).
When fibrinopeptide B is cleaved by thrombin, it exposes a second binding site (GHR) in the E region. Other specific binding pocket in the fibrin D region results from the release of the αC region, causing a tether along the fibrinogen E region, which becomes available for intermolecular interactions between fibrin molecules. These interactions contribute to lateral aggregation between protofibrils and fibrin fibres (Stefanelli & Barker, 2015).
When a blood vessel is damaged, platelets prevent the occurrence of extensive bleeding, with the formation of a blood clot, kept together by a dense fibrin network (Carvalho et al., 2015).
The fibrin network structure depends of fibrinogen and thrombin concentration. In the presence of high fibrinogen levels, the density of the fibrin network increases, as well as the clot stiffness, and the resistance of the clots to fibrinolysis (Aleman et al., 2014). Fibrinogen can also mediate platelet aggregation and adhesion. It has two recognition binding sites sequences for platelet receptor: RGD, on the Aα subunits, and a carboxyl-terminal peptide on the γ subunits. The fibrinogen-platelet binding, essential for coagulation, depends on the platelet membrane receptor glycoprotein αIIbβ3 (Carvalho et al., 2011). This is the major integrin on platelets. It is essential for platelets aggregation and is centrally involved in haemostasis and thrombosis (Ma et al., 2007).
Figure I.9 - Fibrinogen molecule with different recognition binding sites for distinct integrin receptors (αIIbβ3 andαVβ3).
Increased fibrinogen concentration and erythrocyte aggregation are factors that significantly increase the risk of cardiovascular and cerebrovascular diseases. Fibrinogen binding to the αIIbβ3 receptor requires calcium to activate the integrin complex. The effect of the absence of calcium is more pronounced for the fibrinogen-platelet system than for erythrocytes. Thus, the erythrocyte receptor for fibrinogen, is not as calcium dependent and as influenced by the presence of the eptifibatide as the platelet receptor. Its inhibition by eptifibatide indicates that the receptor for fibrinogen on erythrocytes is not the glycoprotein αIIbβ3, but a related integrin (Carvalho et al., 2010).
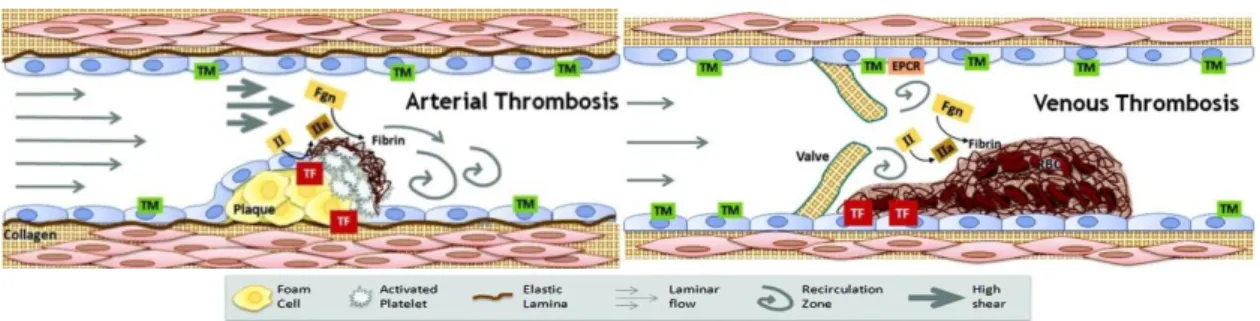
It is known that the arterial thrombi have high levels of platelets and venous thrombi are mostly constituted by erythrocytes and fibrin (Aleman et al., 2014). In blood clot formation, erythrocytes are the major component of the thrombus. Venous thromboembolism is the third most common cardiovascular illness, after acute coronary syndrome and stroke (Wagner et al., 2013).
Figure I.10 - Clots on arterial thrombosis can be called white clots, because they are mainly constituted by platelets.
Accordingly, clots on venous thrombosis can be called red clots, due to their content in erythrocytes and fibrin (Aleman et
al., 2014). TM – thrombomodulin; EPCR – endothelial protein C receptor; II – prothrombin; IIa – thrombin; TF – tissue
factor; Fgn – fibrinogen; RBC – red blood cells.
(Figures from https://www.med.unc.edu/wolberglab/images/arterial%20thrombosis.jpg/@@images/83373353-123c-476d-af5c-97773048fac3.jpeg and https://www.med.unc.edu/wolberglab/images/venous%20thrombosis.jpg/image_preview).
3.2) γ’ Fibrinogen
Fibrinogen in plasma is a heterogeneous mixture of isoforms with different relative proportions. Fibrinogen variants are the result of alternative splicing of the γ-chain. mRNA processing and post-translational modifications give rise to several different fibrinogen isoforms with widely varying characteristics. The γ’ isoform arises from alternative mRNA processing, leading to the substitution of the last 4 amino acid residues of the carboxyl terminal, by another 20-amino acid residues sequence. This is originated by the introducing of 20 new residues at the γ-chain C terminus by the open reading frame from intron 9, replacing 4 residues encoded by exon 10 followed by a stop codon. Thus, the fibrinogen γ chain has 2 isoforms: the gamma A (γA or simply γ) isoform and the gamma-prime (γ’ or γB) isoform. Therefore, at the level of the γ-chain the fibrinogen molecule can be a homodimer (γA/γA) that constitutes approximately 84% of the total plasma fibrinogen concentration, an heterodimer (γA/γ’) that are present in approximately 15% or an homodimer (γ’/γ’) that constitutes the remaining 1% of fibrinogen concentration (Lovely et al., 2010; Ariëns, 2013; Domingues et al., 2016; Macrae et al., 2016).
Figure I.11 - Proposed model of the γ’-chain of the fibrinogen molecule. The 20 amino acid extension of the γ′-chain is
located at the C-terminus, on the D region of the fibrinogen molecule (red region). The 20 amino acid may extend the fibrinogen molecule 30 to 40 Å. Figure from (Macrae et al., 2016).
The γ’ fibrinogen has several biochemical and biophysical properties that distinguish it from the more common γA isoform. This fibrinogen variant, has been reported to have more affinity on the binding to thrombin (Ariëns, 2013). It has been associated with a non-uniform clot structure with prolonged clot lysis time (Kotzé et al., 2014) and with various biological functions which are disclosed upon fibrin clot formation. When the fibrin clots are formed in the presence of γ’-chain fibrinogen variant, they are most resistant to fibrinolysis (Mannila et al., 2007; Domingues et al., 2016). Furthermore, the γ’ chain contains a binding site for thrombin, and clots made from γ’ fibrinogen have been reported to have altered clot architecture. γ’ fibrinogen forms thinner but denser fibrin fibres. Possibly as a result of these properties, recent studies suggest that γ’ fibrinogen is a risk factor for cardiovascular disease. This fibrinogen variant has been associated with the extent and severity of coronary artery disease and an increase risk of arterial thrombosis, myocardial infarction and stroke (Mannila et al., 2007; Domingues et al., 2016; Macrae et al., 2016).
4) Amyotrophic Lateral Sclerosis
Amyotrophic lateral sclerosis (ALS) is a devastating and fatal neurodegenerative disorder, characterized by rapid and progressive degeneration of motor neurons in the spinal cord, brainstem and motor cortex (Pronto-Laborinho et al., 2014), which results in muscle atrophy, paralysis and death (D’Angelo et al., 2013). ALS patients die mainly from respiratory failure, related to weakness of diaphragm and other respiratory muscles (Pronto-Laborinho et al., 2014).
The worldwide incidence of ALS is between 1.5 and 2.5 per 100,000 persons per year, with a male/female ratio of 3:2. Most patients have first symptoms between 55-65 years and the median survival expectancy of ALS patients is 3-5 years after symptom onset (Pronto-Laborinho et al., 2014; Kioumourtzoglou et al., 2015).
Most ALS cases are sporadic (SALS) (90-95%); the remaining 5-10% of patients have a positive family history for ALS or frontotemporal dementia (FALS) (Pronto-Laborinho et al., 2014; Kioumourtzoglou et al., 2016). More than 16 dysfunctional genes have been described in FALS, and approximately 20% of FALS patients have a missense mutation in the gene encoding the enzyme Cu/Zn super oxide dismutase (SOD1) (Pronto-Laborinho et al., 2014).
ALS can have spinal, bulbar, respiratory, axial or diffuse form. ALS cases increase with increasing age (Kioumourtzoglou et al., 2015).
Riluzole is the only drug currently approved in ALS, acting by decreasing glutamate activity in the central nervous system, which increases life expectancy on about 3-6 months. The etiology of ALS pathogenesis is complex and not completely understood. The mechanisms of the disease comprises oxidative stress, excitotoxicity, protein aggregates, mitochondrial dysfunction, neuroinflammation, cytoskeletal derangements, deregulated growth factors, impaired axonal transport and apoptosis, abnormal calcium metabolism and activation of proteases and nucleases (Pronto-Laborinho et al., 2014).
Several clinical prognostic factors have been identified in ALS, such as age, site of onset, functional and respiratory status, cognitive function, non-invasive ventilation, some genetic mutations, and clinical phenotypes (Chiò et al., 2014; Kioumourtzoglou et al., 2015).
Previously, the main causes of death in ALS patients were respiratory problems, including respiratory muscle paralysis and bronchopneumonia (Tanaka et al., 2013). Some patients with respiratory-dependent ALS die of sudden cardiac arrest or anoxic encephalopathy following circulatory collapse, which may be associated with sympathetic hyperactivity (Tanaka et al., 2013). However, recent studies, related that exist an inverse association between cardiometabolic health and ALS disease (Kioumourtzoglou et al., 2015).
Other studies have demonstrated a protective association between ALS incidence and cardiovascular risk factors such as obesity, higher cholesterol levels and hyperlipidaemia. Diabetes has been associated with high levels of uric acid that prolonged survival in ALS (Kioumourtzoglou et al., 2015,
2016). Various biomarkers have been proposed as potentially related to a better ALS outcome, including dyslipidaemia, elevated levels of uric acid and creatinine, and reduced granulocyte count (Chiò et al., 2014).
Venous Thromboembolism (VTE), a cardiovascular risk, is also associated with ALS disease. Neurologic diseases that affect lower limb function are described as risk factors for venous thromboembolism. ALS has several risk factors for VTE, such as reduced mobility, increased age and progressive respiratory failure. Thus, VTE is common in ALS patients (Gladman et al., 2014). Therefore, VTE is considered as a complication of ALS, and it is highly correlated with leg functions (Berry & Korngut, 2014).
On another study, performed by Namazi et al. (2014), one ALS patient was diagnosed with heart failure at the final stage of the disease. However, the association between ALS and cardiovascular disease is rare and underdiagnosed, because symptoms are masqueraded as a result of the patients’ disability. Cardiac denervation related to involvement of the sympathetic nervous system has been depicted in patients in the early stages of ALS. Other studies indicated some metabolic abnormalities in central nervous system and systemic circulation. The sympathetic hyperfunction and vagal hypofunction of the cardiovascular system have a subclinical role in ALS patients (Chida et al., 1989).
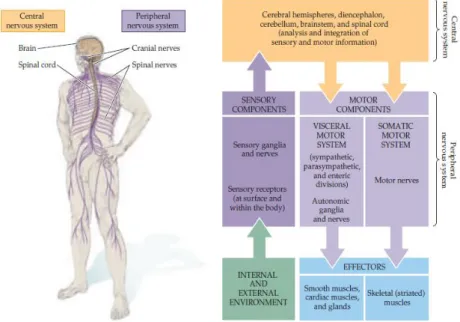
Figure I.12 - Regions of the nervous system that can be affected in ALS disease. All the nervous system has interrelation and
when the upper and lower motor neurons undergo degeneration, other components can also be affected (Purves et al., 2004).
The motor neuron disease (MND) phenotype, that has been described to involve the sympathetic nervous system, can also be attributable to cardiac denervation in patients in the early stages of ALS. This result is related with the fact that the levels of norepinephrine and epinephrine are increased in ALS patients (Gdynia et al., 2006). Symptoms of an autonomic dysfunction are not a characteristic of ALS, although there are reports of cardiac arrhythmia (Sachs et al., 1985).
ALS can also lead to total paralysis and respiratory failure. Knowing that ALS patients frequently have respiratory failure, the diagnosis and treatment of cardiac arrhythmias revealed to be difficult. ALS affects the autonomic nervous system, which contributes for regulation of heart rate, blood pressure and others homeostatic functions. Thus, the cardiovascular autonomic dysfunction contributes to the morbidity of the disease. As previously described, sympathetic predominance with vagal withdrawal tends to occur in early stages of ALS disease. At these stages of the disease, the most common symptom is sinus tachycardia. Bradycardia results from sympathetic denervation. However, in advanced ALS, the spinal cord sympathetic ganglia (known as the intermediolateral nucleus) also undergo degeneration. In addition to late central sympathetic failure, there is also degeneration of peripherally mediated sympathetic nerves (Shemisa et al., 2014).
5) Atomic Force Microscopy
Atomic Force Microscopy (AFM) is a technique that can be used for high-resolution real-time studies. It can both measures properties of molecules at the nanoscale and of dynamic changes in biological systems, such as cells, viruses and bacteria (Kim et al., 2003; Karagkiozaki et al., 2008; Variola, 2015). AFM has contributed to nanomedicine with developments in nanodiagnostics and nanotherapeutics, contributing to the improvement of relevant healthcare processes (Carvalho et al., 2015).
Atomic force microscopy is a surface probe technique that uses a soft cantilever to image surfaces or to measure or apply forces while interacting with them (Cazaux et al., 2016). AFM key element is a small and flexible cantilever controlled in the z-direction by a piezoelectric crystal. The cantilever acts like a spring to measure the force between the tip and the sample’s surface (Averett & Schoenfisch, 2010). The sharpened tip is brought into contact with the sample and moved across the surface. The instrument measures the deflection of the cantilever as it scans, and from this information about the tip movement a pseudo-three-dimensional image of the sample is built up (JPK Instruments AG, 2012; Variola, 2015) (vd. Figure I.13a).
Figure I.13 - AFM principles. (a) The deflection of the cantilever is detected and processed as a function of the position on
the (x, y) plane, in order to obtain topographical images (JPK Instruments AG, 2012). (b) AFM operation modes. The AFM can operate in a variety of modes, including contact, intermittent contact and force spectroscopy (Variola, 2015). (Adapted from http://static1.squarespace.com/static/51acda21e4b0be9ceadc57b3/t/538c8e2be4b01a84edc5f741/1401720367289/).
The AFM can operate in different modes. The tip can be continuously contacting with the sample’s surface (contact mode), or the cantilever could be oscillating and the variations on its resonance frequency are used to generate images (intermittent contact or tapping mode). On this mode, the cantilever moves rapidly with a large oscillation between the repulsive and attractive forces (vd. Figure I.13b). An optical lever is created by a beam of light from a light-emitting diode reflected off of the cantilever onto a position-sensitive photodiode (Averett & Schoenfisch, 2010). Deflections of the cantilever cause changes in the position of the light spot, and may be translated into applied force using Hooke’s Law:
𝐹 = −𝐾∆𝑥 (1)
Thus, a cantilever deflection vs. scanner displacement curve can be converted into a force-distance curve (Carvalho & Santos, 2012). This means that the force (F) needed to extend the cantilever spring
a
constant (K) depends in a linear way of the cantilever deflection (∆𝑥) that may extend it (JPK Instruments AG, 2012) (vd. Figure I.14). When the tip contacts the sample at a given point, the cantilever can move vertically and the deflection of the cantilever provided information on the mechanical properties of the sample’s surface or on the tip-sample interactions (force spectroscopy mode).
Figure I.14 - Scheme of the AFM process and how to apply the Hooke’s Law to calibrate the cantilever (JPK Instruments
AG, 2012).
5.1) Atomic Force Microscopy Applications
5.1.1) Cell Imaging
Atomic force microscopy has been usually applied to characterize the nanometric features of the surfaces of samples and also to map the spatial distribution of their physicochemical properties. AFM has the capacity to visualize nanotopographical features and correlate them to surface charge density and electrical characteristics of the biomaterials. The contact and oscillation modes are most commonly used to image reconstituted membrane proteins and native membranes (Fotiadis, 2012). The AFM technique involves a small sensor scanning over the surface of the cell. AFM is typically an imaging technique in which the surface of a sample is scanned, line by line, by the movement of a thin tip mounted on a flexible cantilever. The tip-sample repulsion at the atomic level, transduced by the cantilever deflection and by an optical lever mechanism allows the association of a height value to each position on the x,y plane, enabling the reconstitution of a high-resolution pseudo-three-dimensional image of the sample surface (Carvalho et al., 2015). AFM has the capacity of imaging, in air or in liquid, nonconductive and conductive surfaces beyond the light diffraction limit, reaching molecular and atomic resolution for some samples (Averett & Schoenfisch, 2010). Operating in contact mode, the force applied by the tip is constantly adjusted manually to image the sample in a non-perturbed state. In oscillation mode (intermittent contact), the cantilever is rapidly oscillated in the vertical direction while raster scanning the sample. Ideally, the AFM tip then only touches the sample on its downward movement and is not in constant contact with the sample as in contact mode. The ‘tapping’ mode has the advantage that lateral forces and friction are virtually eliminated. Hence, the oscillation mode is particularly convenient for AFM imaging of soft and weakly adsorbed biomolecules. However, in spite of this considerable advantage, contact mode-AFM imaging still remains the operating mode of choice to achieve high resolution on native and reconstituted membrane protein surfaces (Fotiadis, 2012). AFM imaging of cells generates relevant structural information, allowing the identification of functional components on cells, and giving information about the
heterogeneity of the cell surface in terms of protein composition and distribution (Fotiadis, 2012; JPK Instruments AG, 2012; Variola, 2015).
5.1.2) Atomic Force Microscopy-based Force Spectroscopy
AFM-based Force Spectroscopy allows the measurement of inter and intramolecular interaction forces required to separate the tip from the sample, with piconewton (pN) resolution. Thus, the AFM can be used to quantify the interaction between the tip and a specific spot of the sample, taking advantage of the piconewton sensitivity of the method (Averett & Schoenfisch, 2010; Carvalho & Santos, 2012; Carvalho et al., 2015).
The interaction force depends on the nature of the samples, the probe tips and the distance between them. It measures the interaction force between a sharp tip and a surface, or may vibrate as it moves along it. The design of a force-distance curve depends on these characteristics and of the composition of the medium. There are differences in curves obtained for measurements in air and in liquid medium. In force spectroscopy measurements, the cantilever moves in the vertical direction (z axis) toward the surface and then in the opposite direction. During this procedure, the cantilever deflection as a function of the vertical displacement of the piezoscanner can be recorded. The result is a cantilever deflection versus scanner displacement curve, which can be converted into a force-distance curve after applying the Hookes’s law of elasticity (Carvalho & Santos, 2012) (vd. Figure I.15). To obtain the quantitative parameters, the accurate calibration of the spring constant of the cantilevers is necessary (Averett & Schoenfisch, 2010). This technique can be used a highly sensitive nanotool for the diagnostic and unbiased functional evaluation of the severity of haematological diseases arising from genetic mutations. AFM-based force spectroscopy can be used to measure the binding force between fibrinogen and cell receptors and for the identification of the fibrinogen receptor on erythrocytes (Carvalho et al., 2010). Different types of forces can be studied using AFM-based force spectroscopy, both attractive and repulsive (Carvalho et al., 2013).
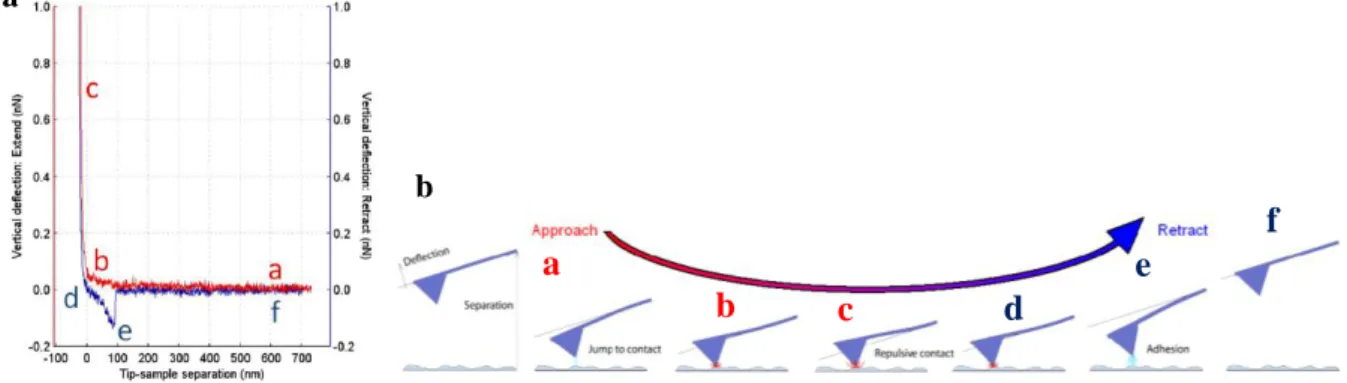
Figure I.15 - based force spectroscopy. (a) Schematic representation of the force-distance curve obtained by
AFM-based force spectroscopy, showing a single adhesion event. The red line is the approach curve and the blue line is the retraction curve. (b) Diagram of the vertical tip movement during the approach and retraction curves of force spectroscopy measurements. The letters represent different moments during the approach and retraction curves. Adapted from (JPK Instruments AG, 2012; Carvalho et al., 2013).
a b
a
b
c
d
e
f
In Figure I.15, the cycle begins with the tip away from the cell surface (a) and the forces measured by the cantilever deflection can change as it is moved toward or away from the sample on its neutral position (0 pN). From this position, the tip starts moving down towards the surface, reaching the contact point (b). On the approach curve, the van der Waals interactions are the main type of force present on the approaching of two hard surfaces in the absence of long-range interactions. This force is characterized by a small deflection of the cantilever, at the approach curve, before the contact point. The jump to contact causes instability in the position of the cantilever because it occurs when the gradient of force between the tip and the sample exceeds the stiffness of the cantilever. If the approach curve has a smooth and exponentially increasing repulsive force, it is expectable that electrostatic or polymer-brush forces are present. Viscoelastic properties of some biological systems have been determined using AFM force curves. There is a waiting time before starting the retraction curve and another after reaching the defined applied force (c). Afterwards, tip and cantilever begin the upward movements away from the sample, in the opposite direction, reaching the contact/adhesion point (d). In the retraction curve, an adhesion force profile, the force depends on the type of the sample and appears as a deflection of the cantilever below the zero-deflection line (e). The central basis of adhesion forces is the development of a capillary bridge between the tip and the sample. This capillary force depends if the measurements are made in air or in liquid. In air, samples usually have several nanometers of water molecules adsorbed to their surface. In liquid conditions, the adhesion force not only depends of the interaction energies between tip and sample but also on the type of solution used. If no adhesion occurs between the molecules attached to the tip and the cell surface, the tip continues its upward movements, at 0 pN of force, and reaches back the neutral position at a defined z distance point (f). If a bond is formed between the tip and the sample, as the cantilever moves upward, it bends down to negative values in force. To quantitatively analyse force-distance curves, it is necessary to accurately calibrate the spring constant of the cantilevers. Cantilever stiffness depends on the shape and on the material properties of the cantilevers (JPK Instruments AG, 2012; Carvalho et al., 2013).
5.1.2.1) Force Spectroscopy modes
The AFM-based force spectroscopy can be used at diverse applications. The main application modes that were applied on this study were molecular interaction, adhesion and indentation.
Molecular interactions studies
Single-molecule force spectroscopy (SMFS) is an extremely powerful tool for detecting and localizing single molecular recognition events, and for exploring the energy landscape of molecular interactions. Different molecules, or their domains, can be attached to the tip, and each part of the molecule can break contact separately or altogether (Carvalho et al., 2013). After attaching a molecule to the tip and/or to the sample surface, the unfolding, stretching, or adhesion of single molecules can be studied.
The tips are commonly functionalized with one or a small amount of molecules. These molecules can recognize a specific target molecule on the sample surface. When analysing the stretching of biomolecules, and in order to measure specific and strong interactions between tip and sample, it is necessary to specifically attach to the tip the biomolecule under study. The attachment should be firm enough to avoid reallocations, but it should maintain some autonomy of the molecule to change its conformation during or before the interaction (Carvalho et al., 2013). The simplest method to attach molecules to the tip is via their non-specific adsorption. However, the covalent attachment methods usually yield better performances. With this process, parameters like stiffness, persistence length, and inter- or intramolecular transitions can be studied. Proteins can be unfolded in a controlled way, to explore the structure of the molecule (Carvalho et al., 2013).
Indentation studies
AFM-based detection of stiffness is highly dependent on the appropriate use of theoretical models. Cells elasticity can be measured by nanoindentation with the most common AFM cantilevers, via the Hertzian theory (Carvalho & Santos, 2012). This theory of elastic contact is the most widely used approach to estimate the elastic properties of cells from force indentation curves, using the depth of indentation to assess elasticity in terms of the Young’s elastic modulus. Specifically, this method allows characterizing the elasticity of biological structures, comparing different types of cells or even organelles. Experimental conditions concerns the indenters’ shape or the thickness of the sample (Carvalho & Santos, 2012).
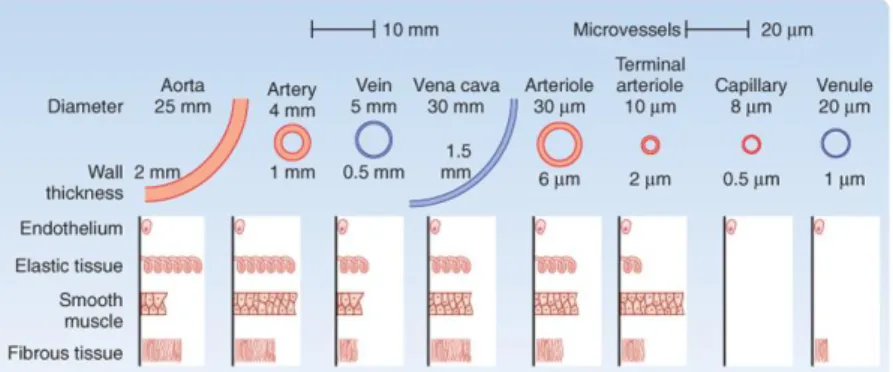
Figure I.16 - Variations in tissue stiffness. The biomechanical properties of a tissue in terms of stiffness (elastic modulus),
measured in Pascal (Pa), vary markedly between organs and tissues, and are inherently related to tissue function (Cox & Erler, 2011).
Single-cell adhesion studies
Atomic force microscopy-based single-cell force spectroscopy (SCFS) is used to quantify the contribution of cell adhesion molecules to the adhesion of cells to specific substrates both at the cell and at a single molecule level. In AFM-based SCFS, a single cell is attached to a cantilever, commonly facilitated by an adhesive coating (e.g., concanavalin A, poly-L-lysine or CellTak). The attached cell is brought into contact with a substrate, which can be a protein-coated surface, another
cell or a biomaterial, until a set force is reached. The cell is kept stationary in contact with the surface for a set of time to allow the formation of adhesive interactions. During the subsequent retraction of the cantilever, the force acting on the cell and the distance between cell and substrate are recorded in a force-distance curve. The force values that can be detected with AFM-based SCFS are from ~10 pN up to ~100 nN. Thereby, SCFS allows both the overall cell adhesion and the contribution of single adhesion receptors to be quantified. During cantilever retraction, the upward acting force on the cell increases until the force needed to initiate cell de-adhesion is reached, leading to unbinding events (vd. Figure I.17). At the cellular level, single cells can be ingeniously fixed onto the cantilever, becoming the probe for the dynamic quantification of cell–substrate interactions (SCFS). Parameters such as maximum detachment force and work for the entire cells as well as a number of detachment events of single cellular tethers have already been successfully quantified. The maximum force is called the adhesion force and it is a measure of how strong cell adhered to the substrate. Unbinding events can be characterized either as rupture (jumps) or membrane tether events. The analysis of these unbinding events may be used to characterize the strength of single bonds and cell membrane properties (Bowman et al., 2012; Yu et al., 2015).
Figure I.17 - Schematic overview of AFM-based cell-cell adhesion experiments (a). Force-distance curve showing
maximum detachment force (Fdetach), work necessary for the cell detachment from the substrate (shaded area) and two types
of molecular unbinding events: (I) the receptor remains anchored in the cell cortex and unbinds as the force increases (designed as jumps) and (II) receptor anchoring is lost and membrane tethers are pulled out of the cell (b). Image from (Variola, 2015).
Adhesion is a fundamental aspect of cells, both in health and disease. In the last decade, single cell adhesion studies have contributed to the understanding of adhesion proteins and their regulation. AFM-based SCFS has been used to quantify adhesion of numerous cell types to a diverse set of substrates, include extracellular matrix (ECM) proteins, biomaterials and cell–cell adhesion proteins (Yu et al., 2015).
II) Objectives
The two main goals of this thesis were:
i. To study the influence of fibrinogen molecules on erythrocyte-erythrocyte adhesion of stroke patients.
ii. To evaluate morphological and elasticity changes on erythrocytes from patients with Amyotrophic Lateral Sclerosis.
III) Material and Methods
1) Blood collection
Human blood cells were obtained by vein puncture from healthy adult volunteer donors (n=57), used as control. The blood collection was performed at Instituto Português do Sangue e da Transplantação de Lisboa, Portugal, under an institutional agreement with Instituto Português do Sangue (Lisbon). Human blood cells were also obtained by vein puncture from stroke patients and from Amyotrophic Lateral Sclerosis patients in a close collaboration with clinicians from Serviço de Medicina I (Prof. Carlos Moreira) and Serviço de Neurologia (Prof. Mamede de Carvalho), respectively, from Santa Maria Hospital (Centro Hospitalar Lisboa Norte). Healthy donors, stroke and ALS patients samples were obtained with their previous written and signed an informed consent, or from their proxy, as approved by the joints Ethical Committee of Santa Maria Hospital and of the Faculty of Medicine of the University of Lisbon.
Blood samples from healthy donors (control) and stroke patients were collected into K3EDTA, lithium heparin and sodium citrate 3.8% anticoagulant tubes (Vacuette, Greiner Bio-One, Germany) and ALS patients were collected into S-Monovette 4.9 mL, Lithium heparin and K3EDTA anticoagulant tubes (Sarstedt, Germany).
K3EDTA, heparin and sodium citrate anticoagulant tubes were used according to the different measurements performed to analyse hematologic and haemorheological parameters. K3EDTA is a critical factor of coagulation and is particularly useful for haematological examination, being the tri-potassium salt the most stable. This anticoagulant prevents platelet aggregation, conserves blood cells properties and blocks the formation of prothrombin and the beginning of the coagulation process. It is used for haemogram and for erythrocyte isolation.
Heparin is the most widely used anticoagulant for clinical chemistry analysis, because it binds to several enzymes responsible for the coagulation cascade. It is present naturally in blood and prevents blood cells haemolysis. Heparin tubes were used for analysing haemorheological parameters and for fluorescence generalized polarization measurements.
Sodium citrate is widely used for coagulation studies. The effect is easily reversible by the addition of Ca2+. It was used for total fibrinogen and γ’ fibrinogen quantification in plasma (Mafuvadze & Erlwanger, 2007; Gonzalez-Covarrubias et al., 2013).
2) Haemogram
Haemogram were quantified using whole blood collected into K3EDTA anticoagulant tubes. Analysis were done on a Haematological Analyser (PocH-100iV - Hematology Analyzer, Sysmex Europe GmbH, Hamburg, Germany). Haemogram allows the counting of each of the human blood cells elements and to compare these results with reference ranges for each parameter. About 40 to 45% of the blood volume is occupied by erythrocytes. This percentage of volume is termed haematocrit (Baskurt & Meiselman, 2003).
3) Human Blood Cells Isolation
For human blood cells isolation, the blood was collected into K3EDTA anticoagulant tubes (3mL) and cells were isolated as previously described elsewhere (Carvalho et al., 2015). In a refrigerated centrifuge (Heraeus Multifuge 1 L-R, Thermo Scientific, UK), blood was centrifuged at 1620 g for 10 min, at 10ºC, resulting in a three phase solution: an upper phase of plasma, a middle phase of buffy-coat and a lower phase of erythrocytes.
The supernatant (plasma and buffy coat) was discarded and the erythrocytes were resuspended in 1 mL of buffered saline glucose-citrate (BSGC) buffer (1.6 mM KH2PO4, 8.6 mM Na2HPO4, 0.12 M NaCl, 13.6 mM sodium citrate, and 11.1 mM glucose) pH 7.3 with CaCl2 (1 mM). On the second centrifugation, the supernatant was disposed, without buffer addition, and the erythrocyte mush was kept at 4ºC, until further use.
4) Atomic Force Microscopy
A NanoWizard II atomic force microscope (JPK Instruments, Berlin, Germany) mounted on the top of an Axiovert 200 inverted optical microscope (Carl Zeiss, Jena, Germany) was used for imaging and force spectroscopy experiments during this project.
4.1) AFM Scanning Images of Human Blood Cells
The AFM head is equipped with a 15 μm z-range linearized piezoelectric scanner and an infrared laser. Imaging of the erythrocytes was performed, in air, in tapping mode. Oxidized sharpened silicon tips with a tip radius of ~ 6 nm, resonant frequency of about 60 kHz and spring constant of 3 N/m were used for the imaging. Imaging parameters were adjusted to minimize the force applied on the scanning of the topography of the cells. Scanning speed was optimized to 0.3 Hz and acquisition points were 512×512. Imaging data were analysed with the JPK Image Processing software v.5.1.8
(JPK Instruments, Berlin, Germany). The diameter, area, height and volume of each imaged cell were quantified using the SPIP software v.6.6.0 (Image Metrology, Hørsholm, Denmark). The roughness of the erythrocytes was also analysed by Gwyddion software v.2.45 (Czech Metrology Institute, Czech Republic) (Carvalho et al., 2010; Bernardes et al., 2016).
4.2) AFM – based Force Spectroscopy
For the AFM experiments, the erythrocytes were isolated from the blood plasma. Then the cells were suspended into final 0.1% haematocrit with saline glucose-citrate (BSGC) buffer (1.6 mM KH2PO4, 8.6 mM Na2HPO4, 0.12 M NaCl, 13.6 mM sodium citrate, and 11.1 mM glucose) pH 7.3 with CaCl2 (1 mM). After this, the solution was placed on a poly-L-lysine-coated glass slide and erythrocytes were allowed to adhere firmly for 30 min (Carvalho et al., 2010, 2011, 2015; Guedes et al., 2016). AFM indentation for elasticity
For erythrocyte indentation experiments, non-functionalized OMCL TR-400-type silicon nitride tips (Olympus, Japan) were used. The softest triangular cantilevers, with a tip radius of ~15 nm and a resonant frequency of 11 kHz, were used. The spring constants of the tips were calibrated by thermal fluctuation method having a nominal value of 0.02 N/m. For every contact between the cell and the cantilever, the distance between the cantilever and the cell was adjusted to maintain a maximum applied force of 300 pN for erythrocytes from ALS patients before retraction. Cell elasticity was measured on one point of each erythrocyte (5 force-distance curves per cell). Data collection for each force-distance cycle was performed at 1.5 Hz, with a z-displacement range of 4 μm. Force curves were made at the centre of the cell. Data acquired on the nanoindentation experiments (force curves) were analysed to obtain the cells Young’s modulus (E), using JPK Image Processing software v.5.1.8, by the application of the Hertzian model. The probe was modelled as a quadratic pyramid, with a tip angle of 35º (half-angle to face) and a Poisson ration of 0.50. Histograms results of the Young’s modulus were constructed for each experimental condition studied. The ideal histogram bin size was chosen in order to achieve the best fitted Gaussian model peak length. The maximum values of the Gaussian peaks represent different statistical measure of the Young’s modulus of the cells. AFM tip penetration depth onto erythrocytes was also evaluated. This parameter was analysed by the position of the maximal movement of the piezo sensor in the z-axis, which corresponds to the z-axis coordinate when the sensor reaches an indentation force of 300 pN for erythrocytes from ALS patients, subtracting the z-axis position of the sensor when the tip begins the contact with the surface of the erythrocyte (Guedes et al., 2016).
Protein-cell interactions
Force spectroscopy measurements were performed on the same equipment using fibrinogen functionalized OMCL TR-400-type silicon nitride tips (Olympus). The softest triangular cantilevers,