i
Predictive
Modelling:
Flight
Delays
and
Associated Factors
Inês Viana Feiteira
Hartsfield–Jackson Atlanta International Airport
Project Work report presented as partial requirement for
obtaining the Master’s degree in Information Management
i
Predictive Modelling: Flight Delays and Associated Factors
Hartsfield–Jackson Atlanta International Airport Inês Viana Feiteira
MGI
2018
NOVA Information Management School
Instituto Superior de Estatística e Gestão de Informação
Universidade Nova de LisboaPREDICTIVE MODELLING: FLIGHT DELAYS AND ASSOCIATED
FACTORS
Hartsfield–Jackson Atlanta International Airport
By
Inês Viana Feiteira
Project Work report presented as partial requirement for obtaining the Master’s degree in Information Management, with a specialization in Knowledge Management and Business Intelligence.
Advisor: Professor Doctor Roberto Henriques, NOVA IMS
ii
ACKNOWLEDGEMENTS
Success is a science; if you have the conditions, you get the result. – Oscar Wilde (1854-1900)1 The success here implicit was only possible with the help of fabulous people who, during these months, supported and helped me. It would not make any sense to submit this work without first acknowledging these people and expressing how grateful I am to them.
I would like to thank my supervisor, Professor Roberto Henriques, whom I have known since graduation, and whom I have always admired for his vast knowledge, competence, and professionalism. Thank you for the teachings you gave me from the beginning, either from this thesis or my journey through this university and for always been available to answer my doubts guiding me and suggesting ways to lead the development of this work.
To my parents, Ana Lúcia and Vitor, and sister, Joana, for among all people, be the ones who, at the end of the day, have to listen to all my dilemmas and concerns. For being always available, encouraging me to go further and give my all without fear. For giving me comfort in the hardest hours. For that, for providing me with everything I ever needed, and for helping me in finding my own way in life, I must be grateful.
To my love one, Diogo Ferreira, for being my partner, my best friend, and my boyfriend. Who always helped me to see through the difficulties. Who always put the highest trust in me, never letting me down. For his effort to help me find solutions that sometimes seemed not to exist. For the endless hours he has heard me speaking of things that, for him, may make no sense. For always being by my side and believing me. For everything, and more grateful than words can demonstrate, thank you. At last, but not least, to my dearest friends - Marta Galvão, Catarina Andrade and Tiago Costa -, that even in the worst moments made me smile and provided me the best moments making it tolerable. For always being on my side in the longest hours of this journey sharing experiences and knowledge, but also for distracting me when I needed to.
1 Oscar Fingal O'Flahertie Wills Wilde was a famous Irish dramatist, poet and novelist (for more
iii
RESUMO
Atualmente, um ponto negativo nas viagens de avião são os atrasos que, constantemente, são anunciados aos passageiros resultando numa diminuição da sua satisfação enquanto clientes. Este e outros fatores fazem com que elevados custos, tanto quantitativos como qualitativos sejam imputados às companhias. Consequentemente, existe a necessidade de prever e mitigar a existência de atrasos aéreos que pode ajudar as companhias aéreas bem como aeroportos a melhorar a sua performance e a aplicar algumas medidas, dirigidas ao consumidor, que permitiam atenuar ou até anular o efeito que estes atrasos provoca nos seus passageiros.
Deste modo, este estudo tem como principal objetivo prever a ocorrência de atrasos nas chegadas ao aeroporto internacional de Hartsfield-Jackson. Esta estimativa será possível através da elaboração de um modelo preditivo, recorrendo a diversas técnicas de Data Mining. Com a aplicação destas técnicas, foi possível identificar as variáveis que mais contribuíram para a existência do atraso. No desenvolvimento deste trabalho, foi seguida a metodologia da descoberta de conhecimento em base de dados (conhecida em inglês por Knowledge Discovery Database, KDD). Fases como a recolha dos dados, a aplicação de técnicas de amostragem (SMOTE e Undersampling), a partição dos dados em treino e teste, o pré-processamento (dados omissos e outliers) e transformação dos dados (normalização dos dados e seleção de atributos), a definição de modelos a treinar (Decision Trees,
Random Forest e Multilayer Perceptron) bem como a avaliação da performance dos modelos através
de métricas variadas foram aplicadas.
Depois de testar diferentes abordagens, concluiu-se que o melhor modelo é alcançado com as variáveis relacionadas com a partida, usando o algoritmo Multilayer Perceptron e aplicando a técnica de SMOTE para lidar com dados não balanceados, removendo outliers e selecionando dez variáveis usando GainRatio. Por outro lado, quando as variáveis com informação da partida são excluídas, o algoritmo que melhor se destaca é o Multilayer Perceptron usando a técnica SMOTE, mas desta vez, incluindo os outliers e com quinze variáveis selecionadas novamente pelo GainRatio.
Em ambas as hipóteses, as variáveis explicativas que mais contribuem para a existência do atraso na chegada são relacionadas com o clima, com as características do avião e com a propagação do atraso.
Os resultados do algoritmo de Random Forests mostraram melhor desempenho, em relação à precisão, em comparação com outros autores (Belcastro, Marozzo, Talia, & Trunfio, 2016; Choi, Kim, Briceno, & Mavris, 2016). Contrariamente, o algoritmo Multilayer Perceptron, apresentou menor precisão em comparação com outro estudo equivalente (Y. J. Kim, Choi, Briceno, & Mavris, 2016).
PALAVRAS-CHAVE
Data Mining; Análise Preditiva; Atraso Aéreo; Aeroporto Internacional de Hartsfield–Jackson; Aeroporto Internacional de Atlanta.
iv
ABSTRACT
Nowadays, a downside to traveling is the delays that are constantly advertised to passengers resulting in a decrease in customer satisfaction. These delays associated with other factors can cause costs, both quantitative and qualitative. Consequently, there is a need to anticipate and mitigate the existence of airborne delays that can help airlines and airports improving their performance or even take some consumer-oriented measures that can undo or attenuate the effect that these delays have on their passengers.
This study has as primary objective to predict the occurrence of arrival delays of the international airport of Hartsfield-Jackson. It was possible by building a predictive model, applying several Data Mining techniques. With these applications, it was possible to show the variables, among the proposals, that most contributed to the existence of the delay.
In this work, the Knowledge Discovery Database (KDD) methodology was followed. Phases such as data collection; sampling techniques (SMOTE and Undersampling); Data partitioning in training and testing; Pre-processing (missing data and outliers) and data transformation (data normalization and attribute selection); And, finally the definition of models to be trained (Decision Trees, Random Forests, and Multilayer Perceptron), as well as the evaluation of the performance of the models through varied metrics, were used.
After testing different approaches, it was concluded that the best model is achieved with the variables related to departure, using the Multilayer Perceptron algorithm and applying SMOTE to deal with unbalanced data, removing outliers and selecting ten variables using GainRatio.
On the other hand, when the variables with information of the departure are excluded, the algorithm that performs best is also the Multilayer Perceptron using the SMOTE technique but, this time, including the outliers and with fifteen variables selected again by the GainRatio.
On both hypotheses, the explanatory variables that most contributed to the existence of the delay in arrivals were related to the weather, the airplane characteristics and the propagation of the delay. Our results for the Random Forests algorithm shown better performance, regarding accuracy, compared to other authors (Belcastro et al., 2016; Choi et al., 2016). Contrary, for the Multilayer Perceptron algorithm, was presented a lower accuracy compared to another equivalent study (Y. J. Kim et al., 2016).
KEYWORDS
Data Mining; Predictive Analysis; Flight Delays; Hartsfield–Jackson International Airport; Atlanta International Airport.
v
INDEX
1.
Introduction ... 1
1.1.
Context and Relevance ... 1
1.2.
Objective ... 3
1.3.
Study Outline ... 4
2.
Literature Review ... 5
3.
Methodology ... 13
3.1.
Selection ... 14
3.1.1.
Study Scope ... 14
3.1.1.1.
Geographical ... 14
3.1.1.2.
Temporal ... 14
3.1.2.
Data ... 15
3.1.2.1.
Sources ... 15
3.1.2.2.
Data Validation and Limitations... 16
3.1.2.3.
Dataset Construction and Description ... 17
3.1.3.
Sampling Techniques ... 23
3.1.4.
Data Partition ... 25
3.2.
Data Pre-Processing ... 26
3.2.1.
Exploratory Data Analysis ... 27
3.2.2.
Missing Values ... 35
3.2.3.
Outliers ... 37
3.3.
Data Transformation ... 39
3.3.1.
Normalization ... 39
3.3.2.
Variable Selection ... 39
3.4.
Data Mining ... 42
3.4.1.
Decision trees ... 43
3.4.2.
Random Forests ... 44
3.4.3.
Multilayer Neural Networks ... 44
3.5.
Evaluation ... 46
4.
Results and Discussion ... 48
5.
Conclusions ... 58
6.
Limitations and Recommendations for Future Works ... 60
7.
References ... 62
vi
Annex 1: Proceedings for Data Validation by Type of Source Data Information ... 71
Annex 2: Entity-relationship Physical Model with Crow’s Foot Notation ... 73
Annex 3: Distinct airports and Cities with respect to time-zone ... 73
Annex 4: Airline Companies... 77
Annex 5: Federal Holidays ... 78
Annex 6: Acquisition of the 3 Phases of the Weather Variables ... 79
Annex 7: Influence of Arrival delay on Temperature variables ... 80
Annex 8: Influence of Arrival delay on Precipitation variables ... 81
Annex 9: Influence of Arrival delay on Wind variables ... 82
Annex 10: Influence of Arrival delay on Visibility variables ... 83
Annex 11: Test Results Table of SMOTE Technique ... 84
vii
LIST OF FIGURES
Figure 1: Percentage of total delayed flights per year in the USA, 2010-2017 ... 5
Figure 2: KDD Process ... 6
Figure 3: Relation between Knowledge Discovery Database (KDD), Data mining (DM) and
Machine Learning (ML) ... 6
Figure 4: Literature Review ... 12
Figure 5: Work Project Methodology ... 13
Figure 6: Data acquisition and preparation steps for upload in WEKA ... 15
Figure 7: Problem of unbalanced classes ... 23
Figure 8: Distribution of the dataset according to the dependent variable (ARR_DELAY) ... 24
Figure 9: Sampling Techniques ... 25
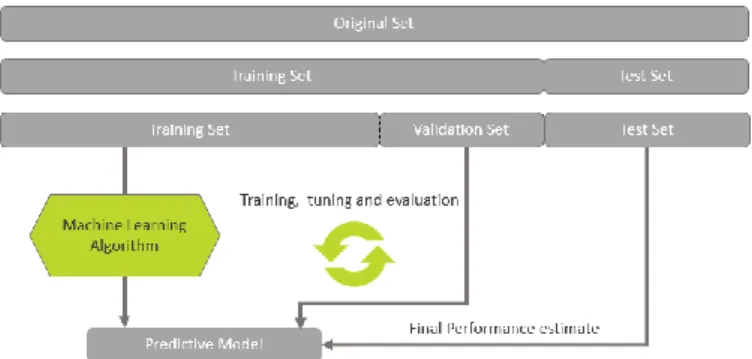
Figure 10: Holdout Method Training-Test and Training-Validation-Test ... 26
Figure 11: Data Partition options in Weka ... 26
Figure 12: Dependent variable Arrival delay ... 28
Figure 13: Influence of Arrival delay on Month variable ... 28
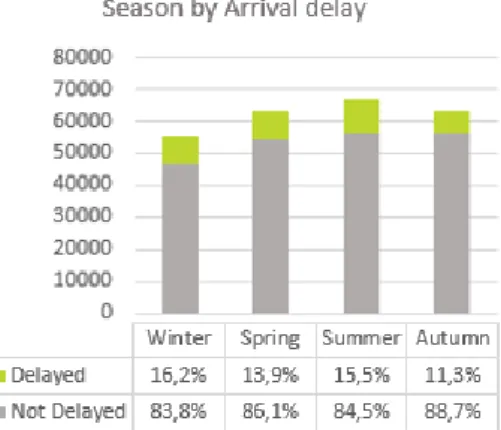
Figure 14: Influence of Arrival delay on Season (adaptation of Month variable)... 28
Figure 15: Influence of Arrival delay on Weekday variable ... 29
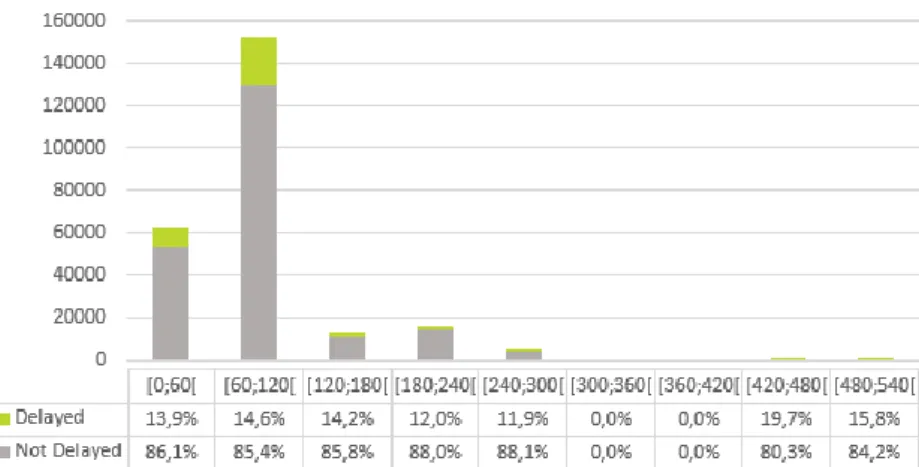
Figure 16: Influence of Arrival delay on Schedule flight duration variable ... 29
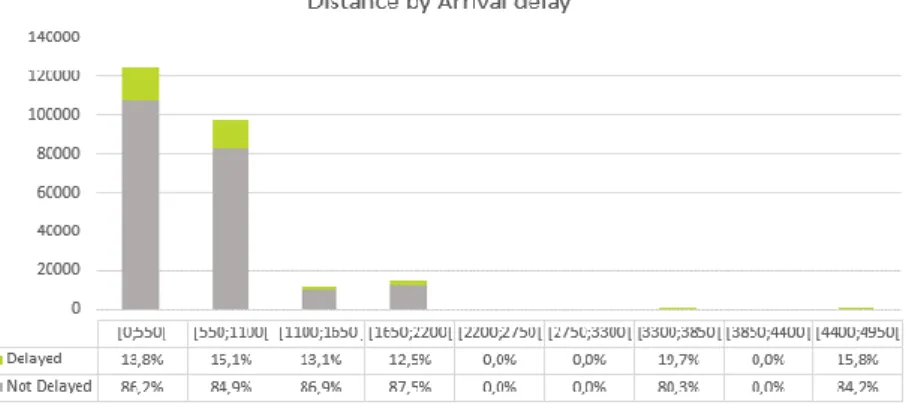
Figure 17: Influence of Arrival delay on Distance variable ... 30
Figure 18: Influence of Arrival delay on Schedule departure time variable (in parts of the day)
... 30
Figure 19: Influence of Arrival delay on Schedule departure time variable ... 30
Figure 20: Influence of Arrival delay on Real departure time variable (in parts of the day) ... 31
Figure 21: Influence of Arrival delay on Real departure time variable ... 31
Figure 22: Influence of Arrival delay on Schedule arrival time variable (in parts of the day) . 31
Figure 23: Influence of Arrival delay on Schedule arrival time variable ... 32
Figure 24: Distribution of airports accordingly to cardinal directions ... 32
Figure 25: Influence of Arrival delay on Origin variable... 32
Figure 26: Influence of Arrival delay on Airline company variable ... 33
Figure 27: Influence of Arrival delay on Antiquity variable ... 33
Figure 28: Influence of Arrival delay on Maximum number of seat variable ... 34
Figure 29: Influence of Arrival delay on Previous day delay occurrence variable ... 34
Figure 30: Influence of Arrival delay on Holiday occurrence variable ... 34
Figure 31: Examples of Outliers: as an individual value (a) and as clusters of values (b) ... 37
viii
Figure 33: Attribute Selection Steps ... 40
Figure 34: Attribute Selection Types ... 40
Figure 35:Attribute Subset Evaluator, Filter Method Selection ... 41
Figure 36: Attribute Subset Evaluator, Wrapper Method Selection ... 41
Figure 37: Attribute Subset Evaluator, Embedded Method Selection ... 41
Figure 38: Single-Attribute Selection ... 41
Figure 39: Data Mining Tasks ... 42
Figure 40: Artificial Neural Network and Multilayer Perceptron Architectures, respectively . 45
Figure 41: ROC Curve and Ideal Point ... 47
Figure 42: Variables Usage Frequency by Sampling Technique ... 51
Figure 43: Variables Selected by GainRatio for the J48 best algorithm including Dep_Delay &
Real_Dep_Time variables ... 54
Figure 44: Variables Selected by GainRatio for the J48 best algorithm excluding Dep_Delay &
Real_Dep_Time variables ... 54
Figure 45: Variables Selected by GainRatio for the RF best algorithm including Dep_Delay &
Real_Dep_Time variables ... 54
Figure 46: Variables Selected by GainRatio for the RF best algorithm excluding Dep_Delay &
Real_Dep_Time variables ... 55
Figure 47: Variables Selected by GainRatio for the MLP best algorithm including Dep_Delay &
Real_Dep_Time variables ... 55
Figure 48: Variables Selected by GainRatio for the MLP best algorithm excluding Dep_Delay
& Real_Dep_Time variables ... 55
ix
LIST OF TABLES
Table 1: Total passengers traffic in 2015 ... 3
Table 2: Aircraft movements in 2015 ... 3
Table 3: Implementation of KDD in Weka ... 14
Table 4: Seasons of the Year in the Northern Hemisphere ... 14
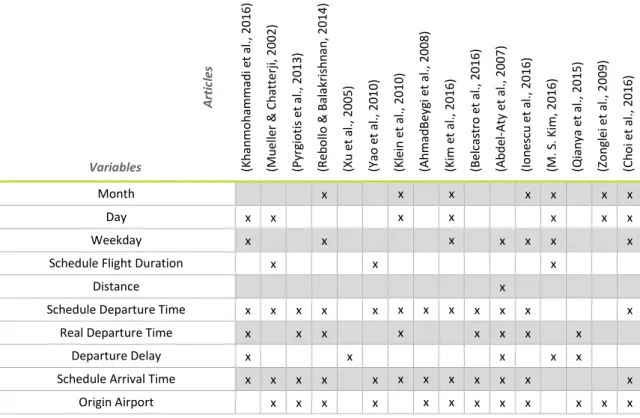
Table 5: Synthesis of chosen variables and their use in other articles ... 20
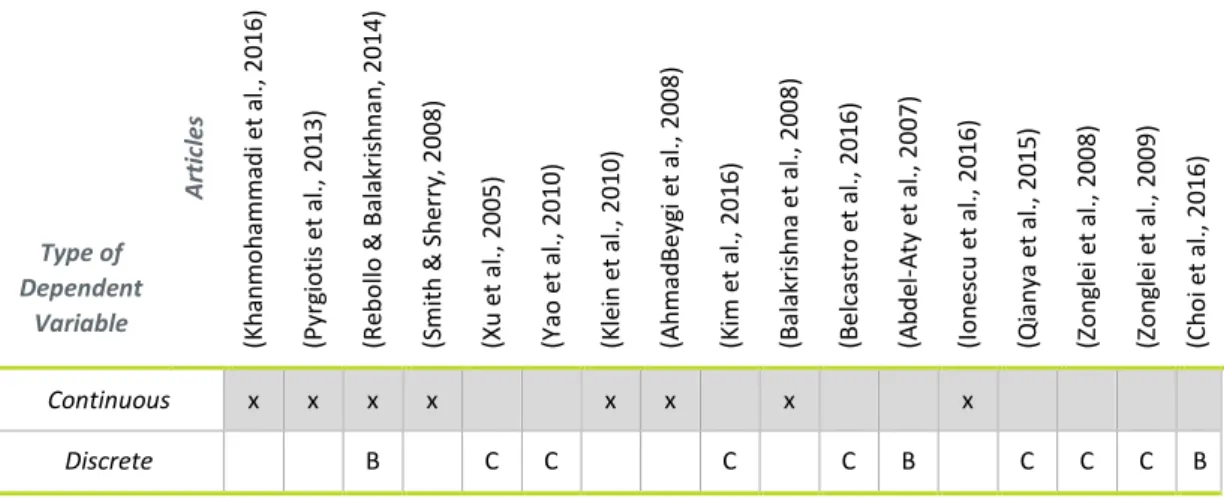
Table 6: Synthesis of the type of dependent variables used in other articles ... 21
Table 7: Overview of used variables ... 23
Table 8: Variables with missing values in the FlightData dataset ... 36
Table 9: Resume of the best results for each technique, algorithm, and dataset ... 49
Table 10: Resume of the best results for each algorithm and dataset ... 52
Table 11: Resume of the best results for each algorithm and corresponding training results
by two views: including Dep_Delay and Real_Dep_Time and otherwise ... 52
Table 12: Related Work Comparison ... 56
Table 13: Related Platforms Comparison ... 57
LIST OF EQUATIONS
Equation 1: Min-Max Normalization Technique ... 39
Equation 2: Corrected Classified Instances Formula ... 46
Equation 3: Precision Formula ... 46
Equation 4: Recall Formula ... 47
x
LIST OF ABBREVIATIONS AND ACRONYMS
ACPD Aviation Consumer Protection Division AND Airport Network Delay Model
ASOS Automated Surface Observing System BN Bayesian Network
BTS Bureau of Transportation Statistics DT Decision Trees
DM Data Mining
DOT U.S. Department of Transportation DPA Delay Propagation Algorithm EDA Exploratory Data Analysis EM Expectation-Maximization EVF Extreme Value Factor
FAA Federal Aviation Administration GDP Ground Delay Program
GDP Gross Domestic Product GIGO Garbage In Garbage Out
IATA International Air Transport Association IEM Iowa Environmental Mesonet
IQR Interquartile Ranges
KDD Knowledge Discovery Database KNN K-Nearest Neighbor
LSTM RNN Long Short-Term Memory Recurrent Neural Networks METAR Meteorological Terminal Air Report
ML Machine Learning
MLP Multilayer Perceptron Neural Network NAA National Aviation Authority
xi NAS National Airspace System
NWS National Weather Service
OAEP Office of Aviation Enforcement and Proceedings OF Outlier Factor
OPM Office of Personnel Management OR Operational Research
PM Probabilistic Models QE Queueing Engine theory
RF Random Forest
RITA Research and Innovative Technology Administration RL Reinforcement Learning
SA Statistical Analysis
SAS Statistical Analysis System
SMOTE Synthetic Minority Over-Sampling Technique SQL Structured Query Language
SVM Support Vector Machine USA United States of America
Weka Waikato Environment for Knowledge Analysis WITI Weather Impacted Traffic Index
WITI-FA Weather Impacted Traffic Index – Forecast Accuracy VBA Visual Basic for Applications
1
1. INTRODUCTION
Inside of every problem lies an opportunity. – Robert Kiyosaki2
1.1. C
ONTEXT ANDR
ELEVANCEThe airline industry has grown over the years, approximately 5% per year over the last 30 years (Belobaba, Odoni, & Barnhart, 2009). Its demand grew steadily with a global passenger air traffic growth of 6.5% in 2015, far above of the 10-year average annual growth of 5.5% (International Air Transport Association (IATA), 2015). However, a high demand does not only translate into success since it can diminish the capacity to respond to a possible rupture (Rebollo & Balakrishnan, 2014). Smallen (2016) reported, for the year of 2015, the passage of 895.5 million passengers, traveling on domestic and international flights to or from the United States of America (USA), and 9 526 flights. As a result of the volume is the congestion of the system caused by the disproportional growth between flights and airport capacity. The U.S. Department of Transportation (DOT) (2004) define the airport capacity as the number of departures and arrivals per hour that an airport can sustain with security.
This volume, together with several factors, makes two possible scenarios. In the best scenario, is possible to exchange aircraft between flights or to request aircrafts that are not currently being used. In the worst scenario, could result the cancellation and/or delay of the flight (Jarrah, Yu, Krishnamurthy, & Rakshit, 1993).
As factors exists the mechanical problems, atmospheric conditions and air traffic control issues. Delay propagation is also a factor for delays. It is defined by AhmadBeygi, Cohn, Guan, & Belobaba (2008) as a flight delay on arrival that originate flight delay in departures when a scheduled flight depends on a specific airplane or cabin crew.
Additionally, factors such as the scarcity of labor in sectors that can cause delays (holds, mechanics, etc.) and the changes in traffic management using initiatives such as Ground Delay Programs (GDP), promote delays. GDP is seen as initiatives that represent traffic management procedures where airplanes are delayed at their departure airport to manage demand and capacity at their arrival airport (Yablonsky et al., 2014).
Therefore, it becomes necessary to realize what is a flight delay. For the Bureau of Transportation Statistics (BTS) (2016a) a flight delay is defined as a flight that is more than fifteen (15) minutes late than the scheduled time.
Airports and airlines are often associated with the image of a city or country, having a considerable impact on the local, national and international economy (Guimerà & Amaral, 2004). A study, developed by Ball et al. (2010), estimated the total impact of the costs of delays in the American economy by 32.9 billion dollars. This cost is composed of two types of costs, indirect and direct.
2 Robert Toru Kiyosaki is an American author, public speaker and investor (for more info go to
2 Indirectly, the inefficiency in the airline industry increases the cost of doing business to other sectors, making the associated business less productive, reflecting a reduction of 4 billion dollars in the country’s Gross Domestic Product (GDP). Directly, delays represent a cost of 28.9 billion dollars where:
▪ 16.7 billion dollars represents the passenger component (lost time, delayed flights, missed connections, among others);
▪ 8.3 billion dollars refers to the airline component (technical team, fuel, maintenance, among others);
▪ 3.9 billion dollars relates to customers who avoid traveling because of delays.
This phenomenon, in addition to quantitative costs, also has qualitative costs that influence the former one. For the passenger, affects his plans, which can cause displeasure regarding the company. According to the Aviation Consumer Protection Division (ACPD) from the Office of Aviation Enforcement and Proceedings (OAEP) (2016) between January and December of 2015, six thousand, four hundred and thirty-three (6433) consumer complaints were reported regarding flight problems such as cancellations, delays, and missed connections. As a result, representing a qualitative cost to the airline, demand, and reputation may be adversely affected when there is competition on the same route because passenger’s choice of airline can be based on past events (Mazzeo, 2003). The concept of traveling has been shaping over time. In the past, it was seen as a privilege. Over the years the circumstances have changed, and today, travel often represents a necessary evil. A result of air delays, increased security measures, and degradation of services provided (Ball et al., 2010). The analysis of air delays becomes vital since a better knowledge of their existence, and corresponding triggers, can improve the performance of airlines and, consequently airports, in their operations by the possibility of anticipation (Yablonsky et al., 2014) and construction of schedules for example.
It should be considered the analysis of the delays with focus on the arrivals since these are more related with the passenger's satisfaction and because one arrival delay may trigger a delay in a departure (Tu, Ball, & Jank, 2008a).
Based on reports from several airports around the world, passenger traffic results for the busiest airports in 2015 put on top the Hartsfield-Jackson International Airport in Atlanta. Year after year, it showed a growth of 5.5% of passenger traffic reaching a record of more than 100 million passengers in that same year. This airport benefits from its strategic location being a major "gateway" to entry into North America, and also distance itself of a two hour flight from 80% of the population of the USA. In the 2015 International Airports Council report it occupies the first place both in the ranking of total passenger traffic – 101 491 106 passengers (Table 1) – and in the ranking of aircraft movements (Table 2) (Airports Council International, 2016).
Rank Airport city Passengers
1 Atlanta 101 491 106
2 Beijing 89 938 628
3
4 Chicago 76 949 504
5 Tokyo 75 316 718
Table 1: Total passengers traffic in 2015
Source: Made by the author, adapted from (Airports Council International, 2016)
Rank Airport city Aircraft Movements
1 Atlanta 882 497
2 Chicago 875 136
3 Dallas 681 244
4 Los Angeles 655 564
5 Beijing 590 169
Table 2: Aircraft movements in 2015
Source: Made by the author, adapted from (Airports Council International, 2016)
1.2. O
BJECTIVETo characterize a flight, data as the information of airplane number, the airline company, the origin and destination, the schedule and actual departure and arrival time, the weather conditions, among others are typically used (Abdel-Aty, Lee, Bai, Li, & Michalak, 2007; AhmadBeygi et al., 2008; Belcastro et al., 2016; Choi et al., 2016; Ionescu, Gwiggner, & Kliewer, 2016; Khanmohammadi, Tutun, & Kucuk, 2016; M. S. Kim, 2016; Y. J. Kim et al., 2016; Klein, Craun, & Lee, 2010; Mueller & Chatterji, 2002; Pyrgiotis, Malone, & Odoni, 2013; Qianya, Lei, Rong, Bin, & Xinhong, 2015; Rebollo & Balakrishnan, 2014; Xu, Donohue, Laskey, & Chen, 2005; Yao, Jiandong, & Tao, 2010; Zonglei, Jiandong, & Tao, 2009). This data can become valuable when applied in a model for forecasting delays in future flights.
Thus, with this study, it is intended to predict the occurrence of a delay in the arrivals of Hartsfield-Jackson International Airport based on the referred variables, further ones considered in the Methodology chapter, and their respective contribution to the delay.
The steps required to reach the final objective undergo:
▪ Construct a database with information concerning the flights and additional information;
▪ Explore the delays accordingly to different variables;
▪ Construct a predictive model using Data Mining and Machine Learning techniques to predict the delay of a flight in the arrival;
▪ Apply the model developed in new data to make predictions and see which fits better to the problem according to the desired advance of the prediction;
▪ Identify the variables that contribute most to the existence of delay.
At the end of this project is expected to reach an algorithm that performs better in the data according to the desired advance of the prediction. Subsequently, these results can be compared to results presented in earlier studies with the same context of this work.
4
1.3. S
TUDYO
UTLINEThis project presents an introductory chapter explaining the context in which the theme is inserted and nowadays relevance, as well as the main objectives adjacent to this work.
Chapter two presents a literature review about the need for KDD, Data Mining, and Machine Learning when dealing with issues where large volumes of data are inherent, such as airborne delays. It also presents state of the art, about the study of air delays, both at an industrial community level as well as at the scientific community level.
The third chapter exhibit the various stages defined for the development of this work. Here, the scope of the study is defined. The entire process of making the data available, processing and construction of the dataset is explained. Also, the various decisions made regarding the data preprocessing and transformation as well as the selection of the algorithm are described.
In the fourth chapter, the results of the application of the methodology chapter are illustrated and analyzed. The best approaches are selected for each of the algorithms chosen, and for each of the hypothesis of advance of the prediction. Furthermore, our results are compared to studies in the same area of research and with the same target type variables, but also to websites that predicts delays.
Following is the fifth chapter, where is present the conclusions underlying this work, as well as the chosen of the best model among all algorithms and approaches. Limitations and future works are proposed in the sixth chapter.
5
2. LITERATURE REVIEW
We are drowning in information but starved for knowledge. – John Naisbitt3 According to Yablonsky et al. (2014) in June 2010 an inquiry was made about the twelve most troublesome aspects of travelling. The flight delays held the seventh place with a score of 6.8 according to the scale of 1 (less annoying) to 10 (more annoying).
Since 2010, the amount of delays has been fluctuating, with the year of 2014 having the highest percentage of delay. In 2015, the percentage of delayed flights was 19.53%, the third highest value since 2010 (Figure 1).
Over time it has become a phenomenon of great importance. As in other areas, there is a growing number of unstructured records that have been stored and do not add value to their pure state. Witten, Frank, & Hall (2011a) mentioned that we are overloaded with data and cannot control the exponential growth around us. More precisely, they mentioned that the amount of data in the world's databases doubles every twenty (20) months. In a business context, the large volume of data prevents the effective use of the same to create business value, competitiveness and efficiency. This made the lack of understanding in how to reach advantageous information a colossal obstacle (Lavalle, Lesser, Shockley, Hopkins, & Kruschwitz, 2011).
As a result, a gap is created between the production of data and our understanding of it. It is crucial to overcome this deficit because in data there is information beneficial to decision making, and consequently knowledge. To acquire knowledge from data the use of tools is required to allow the discovery of hidden information in these databases. According to Fayyad, Piatetsky-Shapiro, & Smyth (1996), the field of Knowledge Discovery in Databases, known as KDD (Knowledge Discovery Database) is the provider of the necessary tools and theories.
KDD consists of the process of discovering new, valid, useful and perceptible patterns in the data (Fayyad, n.d.; Mariscal, Marbán, & Fernández, 2010). Covers phases such as (1) the selection or
3 John Naisbitt is an American author and public speaker in the area of futures studies (for more
information go to https://en.wikipedia.org/wiki/John_Naisbitt)
Figure 1: Percentage of total delayed flights per year in the USA, 2010-2017 Source: Made by the author, adapted from (Bureau of Transportation Statistics, 2017)
6 creation of a dataset used as the basis for the discovery of standards. (2) The preprocessing of the same ones where unnecessary information is eliminated and corrected to assure the coherence of the same. (3) The transformation of data by reducing dimensionality or transforming existing ones. (4) The application of Data Mining (DM) where one looks for patterns in the data depending on the objective. And, finally, (5) the interpretation and evaluation of the results (Azevedo & Santos, 2008).
Figure 2: KDD Process
Source: Made by the author, adapted from (Kononenko & Kukar, 2007b)
Thus, DM is considered one of the steps of KDD as presented in (Fayyad, n.d.; Fayyad et al., 1996; Han & Kamber, 2011; Kononenko & Kukar, 2007b; X. W. X. Wang, 2009). It represents the application of algorithms to extract patterns from the data, translating in information (Fayyad et al., 1996). It has two main objectives. The first, forecasting, where future data are predicted about a particular variable of interest based on other variables present in the database (past information). And the second, description, where the focus goes through the discovery of patterns hidden in the data (X. W. X. Wang, 2009).
As a result, resort to DM and Machine Learning (ML) techniques have gained importance in solving these problems. The use of DM in this type of study is because it is a discipline that focuses on the discovery of knowledge in the data having as one of the objectives, the prediction of unknown data or future events as already mentioned (Kantardzic, 2011). On the other hand, ML is used for DM since it is a type of approach to the discovery of knowledge in the data. Focus on the construction of computational algorithms that can learn through data (from the past) to make predictions (Witten et al., 2011a). These disciplines, represented in Figure 3, enable better decisions and actions in real time without human intervention because of their high-value predictions (SAS, 2017). Belcastro, Marozzo, Talia, & Trunfio (2016) claim that the use of ML techniques associated with DM tools can help to perceive complex phenomena as well as solve various problems from many areas.
The importance of flight delays made them the center of many investigations by both the industrial and scientific community.
An example of the first strand is Kaggle. Kaggle is a platform for analysis and predictive modeling competitions. There, companies and researchers publish data for people that have interest and knowledge in the field to compete in the production of models where can be rewarded with monetary awards.
Figure 3: Relation between Knowledge Discovery Database
(KDD), Data mining (DM) and Machine Learning (ML) Source: Made By the author, adapted from (Kononenko &
7 This type of mechanism provided GE Aviation, in collaboration with Alaska Airlines, to launch a contest. The contest was the GE Flight Quest, where 173 teams competed with their algorithms to get a model that predicted delays with good performance (GE Aviation, 2012). DOT, as well as other companies, have provided data on air delays and cancellations so that users could predict which airlines were the best to travel (U.S. Department of Transportation, 2017).
On the other hand - scientific area -, several approaches were proposed by researchers to forecast and model delays. These approaches vary according to the different objectives of the forecast regarding the following three aspects:
▪ Network – when looking at the delay in several airports and the impact of it on the level of all airports, or a group of them;
▪ Airport – when the focus is on the study of the state of the delay, for example, about an airport - and, lastly;
▪ Flight – when is wanted to predict the delay of each flight.
It is also possible to distinguish the type of approach used in the development of these studies (Sternberg, Soares, Carvalho, & Ogasawara, 2017), such as:
▪ Statistical Analysis (SA) – covers the use of regression models, correlation analysis, econometric models, parametric and non-parametric tests, multivariate analysis, among others;
▪ Machine Learning (ML) – consists of a research/investigation that explores the development of computational algorithms that can learn from data and provide predictions from them;
▪ Operational Research (OR) – includes the development of advanced analysis models (e.g., optimization, simulation, queue theory, among others) to help stakeholders make better decisions;
▪ Probabilistic Models (PM) – covers analysis tools that estimate the probability of an event based on historical data.
For an understanding of what each author studied, and what type of approach implemented (it can be seen a summary in Figure 4) it is important to contextualize it.
In this way, at a Network level, several investigators used Machine Learning methods to understand the delays. Rebollo & Balakrishnan (2014) predicted delays in two ways. Through classification where they classified a departure delay as being more or less than a predefined threshold. And, through regression, where they estimated a future delay in departure on a specific route. Results of the study showed an average precision of 81% in the performance of Random Forests, algorithm selected for the classification, and a mean prediction error of the regression of 21 minutes. It should be noted that, for both means of forecasting, the error increased as the forecast advance also increased. Xu, Donohue, Laskey, & Chen (2005) have created a methodology for representing and analyzing how system-wide effects arisen from subsystem-level causes through a Bayesian Network to estimate the delay propagation. The model created used an equation of linear regression as a priori probability (error rate of 19.1%) having superior performance about the other methods studied. The other methods comprise models where the Bayesian Network was estimated with the parameters of the
8 training data using a uniform prior distribution (38.1% error rate), and where the model was based on a linear regression (error rate of 61.9%). Thus, the authors concluded that the method could be extended by including more airports.
Qianya, Lei, Rong, Bin, & Xinhong (2015), and Rong, Qianya, Bo, Jing, & Dongdong (2015) have presented a method of analysis for flight delays also based on Bayesian Networks that could analyze and predict the delay during a flight. They analyzed the performance of the prior probabilities, created from (1) historical flight data statistics, (2) posterior probabilities using the Expectation-Maximization (EM) algorithm based on the finite Gaussian mixture model and (3) real data. They concluded that prior probabilities were more accurate (81.95%) proving that Bayesian Networks are an effective method for analyzing flights delays and that, as in the previous study (Xu et al., 2005), they have a great value to analyze system-level effects that result from lower-level causes.
AhmadBeygi, Cohn, Guan, & Belobaba (2008) analyzed the potential for delays to spread due to airlines. For that, they used propagation trees to compare two airlines. They concluded that the key points that had an impact on slowing the spread of delay were when cabin crews end their shift, and when cabin crew and airplanes were always together on all planned flights.
Zonglei, Jiandong, & Tao (2009) built a recommendation system to alert airports by monitoring related airports and informing the status of the delay.
However, other researchers have resorted to Operational Research methods to realize the delay. Pyrgiotis, Malone, & Odoni (2013) considered the propagation of delays in the airport network through a delay propagation algorithm (DPA). This tracked the spread of airport-calculated delays and their impact on the airport network. The authors mentioned that the goal was not to reproduce the exact delays but rather the trends and behaviors that are observed in the NAS system - network. In Ionescu, Gwiggner, & Kliewer (2016) the main objective was to understand the potential of delay modeled through data used in the robust programming of airline resources. They provided a regression modeling approach for daily delay patterns based on the detection of spatiotemporal patterns in historical data. As a result, rules emerged, where precision was assessed through statistical modeling and compared to non-parametric random forests. They presented, given all decision rules as a whole, a 62.9% accuracy that could be compared to the random forests. However, the latter present an individual categorization and selection of rules as well as a lack of interpretation accordingly to the authors, contrary to the rules presented by them. They added that a possible delay might already have been taken into account through airline scheduling decisions, which is normal, questioning the generalization of their results to other data from other airlines.
Tu et al. (2008a) and Mueller & Chatterji (2002) used Probabilistic Models to model their problems. The former developed a strategic model to estimate delays in departures. They used non-parametric methods for daily and seasonal trends of delay propagation to predict departure delays, and mixture distribution to estimate residual errors, used to calculate the probability of the delay. According to the authors, it presented a reasonable adjustment quality, robustness in the choice of parameters and good forecasting capabilities and could be easily adapted to other airport /airline combinations. The latter set out to improve the accuracy of forecasting delays by calculating the probability of departure, en-route and arrival delay using Poisson and Normal distributions. This study resulted in
9 several delay metrics for the analysis of an airport network (all ten airports experiencing significant delays), based on individual airports through its 21-day review period. They concluded that the departure delay is better modeled through a Poisson distribution whereas, the en-route and the arrival delay fit the Normal distribution better. In addition, the authors also used the Probabilistic Models for analysing the delay at a Airport Level.
As previously mentioned, Pyrgiotis, Malone, & Odoni (2013) used Operational Research to analyze the spread of airport delay and network impact. They used the Approximate Network Delays (AND) model composed of queueing theory (QE) to calculate the individual airport mode delay and to be able to analyze the network.
Yablonsky et al. (2014) and Klein, Craun, & Lee (2010) resorted to Statistical Analysis. The first ones focused on the average delay time at Hartsfield-Jackson Atlanta International Airport based on data for several years. The main objective was to determine the annual cyclical delays. They considered that the information resulting from their study was relevant when forecasting periods of air delays. Concluded that there is an annual pattern of delays being caused by the volume of flights at the airport and the amount, and frequency, of precipitation occurring in Atlanta.
The second ones, developed a model through multiple linear regression focusing in climate-related delays. They were based on a metric that helps to estimate the impact of climate on flight schedules, and an impact metric that helps predict expected weather in the flight time, WITI (Weather Impacted Traffic Index) and WITI-FA (Weather Impacted Traffic Index - Forecast Accuracy), respectively. They claimed that 70% of the delay could be explained by the WITI factors used as explanatory variables and that the model predicted the time and magnitude of the climate impact on delay successfully. On the other hand, there were also those who used Machine Learning to predict the delay at the airport level. Zonglei, Jiandong, & Tao (2009) focus on predicting the seriousness of the delay at specific airports to monitor airport delays and alerting specific airports through a recommendation system. In this case a Chinese airport was analysed to understand how this delay could influence the delay at a network level and other airports related to it. To predict the seriousness of the delay at China's airport, they based on the K-Nearest Neighbor algorithm using historical data to compare and recognize similar situations in the past. The authors concluded that, since the forecast is based on the comparison and analysis of historical data, the proposed model reflected a precise and rapid forecast offering logical explanations. Previously, Zonglei, Jiandong, & Guansheng (2008) already had presented a method, where instead of based on a recommendation system they based on machine learning, however, it also served as a large alert for flight delays. They used non-supervised learning methods, more specifically clustering with the K-means algorithm, to extract classes of airport delay, and then used it to predict the class of delay of the airport in each day by applying a supervised learning method to the data. They compared several supervised learning methods to predict the delay class, and decision trees were the ones that stood out with 80% of confidence.
Smith & Sherry (2008) developed a process using the Support Vector Machine (SVM). With it a climate forecast for a particular area could be used as input in estimating an airport's delay. Having also the ability to predict the impact of weather on future flights, i.e. how long could expect a flight to be delayed due to the weather. This model, according to the authors, showed to be correct 83% of the time.
10 Yao, Jiandong, & Tao (2010) have focused on predicting the delay propagation - through a proposed algorithm - caused by aircraft, cockpit and cabin crew. The predicition was for situations where it is necessary to wait for these elements. For example, if a flight is delayed and, at its destination, the aircraft or cabin crew are needed for another flight, they will delay the latter as a domino effect. Used the results to create and provide an alarm rank of flight delays to airports. They stated that their model and algorithm could be used to efficiently calculate the propagation of delays caused by required flight resources on the same flight.
Balakrishna, Ganesan, Sherry, & Levy (2008) applied a Reinforcement Learning (RL) algorithm to estimate the taxi-out time (time between the departure of a plane from the boarding gate and the time it takes flight). The Markov decision process was used to model the problem being solved through Machine Learning Reinforcement Learning algorithm. The authors were able to achieve 60% accuracy of the model.
Y. J. Kim, Choi, Briceno, & Mavris (2016) have proposed recurrent neural networks as a method of predicting the status of day-to-day airport-level delay due to capturing sequential and temporal relationships in the data. Stated that the application of Long Short-Term Memory Recurrent Neural Networks (LSTM RNN) architectures in the forecast model allowed a more reliable acquire on one-day delay status of an aiport.
However, the area of interest in this study is the prediction of delay in an Individual Flight level and not the ones mentioned above. As such, some studies have been proposed in which the delay of an individual flight was the objective to the forecast.
Some authors used Statistical Analysis to understand and detect patterns on a flight. Abdel-Aty, Lee, Bai, Li, & Michalak (2007) have evaluated the performance on the arrival of a flight, through a two-stage approach using mathematical frequency analysis. They were able to identify patterns of delay where it was possible to determine which were the most important variables that affected the delay. Subsequently, the relationship between the variables and the delay was investigated through statistical techniques in which the periodic patterns of delays were examined. Through their results, they observed that the delay of a flight was associated with the precipitation, flight distance, time of the year, the day of the week, time of arrival and space of time between the arrival of two successive flights. Accordingly to the authors, their model could be adjusted itself to any type of data.
M. S. Kim (2016), concluded that the Spline Smoothing regression model surpasses the linear regression and median regression models in prediction performance. It adjusted better to the data and was the one that represented the delays both in the long term and in the short term. He considered that the variables of delay departure, flight time, airline, weather conditions and time of the year were relevant in the accuracy of the forecast, and the use of the delay variable at departure significantly improved the accuracy. Later, included in his study the area of Probabilistic Models, and suggested a method to calculate the probability of the time of arrival of a flight adjusting the residuals of the model to a distribution Skew t.
Other authors resorted to Machine Learning for the purpose being the focus of our study.
Y. J. Kim, Choi, Briceno, & Mavris (2016) as already mentioned, in addition to predicting the status of the day-to-day delay at an airport level used neural networks to be able to predict the class of the
11 delay of an individual flight. Gathered data about the flight data (day, season, month, date, origin, destination, schedule times) and weather data (wind direction, wind speed, cloud height, visibility, precipitation, snow accumulation, intensity, descriptor and observation code). Furthermore, allied the status of the day delay computed in the first stage of their study. They showed that their model achieved 87.42% accuracy, better than the best predictions until then demonstrated, 83.4% and 81% (Choi, Kim, Briceno, & Mavris (2016) and Rebollo & Balakrishnan (2014), respectively). Due to the acquisition of a more reliable day-delay status using Long Short-Term Memory Recurrent Neural Networks (LSTM RNN) architectures, the forecast model of the delay state of an individual flight also became more accurate.
Choi, Kim, Briceno, & Mavris (2016) also presented a classification model in which the main objective was to exclusively predict flight delays of individual flights caused by climatic conditions. They used data collected from the BTS airline On-time Performance dataset for the years of 2005 to 2015 using features like flight schedules and day. Also included weather conditions variables obtained by the Integrated Surface database of the National Oceanic and Atmospheric Administration (NOAA), at the origin (Denver International Airport) and the destination (Charlotte Douglas International Airport). For the purpose, resorted to the use of algorithms of data mining and machine learning. Considered that the best classifier was the Random Forest based on their results. They also studied the accuracy of the results for different horizons (5, 1 and 0 days) and concluded that results with real climatic conditions have better accuracy (26.79%, 30.36%, and 80.36% respectively). They mentioned that accuracy is higher when sampling technique is not applied and understand that this happened because classifiers are biased towards the on-time class, the majority.
In the same line of thought, Belcastro, Marozzo, Talia, & Trunfio (2016) applied a parallel version of the random forest algorithm to predict the delay in the arrival of a flight due to the weather. The main objective was to be able to predict, with a few days in advance, the delay in the arrival of an individual flight due to the weather. They used data about the flight information such as schedule times but also origin and destination from the airline on-time performance (AOTP) dataset from RITA-BTS comprising the years of 2009 till 2013. Joined variables of weather conditions (temperature, humidity, wind direction and speed, barometric pressure, sky conditions, visibility and weather phenomena descriptor) at the origin and destination accordingly to the flight timetable acquired from the Quality Controlled Local Climatological Data (QCLCD) dataset from the National Climatic Data Center. Finally, they stated that the model had an accuracy of 85.8% for a threshold of 60 minutes and that even if they did not consider the weather the model would achieve an accuracy of 69.1%. Nonetheless, when considering a threshold of 15 minutes, it achieved 74.20% of accuracy. The work presented here, in contrast to others already mentioned, intends to develop an algorithm to predict the delay in an individual flight taking into account (1) flight information, similar to Y. J. Kim, Choi, Briceno, & Mavris (2016) and Zonglei, Jiandong, & Guansheng (2008); (2) climate at origin and destination, similar to Belcastro, Marozzo, Talia, & Trunfio (2016) and Choi, Kim, Briceno, & Mavris (2016), but also; (3) information of the aircraft as well as (4) possible congestion of the system. Having the purpose of understanding if it is possible, to improve the performance of the models already presented in this type of approach (machine learning) and with this objective (individual flight prediction).
12
Figure 4: Literature Review
13
3. METHODOLOGY
Information is not Knowledge. – Albert Einstein (1879-1955)4 This section presents a methodology that describes the data sources, the validation process of input data formats and following treatment for integration in the construction of the final dataset. Subsequently, a description of the methods used for partitioning the dataset as well as the type of sampling is given. It is also presented the procedure for pre-processing and transforming the variables. And finally, an explanation of the classification methods that will be applied, as well as the techniques of evaluation of the classifiers used to assess their performance is presented as illustrated below in Figure 5.
For the development of this project, different tools for each phase were needed. The tools for the collection and integration of the data – first phase – were Microsoft Excel and SQL Server 2014 Management Studio.
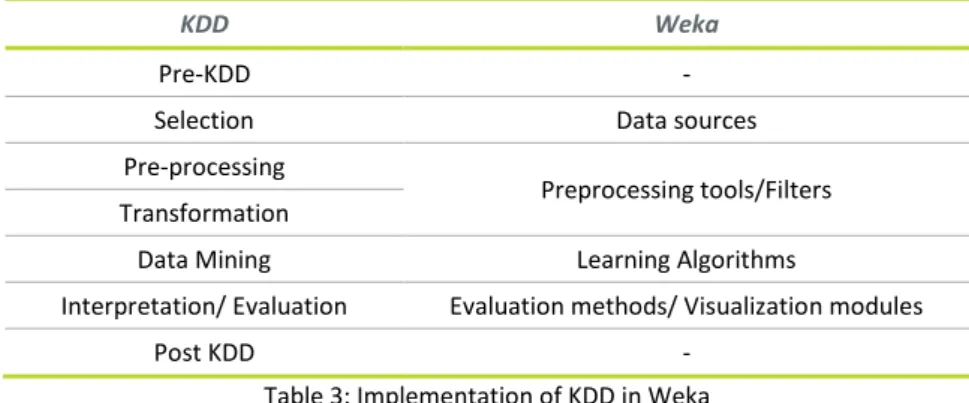
For the second phase, Waikato Environment for Knowledge Analysis software, also known as Weka, was used. It is an open source software developed at the University of Waikato in New Zealand, and it is considered a significative collection of machine learning algorithms and data preprocessing tools. It supports KDD and DM processes through an interface where users can compare different methods and identify those that best fit the problem under analysis (Witten, Frank, & Hall, 2011b)(Table 3). For Zupan and Demsar (2008) it is a well-known open source software for ML and DM. It allows for advanced users to use it through Java programming or its programming interface, Command-line interface (CLI). And for other users, with fewer skills of programming, it can be used through its graphical interface, KnowledgeFlow, which provides the design of the flow for data loading and processing, application of algorithms, their evaluation and visualization of results. Also through its slightly more limited but easy-to-use interface, where preliminary data experience is enabled, Explorer. And, its interface where is easier to compare the performance of different classifiers at the same time and identify which is the most appropriate for the problem, Experimenter (M. Hall et al., 2009; Witten et al., 2011b). It has become a reference and a growing tool for the ML community attracting many users and researchers (Muenchen, 2017).
4 Albert Einstein was a German theoretical physicist (for more information go to
https://en.wikipedia.org/wiki/Albert_Einstein)
Figure 5: Work Project Methodology Source: Made by the author
14
KDD Weka
Pre-KDD -
Selection Data sources Pre-processing
Preprocessing tools/Filters Transformation
Data Mining Learning Algorithms
Interpretation/ Evaluation Evaluation methods/ Visualization modules
Post KDD -
Table 3: Implementation of KDD in Weka Source: Made by the author
3.1. S
ELECTIONIn this sub-theme, the necessary steps to get to the final dataset, containing only the data of interest for the study, are covered. First, the scope of the study and the time interval defined in the extraction of the data are mentioned. Subsequently, the presentation of the data is done by describing the sources from which the raw data, necessary to assemble the final dataset, were extracted. The validation of data consistency, due to the need of merging data from different sources. And at last, the rationale followed for the integration of the three sources in a single database as well as the construction of the final dataset with the presentation of the variables chosen and their description are presented.
3.1.1. Study Scope
3.1.1.1. Geographical
The geographical scope of the study is the United States of America. The flights that were used as study object were the domestic arrival flights to Hartsfield-Jackson Airport, in the city of Atlanta, which is part of the State of Georgia located in the Southeast area of the USA.
3.1.1.2. Temporal
To guarantee the representativeness of all the seasons of the year and a good performance of the model, two months of each year of 2015 will be used as a study base, due to be the last full year at the time of data extraction. Therefore, based on Table 4, the months that were used were April, May, July, August, October, November, January and February.
Season of the year Start date End date
Spring 21st of March 20th of June
Summer 21st of June 20th of September
Autumn 21st of September 20th of December
Winter 21st of December 20th of March
Table 4: Seasons of the Year in the Northern Hemisphere Source: Made by the author
15
3.1.2. Data
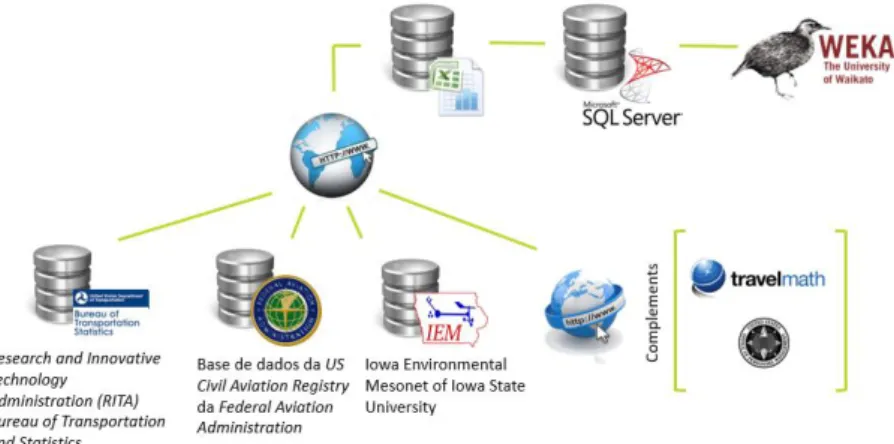
Figure 6: Data acquisition and preparation steps for upload in WEKA Source: Made by the author
3.1.2.1. Sources
Since the centrality of information in a single source is not possible due to the need of different types of data that could represent the possible factors causing the delays, the collection of the data from different platforms described below was carried out.
A. Bureau of Transportation Statistics (BTS)
The Bureau of Transportation Statistics provides compiled data on U.S. transportation systems. It also improves the quality and effectiveness of the Department of Transportation's statistical programs through research, development, and promotion of improvements in data acquisition and use. Is part of the Research and Innovative Technology Administration (RITA) - a unit of the US Department of Transportation (DOT) - and is one of the lead agencies in the U.S. Federal Statistical System. The data of interest comes from service of the BTS, Transtats, a database with information on on-time performance. From this source information about flights can be extracted (Bureau of Transportation Statistics, 2016b);
B. Federal Aviation Administration (FAA)
The U.S. government is responsible for regulations and all matters related to civil aviation in the country from the construction and operation of airports to the air traffic management and certification of personnel and airplanes, among other responsibilities. It provides different databases: the one used to obtain information about the airplane used in a particular flight was the one referring to the U.S. civil aviation register (Federal Aviation Administration, 2016a);
C. Iowa Environmental Mesonet (IEM)
Iowa Environmental Mesonet is a website of the Agronomy Department of Iowa State University of Science and Technology that aims to gather, collect (from existing resources), compare, disseminate and archive observations (Department of Agronomy, 2017a). It is a valuable resource for anyone who searches for overlaid information as well as for historical comparisons. It puts data in useable formats which others can use it and share being the number one provider of weather service information to the National Weather Service (Herzmann, Klein, & Taylor, 2013). To acquire climatic data, the archive of automated airport weather observations from the entire world maintained by
16 the IEM was accessed. These observations are called ASOS (or METAR - Meteorological Terminal Air Report -, a generic term format for reporting weather information), provided by the Automated Surface Observing System (Department of Agronomy, 2017b). This type of system is located at airports for aviation support and weather prediction, providing essential observations for the National Weather Service (NWS), the Federal Aviation Administration (FAA), and the Department of Defense (DOD) (Department of Agronomy, 2017c; Nadolski, 1998).
D. Complements
In order to acquire additional data, other two different sources to complement the three initial ones for the creation of further variables were used.
▪ Travel Math used to attain information on the time zone between origin-destination pairs (TravelMath, 2017a) and also to obtain information about the time flight duration of a route (TravelMath, 2017b);
▪ Office of Personnel Management (OPM), that “provides human resources, leadership, and support to Federal agencies and helps the Federal workforce achieve their aspirations as they serve the American people” (U.S. Office of Personnel Management, 2017a). This was consulted to access the federal holidays on the year of 2015 (U.S. Office of Personnel Management, 2017b).
3.1.2.2. Data Validation and Limitations
The use of data from different sources can lead to inconsistency and, consequently, lack of compatibility. From this result the Merge/Purge problem, a term designated by the companies, and explained as the existence of data fields that may be different between datasets or that may be incorrect (due to representation, unity, along with others)(Hernández & Stolfo, 1998).
For this phase and to avoid the problem above mentioned, a significant amount of time was spent preparing and analyzing the veracity and consistency of the vast volume of data acquired from the three different sources, making their compatibility possible.
Regarding the flight information, there was a need to provide understanding, and to allow further calculations between variables for the creation of new ones. This was accomplished by modifying the way variables were represented turning them into specific variables of time. This also made easy querying between tables for further variables creation possible.
When dealing with the need for information about the airplane, it was necessary to validate the key variable between the RITA database and the information needed: The N-Number. It refers to a single alphanumeric number registered within the National Aviation Authority (NAA) which identifies the airplane and the country in which it was registered (Federal Aviation Administration, 2015).
Regarding the weather information, duplicate records elimination was necessary as well as the correction of information of present weather codes assumed by the Microsoft Excel as functions and not text.
The necessary transformations were possible using Excel formulas and its programming language VBA. More detailed information can be consulted in Annex 1 on the Annexes chapter.
17
3.1.2.3. Dataset Construction and Description
Given (1) the need to integrate all data described above; (2) the possibility of crossing it on the same place; (3) the wish for searching and selection of specific data, and (4) due to the high number of records collected, it was necessary to create a database first.
In order create the database, a design of a relational entity model was done. This model was initially proposed by Chen (1976), due to its enormous use and acceptance in the area (Tryfona, Busborg, & Christiansen, 1999) and to the basis it provides for a single view of the data (Chen, 1976). The choice of this model was based on its main characteristics: simplicity and clarity of concepts (Fahrner & Vossen, 1995). It represented information, through its concepts, regarding entities, attributes and associations (relations) (Teorey, Yang, & Fry, 1986).
The steps required for the design of the database model consist of (1) understanding what is necessary to build it, regarding entities and relations of interest (e.g., identifying all the entities that are needed, among all the information available, to construct the final table). (2) Identifying information that can classify the type of relationships between entities (e.g., understandiing the relationships between information of weather and flight observation locations as well as between routes and flight information). (3) Defining the attributes of each entity (e.g., for the weather entity the attributes were the variables extracted from the IEM website; the same happens with the flight entity that was composed by the attributes extracted from the RITA database). And, finally, (4) organizing the data into entity/relation relations and seeing the primary keys of each entity (e.g., understanding from which attributes we are able to link different entities to build the final table)(Chen, 1976).
Following the steps mentioned above, the physical model of the relational entity was designed, using the Crow's Foot notation. Through this notation, the primary and foreign keys, and the names of the tables and the columns were defined, as well as the type of data accepted in each column to understand exactly how the model would be created in the database and to have a defined idea of what would be necessary (Annex 2 of Annexes chapter).
From this model, it was necessary to resort to SQL Server 2014 Management Studio to implement the drawing by creating tables and their relationships. Subsequently, due to the non-existence of a dataset that responded to the existing need in this study, it was necessary to create one using the querying logic of the database to obtain a final table as a result of the query and intersection of existing tables in the database created.
Previously, in chapter one - Introduction -, some of the factors that caused the delays were presented. Based on these, the final dataset and the choice of its variables was made having in mind the importance and need of each one as the cause of delay in the flights.
For that reason, the independent variables that were chosen based on previous articles are presented below - distinguished by importance and purpose.
A. Variables of flight information
These variables were used to give details about each flight and situate it in a chronological space, making it possible to understand patterns in delay behavior by the time of the year, time of the day and by distances. All chronological variables, after being used to obtain other variables, were