EFFECT OF COMBINED FUNCTION OF TEMPERATURE AND WATER ACTIVITY ON THE GROWTH OF VIBRIO HARVEYI
Kang Zhou1,2, Meng Gui2, Pinglan Li2*, Shaohua Xing2, Tingting Cui2, Zhaohui Peng2
1
College of Food Science, Sichuan Agricultural University, Yaan, 625014, China; 2 Beijing Higher Institution Engineering Research Center of Animal Product, College of Food Science & Nutritional Engineering, China Agricultural University, Beijing,
100083, China.
Submitted: January 21, 2010; Returned to authors for corrections: November 15, 2010; Approved: June 07, 2012.
ABSTRACT
Vibrio harveyi is considered as a causative agent of the systemic disease, vibriosis, which occurs in many biological fields. The effects of temperatures (12.9-27.1 oC) and water activity (NaCl% 0.6%-3.4%) on V. harveyi were investigated. The behavior and growth characteristics of V. harveyi was studied and modeled. Growth curves were fitted by using Gompertz and Baranyi models, and the Baranyi model showed a better fittness. Then, the maximum growth rates (μmax) and lag phase durations (LPD, λ) obtained from both
Gompertz and Baranyi model were modeled as a combination function of temperature and water activity using the response surface and Arrhenius-Davey models for secondary model. The value of r2, MSE, bias and accuracy factor suggest Baranyi model has better fitness than Gompertz model. Furthermore, validation of the developed models with independent data from ComBase also shown better interrelationship between observed and predicted growth parameter when using Baranyi model.
Key words: Vibrio harveyi, modelling, temperature, water activity
INTRODUCTION
Vibrio harveyi is a gram-negative, motile rod bacterium ubiquitous in marine and estuarine aquatic ecosystems. Although V. harveyi is non pathogenic to human, it is one of causative agents of the systemic fish disease, vibriosis, and sea food spoilage which occurs in many commercially important fish (20), including sharks, seahorse, lobster, shellfish or shrimps (13). Pseudosciaena crocea (big yellow croaker) is an important commercial marine fish in China, and has been widely cultured in hatcheries recent years. However, infectious
vibirosis and spoilage is becoming severe with expanding culture (19).
Traditionally the microbiological safety of food has been established via challenge tests. However, challenge tests have been criticized as an expensive, labor intensive, time consuming and non-cumulative research tool (8). Therefore, mathematical models are being developed for predicting microbial growth. In the research field of predictive microbiology, mathematical modelling is an efficient tool for assessing how individual or combined environmental factors affect microorganisms in foods (17). Various models have been
developed in predictive microbiology for fitting growth curves and estimating biological parameters of food-borne pathogens (9, 11). Predictive microbiology is a useful tool in food industry to predict behaviors of microorganisms (24), where primary model describes the growth data under constant environmental conditions and secondary model describes the dependence of primary model parameters on environmental factors such as temperature, water activity, and pH. Primary models such as Logistic, Gompertz and Baranyi model are often used to fitting microbial growth data. At present, the Baranyi model is getting more popular among researchers and several studies have reported that the Baranyi model performs better (25). There are many types of secondary models used by previous researchers to predict microbial growth under dynamic conditions, including Belehradek-type models, response surface model, Arrhenius-type model and artificial neural networks (7). Therefore by gathering a detailed knowledge of the growth rate response to the dominant environmental parameters of temperature and Aw, it is possible to predict the extent of microbial proliferation under conditions within the range of experimental values tested (12).
In the case of V. harveyi, there was few published study reporting the effects of environmental factors like temperature and Aw on its growth using modelling approaches, and it is also difficult to find the growth data related to V. harveyi in the worldwide growth data-base and predictive software, like ComBase or Growth Predictor. The influence of the modelling and prediction on vibriosis infection and spoilage has been a neglected field of study. Besides, to determines whether predictions provide good description of growth in food, models should be validated to evaluate their predictive ability, like r2 values, mean square error (MSE), bias factor, and accuracy factor, and can also be used as an indication of the reliability of models when applied to food (6).
The aim of this study was to develop predictive models to describe the combined effects of temperature and Aw on the growth rate of V. harveyi for each tested condition. The
temperature and Aw can contribute to understanding the growth dynamics of V. harveyi and the initiation of P. crocea
infection by this microorganism. By evaluated and validated with independent data, the developed models could be successfully employed as an empirical approach in modeling and prediction for risk assessment concerning V. harveyi in P. crocea.
MATERIALS AND METHODS
Bacterial strain
The pathogenic strain was isolated from infected cage cultured large yellow croaker (Pseudosciaena crocea) in Luoyuan Bay in the east of Fujian province, China, and the majority of the micro-organisms in the fish was identified as V. harveyi by standard biochemical testing (21) and designated as
V. harveyi LIZ-42028.
Experimental design
A central composite design (CCD) was applied using Design-Expert Version 7.1.4 (StatEase, Inc., Minneapolis, Minnesota, USA). The variables were temperature (12.9, 15, 20, 25, and 27.1 oC) and water activity determined by concentration of sodium chloride 0.6% (0.997), 1% (0.995), 2% (0.989), 3% (0.983), and 3.4% (0.981).
Media preparation
counts and 8.5 g/l sodium chloride was used for all serial dilutions of the inoculums. All media were autoclaved at 121
o
C for 15 min.
Experimental procedure
Samples of different conditions were incubated in a constant temperature environment stabilized at 12.9, 15, 20, 25, 27.1 oC. At appropriate time intervals during incubation (Fig. 1), decimal dilutions were made from separate battles of TSYEB onto TSYEA. The samples were incubated for 24 h at 30 oC for plate counts. Each experiment was carried out in triplicate, and an average CFU/ml of each sampling point was used to determine estimates of the growth.
Primary modelling
One of the recommended models for describing microbial growth is Gompertz model (25)
( )
( )
e B t Dx t
C
Ae
(1)
where x(t) is log10 (CFU/ml) of cell concentration at time, t; C
is value of lower asymptote in units of log10 (CFU/ml); A is
equal to log10 (xmax/x0); x0 is the initial population density;
xmax is maximum population density; B is maximum relative
growth rate at D in 1/h; D is time at which the absolute growth rate is maximum in hours.
From these parameters, the maximum specific growth rate [μ=B*A/e, log(CFU/ml)h-1, where e=2.7182], the lag phase duration [LPD=D-(1/B), h] were derived.
The flexible function of Baranyi and Roberts (2) was fitted to the growth data by means of the non-linear function of SPSS Version 10.0 (SPSS Inc., Chicago, USA). This enables the determination of the μmax and LPD
max
0 max 0
( )
( )
0 max ( ) __ __
1 1
( ) ( ) ln(1 ) ( ) ln( )
F t
h vt h vt
y y
e
y t y F t where F t t e e e
e v
0
(2)
Where y(t) the ln (CFU/ml) of cell concentration at time, t; y0 the initial cell concentration in ln (CFU/ml) units; ymax the
maximum cell concentration in ln (CFU/ml) units; μmax the
maximum specific growth rate in terms of in (CFU/ml); v the rate of increase of the limiting substrate; h0 is equal to μmaxλ; λ
is lag-phase duration in h. The growth data were fitted again with the Baranyi model, after fixing the value of h0 with the
mean value (1).
Secondary modelling
Two functions were evaluated for their ability to describe the combined influence of temperature and Aw on the μmax and
LPD. These included a response surface (RS) model (3), and the Arrhenius-Davey (AD) model (4), which with a interaction term (Aw / T), as follows:
2 2
max 0 1 2 3 4 5
(
. .
1/ )
Ln
or
C C T C Aw C T Aw C T C A
w
(3)2 2
max
. .
0 1 2 3 4 5(
1/ )
/
/
/
Ln
or
C C T C Aw C Aw T C T C Aw
(4)Where T is degree Celsius (oC) and Aw has transformed to NaCl (%).
The coefficients of these two models and the significance of their associated factors were determined by fitting the models onto the estimated cell μmax or LPD by means of SPSS.
Model validation and statistical evaluation
The quality of fit of a model can be reflected as the regression coefficient (r2), which is often used as an overall measure of the prediction attained. The higher the value (0< r2<1), the better is the prediction by the model.The mean square error (MSE) is a measure of variability remaining. The lower MSE obtained the more satisfying of the model to describe the data.
MSE = ∑(μobserved-μpredicted)2/n (5)
accuracy is the average estimate (14). n is the number of observations; μpredicted is the predicted specific growth rate; μobserved is the observed specific growth rate.
log( ) ( )
_
10
observed predicted nbias
factor
(6)log ( ) 10 _ predicted observed n accuracy factor
(7)
The developed secondary models were validated also with independent data from ComBase database for the growth rate of 155 Vibrio spp. at different temperatures and Aw on TSYEB. The selected data for validation were all within the range of experimental conditions (temperature 12.9 oC-27.1 oC, Aw 0.997-0.981, the KEY is start with ‘Tas’ in ComBase), and then the prediction capability of the models were evaluated by MSE, bias and accuracy factors.
RESULTS
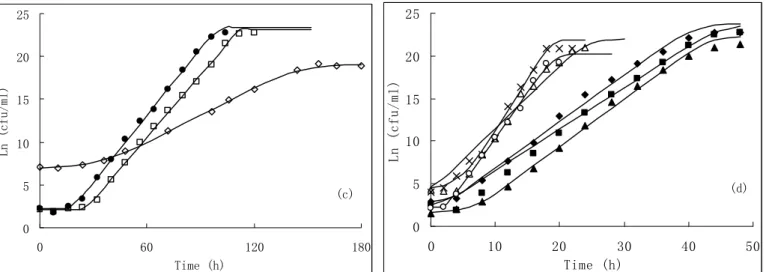
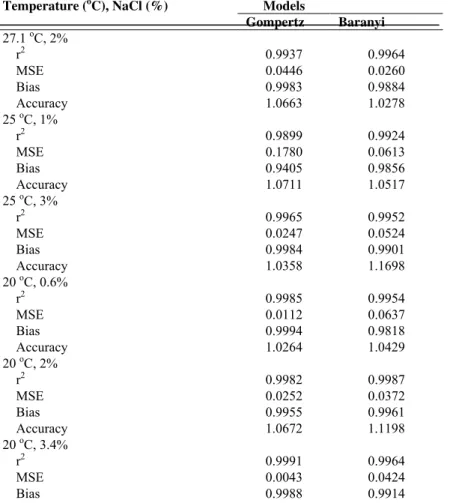
Primary model curve fitting
After plate count of each combination, growth curves of
V. harveyi were obtained by both the Gompertz and Baranyi model. The growth took approximately 144 and 120 h to reach the maximum concentration, when the temperatures were 12.9
o
C and 15 oC respectively. The μmax and LPD of 12.9 oC, 2%
(NaCl%) is 0.0485, 35 h and 0.1112, 35 h fit by Gompertz and Baranyi model respectively. However, it took only 28 h when the temperature is 27.1 oC to reach the maximum concentration. The μmax and LPD of 27.1 oC, 2% (NaCl%) is
0.193, 2.200 h and 1.060, 1.092 h fit by Gompertz and Baranyi model respectively (Fig. 1). The μmax is sensitive to both the
temperature and Aw, whereas the LPD is more rely on temperature, which could also be seen in Fig. 2, 3. All the experimental data obtained from combined effects have been fitted into both the Gompertz and Baranyi (Fig. 1) models.
Table 1 compared the r2, MSE, bias and accuracy factor in different combinations of temperature and Aw of Gompertz and Baranyi model. The r2 and MSE values were not significant different by one-way ANOVA with the p>0.05 for all the parameters. All the r2 > 0.99, and the MSE < 0.1 for Baranyi model, which is better than r2 > 0.98 and MSE < 0.2 for Gompertz model. Furthermore, compare with the indices of all the conditions on average, the r2, MES, bias and accuracy factor of Baranyi are 0.9965, 0.0463, 0.9885, 1.0621, which is more acceptable than Gompertz model with the values are 0.9944, 0.0467, 0.9918, 1.0492. The F-test value of growth rate is 0.64 and lag phase duration is the same between two models, and the F value of r2, MSE, bias and accuracy factor less than the F value from table, so there is no significant difference between two primary models.
0 2 4 6 8 10 12
0 60 120 180
Time (h) L og ( cfu /m l) (a) 0 2 4 6 8 10 12
0 5 10 15 20 25
0 60 120 180
Time (h)
Ln (cfu/
ml)
(c)
0 5 10 15 20 25
0 10 20 30 40 5 Time (h)
Ln
(c
fu
/ml
)
0 (d)
Figure 1. The observed and Gompertz model predicted growth of Vibrio harveyi in different conditions (a), (b); the observed and Baranyi model predicted growth of Vibrio harveyi in different conditions (c), (d). (Scatter dots are observed; curves are predicted).
(◇), 12.9 oC, 2%; (﹡), 15oC, 1%; (●), 15 oC, 3%; (◆), 20 oC, 0.6%; (■), 20 oC, 2%; (▲), 20 oC, 3.4%; (×), 25 oC, 1%; (△), 25
o
C, 3%; (○), 27.1 oC, 2%.
Figure 2. Surface plots of the growth rates predicted by RS model as a function temperature and NaCl% for (a); and surface plots of the
Figure 3. Surface plots of the lag phase duration predicted by RS model as a function temperature and NaCl% for (a); and surface plots
of the lag phase duration predicted by AD model as a function temperature and NaCl% for (b). The symbols represent the observed data.
Table 1. Evaluation of specific models predicting Vibrio harveyi in different combinations according to various mathematical/statistical
characteristics
Temperature (oC), NaCl (%) Models
Gompertz Baranyi
27.1 oC, 2%
r2 0.9937 0.9964
MSE 0.0446 0.0260
Bias 0.9983 0.9884
Accuracy 1.0663 1.0278
25 oC, 1%
r2 0.9899 0.9924
MSE 0.1780 0.0613
Bias 0.9405 0.9856
Accuracy 1.0711 1.0517
25 oC, 3%
r2 0.9965 0.9952
MSE 0.0247 0.0524
Bias 0.9984 0.9901
Accuracy 1.0358 1.1698
20 oC, 0.6%
r2 0.9985 0.9954
MSE 0.0112 0.0637
Bias 0.9994 0.9818
Accuracy 1.0264 1.0429
20 oC, 2%
r2 0.9982 0.9987
MSE 0.0252 0.0372
Bias 0.9955 0.9961
Accuracy 1.0672 1.1198
20 oC, 3.4%
r2 0.9991 0.9964
MSE 0.0043 0.0424
Table 1. Continued
Accuracy 1.0163 1.0391
15 oC, 1%
r2 0.9969 0.9981
MSE 0.0321 0.0416
Bias 0.9971 0.9784
Accuracy 1.0744 1.0411
15 oC, 3%
r2 0.9971 0.9982
MSE 0.0358 0.0295
Bias 0.9987 0.9890
Accuracy 1.0604 1.0391
12.9 oC, 2%
r2 0.9800 0.9980
MSE 0.0644 0.0633
Bias 0.9994 0.9959
Accuracy 1.0252 1.0281
Combined effect of temperature and Aw on growth rate
The coefficient of the models developed describing the
combined effect of temperature and Aw on the μmax and their
statistical validation are shown in Table 2, whereas the 3D surface
of the models developed for both observation and prediction are
given in Fig. 2. The secondary model predicted that the optimum
condition was 28 oC, 0%, and the μmax were1.9826 and 1.6839 for
RS model and the AD model, respectively. The lowest μmax was
estimated in 12 oC. It can be observed that the μmax increased with
increase of temperature for RS model (Fig. 2). When the NaCl% is
lower than 1%, the μmax also increased with the temperature
increase for the AD model, However, when the NaCl% higher
than 1% and the temperature lower than 15 oC, the μmax decreased
when the temperature increase for AD model. This may indicate
that distinctive reaction to the varied environments of the
salt-tolerance and thermophilus bacteria like V. harveyi or other Vibrio
spp. Based on Fig. 2, it clearly can be seen from the curvature of
the secondary model that synergistic and antagonistic interaction
occurs between the temperature and Aw on the μmax.
In the secondary model, the r2 are 0.9616 and 0.9413 for
Baranyi model by using RS and AD model, which is 0.8703 and
0.8956 for Gompertz model. The values of MSE, bias factor, and
accuracy factor were all in the acceptable range. The bias factor
from Baranyi model was 1.0121 to 1.0000, and the accuracy factor
was 1.1770 to 1.1991 (Table 2). The F-test indicated there is
difference between the bias and accuracy factor from Baranyi and
Gompertz model, and Baranyi model shown better fitness with
better r2 and MSE value.
The validation between observed μmax and independent data
from ComBase by Baranyi nad Gompertz model with both RS and
AD model is presented in Table 3. The growth rate data from
ComBase were selected according to the conditions in this study,
The MSE is less than 0.02 shown that the models are
goodness-of-fit, and the accuracy factor indicated that both the developed
models predicted the growth with approximately the same.
However, the bias factor of RS model is much higher than AD
model, which indicated that the AD model is better. Moreover, the
bias and accuracy factor obtained from Gompertz model is higher
than1.8, which is unacceptable, whereas which from Baranyi
model is lower and acceptable.
Table 2. Coefficients of growth rate models, describing the combined effects of temperature and NaCl% on V. harveyi.
Gompertz-RS Baranyi-RS Gompertz-AD Baranyi-AD
C0 0.0453 -0.6522 0.8369 5.0662
C1 -0.0041 0.0269 -22.1187 -120.1110
C2 -0.0489 0.2468 -0.0758 -0.6390
C3 -0.0002 -0.0250 0.0587 7.8723
C4 0.0004 0.0024 161.4295 711.4668
C5 0.0130 0.0472 0.0180 0.0417
Table 3. Validation indices for the performance of the models on independently derived data from Combase.
RS AD
Gompertz MSE 0.0201 0.0191
Bias 1.9367 1.8883
Accuracy 1.9985 1.9590
Baranyi MSE 0.0152 0.0162
Bias 0.8919 0.9473
Accuracy 1.5636 1.5980
Combined effect of temperature and Aw on lag phase
The coefficient of the models developed describing the combined effect of temperature and Aw on the LPD and their statistical evaluation are shown in Table 4, the 3D surface of the models developed for both observation and prediction are given in Fig. 3. Both the secondary models presented satisfactory fitting to the experimental data which obtained
from Baranyi model. RS and AD model described the combined effect of temperature and Aw on the LPD correctly. The LPD increased when the temperature decreased, and the LPD last less than 2 hours in 28 oC, whereas more than 30 hours in 12 oC (Fig. 3). The LPD affected less by Aw. For RS model and AD model, the duration hour alters less than 3 hours for different Aw in a same temperature. This temperature and Aw interaction occurred also in some kind of fungi, Apergillus
carbonarius, Asperigillus flavus and Asperigillus parasiticus
(16, 18).
The MSE value of secondary model is less than 0.05 for Baranyi model. Furthermore, the bias factors are close to 1, which is in an acceptable range as previously described. Compare the RS model to AD model, the AD model is better than RS mode with a better statistical assessment (Table 4).
Table 4. Coefficient and mathematical/statistical indices used to validate the lag phase duration models, describing the combined effects of temperature and NaCl% on V. harveyi.
Function r2 MSE bias accuracy
Response surface LP=83.424-5.518×T-0.189×NaCl
-0.003×T×NaCl+0.093×T2+0.070×NaCl2
0.9971 0.0420 0.9543 1.1249
Arrhenius-Davey LP=-21.417+623.428/T-0.549×NaCl +0.997/T×NaCl+264.433/T2+0.133×NaCl2
0.9990 0.0146 0.9768 1.1768
DISCUSSION
The aim of study is to predict and control the sea food safety
by modeling the V. harveyi. The effect of temperature and Aw was
fitted by Gompertz and Baranyi models preliminary. The
temperature and Aw effect the μmax significantly, and in a same
temperature, the maximum growth rate occurred when the Aw was
approximately 0.99, which was consistent with previous report
(12).
The entire bias factor of primary models was between 0.94
and 1 in Table 1 which indicated that the predictive growth rate is,
on average, lower than the observed growth rate. Ross (15)
proposed the following interpretation of bias factor when used for
model performance evaluations involving pathogens: 0.90-1.05
can be consider good; 0.70-0.90 or 1.06-1.15 can be considered
acceptable; <0.70 or >1.15 should be considered unacceptable.
According to this standard, results of bias factor of Banrayi
models in this study were within good range (5). Additionally,
there are also other reported standards of bias factor, Dalgaard (4)
suggested 0.8-1.3 in seafood spoilage model. The accuracy factor
provides indication of the average accuracy of estimate. In the
primary model establishment, all the accuracy were slightly higher
than 1, and were 1.0277-1.1698 in combined condition, which
were in an acceptable ranges. By model evaluation and statistical
validation, the parameters derived from Baranyi model performed
better than Gompertz model, which was consistent with previously
study (22, 23).
The combined temperature and Aw effect on the growth of V.
harveyi were conducted by both the RS and AD models. The RS is
a classical modelling approach in predictive microbiology area and
shown a good performance in growth rate fitting, however with
the index of MSE in fitting the LPD, AD model exhibited more
reliable. By comparing the r2, MSE, bias and accuracy factor of
secondary model, it also indicated that AD model is better. By
analysis the LPD models, which was almost constant at a same
temperature with different Aw, and was highly sensitive to the
variation of temperature with a same Aw, especially in the AD
model. This result indicated that the LPD is mostly relying on
temperature, and these trends were also found in published
researches (16, 18).
Validation of the developed models with independent data
from ComBase shown good interrelationship between observed
and predicted growth rate (Table 3). Although the predictive
model and published data of V. harveyi is scanty, we compare the
data with very similar species of Vibrio spp. The indices shown a
good performance of the developed models, the MSE is around
0.020 for Gompertz model and 0.015 for Baranyi model.
However, the bias and accuracy factor are not in the acceptable
range for the parameters from Gompertz model. We also
compared the validation data with the model data in Figure 4,
shown Gompertz model always predicted the rate always higher,
whereas Baranyi model distribute more central.
0 0.1 0.2 0.3 0.4 0.5
0 0.1 0.2 0.3 0.4 0.5 Observed
Predi
cte
d
Gompertz
0 0.5 1 1.5
0 0.5 1 1
Observed
Pre
dic
ted
.5 Baranyi
In summary, the experiments compared Gompertz with Baranyi models and response surface with Arrhenius-Davey models, established predictive model to reveal the growth characteristics of V. harveyi in combined conditions of temperature and Aw. In this study, Baranyi model and Arrhenius-Davey model showed goodness-of-fit to describe the growth of V. harveyi under different laboratory conditions.
Furthermore, the data of μmax and LPD could be integrated
into a QMRA (quantitative microbial risk assessment) and further for a HACCP (hazard analysis critical control point) software, in monitor the safety of food (10). As there is correlation between broth data and real condtition, the established model could be used to calculate the likely number of organisms before the fishes were captured, and predict the potential hazard of infection, and help to control the disease spread in the batch. Furthermore, if the models predict that growth of a particular micro-organism cannot occur, this information can be used to determine the risk of financial loss and also control the organism from the list of potentially hazardous for the HACCP.
ACKNOWLEDGEMENTS
The authors gracefully acknowledge the financial support given by Beijing Municipal Science & Technology Commission (Z 07090500550719) and the Beijing Innovation Team of China Agriculture Research Center System (SCGWZJ 20121105-2).
REFERENCES
1. Baranyi, J.; Roberts, T.A.; McMclure, P.J. (1993). A non-autonomous differential equation to model bacterial growth. Food Microbiol. 10, 43-59.
2. Baranyi, J.; Robert, T.A. (1994). A dynamic approach to prediction bacterial growth in food. Int. J. Food Microbiol. 23, 277-294.
3. Chrisolite, B.; Thiyagarajan, S.; Alavandi, S.V.; Abhilash, E.C.; Kalaimani, N.; Santiago, T.C. (2008). Distribution of luminescent Vibiro harveyi and their bacteriophages in a commercial shrimp hatchery in
South India. Aquaculture. 275, 13-19.
4. Dalgaard, P. (2002). Modelling and prediction the shelf-life of seafood. In: Bremner, H.A. (Eds.) Safety and quality issues in fish processing. pp. 191-219. Woodhead Publishing Ltd.
5. Dong, Q.; Tu, K.; Guo, L.; Li, H.; Zhao, Y. (2007). Response surface model for prediction of growth parameters from spores of Clostridium sporogenes under different experimental conditions. Food Microbiol. 24, 624-632.
6. Giffel, M.C.; Zwietering, M.H. (1999). Validation of predictive models describing the growth of Listeria monocytogenes. Int. J. Food Microbiol. 46, 135-149.
7. Isabelle, L.; Andre, L. (2006). Quantitative prediction of microbial behaviour during food processing using an integrated modeling approach: a review. Int. J. Refrigeration. 29, 968-984.
8. McDonald, K.; Sun, D.W. (1999). Predictive food microbiology for the meat industry: a review. Int. J. Food Microbiol. 52, 1-27.
9. McMeekin, T.A.; Ross T. (2002). Predictive microbiology: providing a knowledge-based framework for change management. Int. J. Food Microbiol. 78, 133-153.
10. McMeekin, T.A.; Baranyi, J.; Bowman, J.; Dalgaard, P.; Kirk, M.; Ross, T.; Schmid, S.; Zwiertering, M.H. (2006). Information systems in food safety management. Int. J. Food Microbiol. 112, 181-194.
11. McMeekin, T.A., Bowman, J., McQuestin, O., Mellefont, L., Ross, T., Tamplin, M. (2008). The future of predictive microbiology : Strategic research, innovative applications and great expectations. Int. J. Food Microbiol. 128, 2-9.
12. Miles, D.W.; Ross, T.; Olley, J.; McMeekin, T.A. (1997). Development and evaluation of a predictive model for the effect of temperature and water activity on the growth rate of Vibrio parahaemolyticus. Int. J. Food Microbiol. 38, 133-142.
13. Pasharawipas, T.; Thaikua, S.; Sriurairatana, S.; Ruangpan, L.; Direkbusarakum, S.; Manopvisetcharean, J.; Flegel, T.W. (2005). Partial characterization of a novel bacteriophage of Vibrio harveyi isolated from shrimp culture ponds in Thailand. Virus Res. 114, 63-69.
14. Ross, T. (1996). Indices for performance evaluation of predictive models in food microbiology. J. Appl. Bacteriol. 81, 501–508.
15. Ross, T. (1999). Predictive food microbiology models in the meat industry (MSRC003). Meat and Livestock Australia, Sydney.
16. Samapundo, S.; Devlieghere, F.; Geeraerd.; De Meulenaer, B.; Van Impe, J.F.; Debever, J.M. (2007). Modelling of the individual and combined effects of water activity and temperature on the radial growth of Aspergillus flavus and A. parasiticus on corn. Food Microbiol. 24, 517-529.
18. Tassou, C.C.; Panagou, E.Z.; Natskoulis, P.; Magan, N. (2007). Modelling the effect of temperature and water activity on the growth of two ochratoxigenic strains of Aspergillus carbonarius from Greek wine grapes. J. Appl. Microbiol. 103, 2267-2276.
19. Yao, C.-Y.; Kong, P.; Wang, Z.-Y.; Ji, P- C.-Y.; Kong P.-F., Cai, M.-Y.; Liu, X.-D.; Han, X.-Z.; (2008). Cloning and expression analysis of two alternative splicing toll-like receptor 9 isoforms A and B in large yellow croaker, Pseudosciaena crocea. Fish Shellfish Immun. 25, 648-656. 20. Zhang, X.-H.; Austin, B. (2000). Pathogenicity of Vibrio harveyi to
salmonids. J. Fish Dis. 23, 93-102.
21. Zhang, C. ; Yu, L. ; Qian, R. (2007). Characterization of OmpK, GAPDH and their fusion OmpK-GAPDH derived from Vibrio harveyi
outer membrane proteins: their immunoprotective ability against vibriosis in large yellow croaker (Pseudosciaena crocea). J. Appl. Microbiol. 103, 1587-1599.
22. Zhou, K., Cui, T;-T.; Li, P.-L.; Liang, N.-J.; Liu, S.-C.; Ma, C.-W.; Peng, Z.-H. (2008). Modelling and predicting the effect of temperature , water activity and pH on growth of Streptococcus iniae in Tilapia. J. Appl. Microbiol. 105, 1956-1965.
23. Zhou, K.; Fu, P.; Li, P.-L.; Cheng, W.-P.; Liang, Z.-H. (2009). Predictive modeling and validation of growth at different temperatures of Brochothrix Thermosphacta. J. Food Safety. 29, 460-473.
24. Zurera-Cosano, R.M.; Garcia-Gimeno, G.; Rodriguez-Perez, R.; Hervas -Martinez, C. (2006). Performance of response surface model for prediction of Leuconostoc mesenteroides growth parameters under different experimental conditions. Food Control. 17, 429–438.
25. Zwietering, M.H.; De Koos, J.T.; Hasenack, B.E.; De Wit, J.C.; Van Riet, K. (1991). Modelling of bacterial growth as a function of temperature. Appl. Environ. Microbiol. 57, 1094-1101.