2017
UNIVERSIDADE DE LISBOA
FACULDADE DE CIÊNCIAS
DEPARTAMENTO DE BIOLOGIA VEGETAL
Unravelling the Causes of Inner Ear Disease
Marisa Flook Pereira
Mestrado em Biologia Molecular e Genética
Dissertação orientada por:
Professora Doutora Maria Helena de Figueiredo Ramos Caria
Doutor Jose Antonio Lopez Escamez,
Os resultados obtidos neste trabalho, juntamente com outros já obtidos no grupo permitiu
a submissão de um artigo científico na revista Frontiers in Aging Neuroscience
denominado “Biomarkers of presbycusis and tinnitus in a Portuguese older population” e
uma apresentação de painel no 5th International Multidisciplinary Vestibular Disorder
Course & Workshop (Granada, Espanha) denominada “Pro-inflamatory cytokines in
Vestibular Migraine and Meniere’s Disease”
Agradecimentos
Em primeiro lugar, gostaria de agradecer a ambos os meus orientadores - a Professora Doutora Helena Caria e ao Doutor Antonio Lopez Escamez, por toda por toda a orientação, disponibilidade e atenção. Professora Helena, obrigada acima de tudo por me oferecer sempre todas as oportunidades para que eu me pudesse tornar uma melhor cientista, não apenas durante este ano, mas desde que me juntei ao grupo ainda como aluna de licenciatura. Os meus agradecimentos estendem-se também à Professora Doutora Graça Fialho e ao Doutor Tiago Matos por me terem acolhido no seio do grupo, ajudarem e guiarem. Doutor Antonio, queria agradecer-lhe especialmente por tornar uma das suas preocupações não apenas o meu bem-estar no grupo, mas também a minha adaptação a Granada.
À Bárbara por teres sido a melhor companheira de laboratório e tornares os dias sempre mais divertidos, um bolo xadrez sem ti nunca será a mesma coisa!
Lidia, obrigada por me ensinares tudo e teres tido sempre paciência para as minhas perguntas desde o primeiro dia até às últimas palavras escritas nesta tese, sem a tua ajuda e confiança em mim muito disto não teria sido possível.
Ao restante pessoal do laboratório em Granada, Tere, Alvaro, Pablo, Ivan e Margarita, obrigada pela companhia diária, por me irem ajudando de uma forma ou de outra tanto fora como dentro do laboratório e especialmente por me salvarem de ter de fazer telefonemas em espanhol!
Rita, Mónica, Marta, Cátia e Daniel, apesar de neste momento estarmos um bocado espalhados por Portugal e arredores, arranjam sempre uma maneira de não me parecerem tão distantes, foram, são e serão sempre dos melhores amigos que se pode ter, obrigada!
Tiffa, Rita, Cátia e Nessa, obrigada por me ouvirem, por me aconselharem, por me fazerem rir, por sofrerem comigo, pelas saídas, pelas visitas, por tudo! Será sempre um prazer partilhar convosco o caminho que iniciamos juntas na ciência e que se transformou em belas amizades.
Babs, Miguel, Carina e Ed, obrigada pelas pausas, jantares, conselhos, desabafos, parvoíces, me deixarem ralhar livremente e por tornarem o mestrado em muito mais que um grau académico!
E finalmente, à minha mãe, irmã, Nanny e Camila, obrigada por estarem ao meu lado desde o inicio até ao fim. Mãe trouxeste-me até aqui, sei bem que não tem sido sempre fácil, mas obrigada do fundo do coração, por me deixares seguir sempre o meu caminho e apoiares as minhas escolhas. Ana, o que é que as pessoas fazem sem irmãos? Obrigada, por seres a melhor mana mais velha e ires sempre tomando conta de mim, mesmo quando estou longe! Camila, obrigada por me fazeres parar e não me deixares esquecer da importância de brincar, fica uma criança para sempre!
Table of Contents
Figures... I
Tables... II
Abbreviations... III
Resumo... VI
Abstract... VIII
1. Introduction... 1
1.1. The Inner Ear ... 1
1.1.1. Inner Ear Disease ... 2
1.2. Auditory Disorders ... 2
1.2.1. Age-related Hearing Loss ... 2
1.3. Vestibular disorders ... 4
1.3.1. Meniere’s Disease ... 5
1.3.2. Vestibular migraine ... 6
2. Objectives
... 6
3. Materials and Methods
... 7
3.1. Patient Cohorts ... 7
3.1.1. ARHL Cohort ... 7
3.1.2. VM & MD Cohort ... 7
3.2. gDNA Extraction ... 7
3.3. HSV1 and NAT2 PCR ... 7
3.4. Sequencing and Sequence Analysis ... 8
3.5. Genotyping with Real-time PCR ... 8
3.6. PBMC Isolation and Stimulation ... 9
3.7. RNA Extraction ... 9
3.8. Quantitative PCR ... 9
3.9. Extracellular Cytokine Level Determination ... 10
3.10. Expression Array ... 10 3.11. Statistical Analysis ... 10 4. Results
... 11
4.1. Demographic Results ... 11 4.1.1. ARHL Cohort ... 11 4.1.2. VM & MD cohort ... 12 4.2. GRM7 gene ... 14 4.3. NAT2 gene ... 15 4.4. mtDNA ... 164.5. qPCR ... 17
4.6. Extracellular Cytokine Levels ... 18
4.7. Gene Expression ... 20
5. Discussion
... 22
6. Conclusion and Further Directions
... 29
7. References
... 30
8. Annexes
... 35
A. WHO standardized hearing loss classification ... 35
B. Diagnostic criteria for VM ... 35
C. PCR protocols ... 35
D. Demographic Results ... 36
E. NAT2 haplotype ... 37
i
Figures
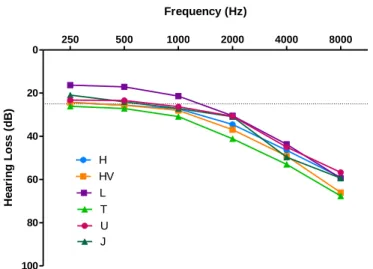
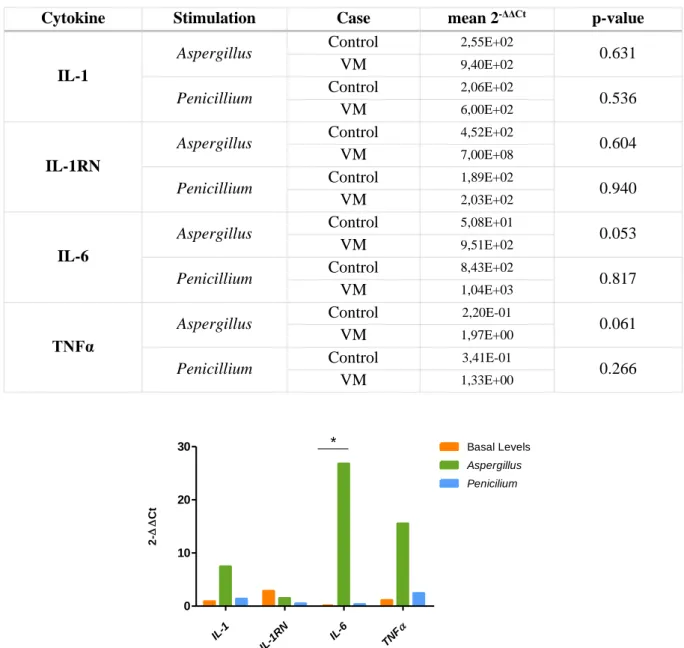
Figure 1.1 - Diagram of the inner ear. Adapted from Lang et al (3). ... 1 Figure 4.1 - Effect of sex on HL (dB) for each tested frequency (Hz) ... 12 Figure 4.2 – Effect of GRM7 SNP rs11928865 genotype on HL (dB) for each tested frequency (Hz).14 Figure 4.3 - Effect of NAT2 haplotypes on HL (dB) for each tested frequency (Hz). ... 15 Figure 4.4- Hearing loss of the most common haplogroups by tested frequencies. ... 16 Figure 4.5 - Fold-change values for cytokine expression levels between patients with VM and controls. * - p-value=0.048. ... 17 Figure 4.6- Cytokine levels in VM patients and controls. A- basal levels; B- stimulated with
Aspergillus; C- stimulated with Penicillium ... 18 Figure 4.7 - Cytokine levels in VM patients and MD patients. A - basal levels (MD with low cytokine levels); B - stimulated with Aspergillus (MD with low cytokine levels); C - stimulated with
ii
Tables
Table 3.1- mtDNA primers and respective size of the amplicon. ... 8
Table 3.2 – Primers used to amplify NAT2 gene and respective amplicon size ... 8
Table 3.3 – Primers used to amplify cDNA of each cytokine and respective amplicon size. ... 9
Table 4.1 - ARHL cohort descriptive analysis of demographics and clinical history. ... 11
Table 4.2 - Effect of demographic and clinical features on HL per frequency (Hz) ... 12
Table 4.3 - Multivariate logistic regression controlled by age. ... 12
Table 4.4 - VM patients' descriptive analysis for demographics and clinical history. ... 13
Table 4.5 - MD patients' descriptive analysis for demographics and clinical history. ... 13
Table 4.6 - Comparison of VM patients’ demographics and clinical history to MD patients and MD type 4 patients. ... 14
Table 4.7- Distribution of individuals according to GRM7 rs11928865 and its associated mean HL Standard deviation (SD). ... 14
Table 4.8 - Logistic model applied to HL controlled by age, considering GRM7 SNP rs11928865 A/A genotype as reference ... 14
Table 4.9 - Logistic model applied to HL controlled by age, considering the haplotype NAT2*6A/NAT2*6A as reference ... 15
Table 4.10 - Distribution of individuals according to NAT2 phenotype and associated mean HLSD. ... 16
Table 4.11 –Fold-change values for cytokine expression levels between stimulated and non-stimulated PBMC of controls and VM patients. ... 17
Table 4.12 - Canonical pathways state in non-stimulated MD patients with -level of cytokines compared to VM patients. ... 20
Table 4.13 - Canonical pathways involved in VM exclusive to stimulation with Aspergillus or Penicillium. ... 20
Table 4.14 - State of upstream regulators in MD comparing to VM, exclusive to each stimulation (p-value< 10-5). ... 21
Table 4.15 - State of upstream regulators in MD comparing to VM, common to both stimulations (p-value<10-5). ... 21
Table 8.1 – WHO standardized hearing loss classification ... 35
Table 8.2 - mtDNA PCR protocol. ... 35
Table 8.3 - NAT2 PCR protocol ... 35
Table 8.4 - GRM7 real-time PCR protocol ... 36
Table 8.5 - qPCR protocol ... 36
Table 8.6 – Influence of demographics and clinical history on HL based on the WHO classification. 36 Table 8.7 - Distribution of individuals according to NAT2 haplotype and associated mean HLSD .. 37
Table 8.8 - Distribution of individuals according to mtDNA haplogroup and associated mean HLSD. ... 38
iii
Abbreviations
μL Microliter
μg Microgram
ºC Celsius Degrees
AAO-HNS American Academy of Otolaryngology - Head and Neck Surgery
AMP Adenosine Monophosphate
ARHL Age-Related Hearing Loss
ATP Adenosine Triphosphate
ATP1A2 ATPase Na+/K+ Transporting Subunit Alpha 2
bp Base Pairs
dB Decibel
CACNA1A Calcium Voltage-Gated Channel Subunit Alpha1 A
cAMP Cyclic Adenosine Monophosphate
CANVAS Cerebellar Ataxia, Neuropathy, Vestibular Areflexia Syndrome
CCR7 C-C Motif Chemokine Receptor 7
CD Cluster of Differentiation
CD40LG Cluster of Differentiation 40 Ligand
CI Confidence Interval
cDNA Complementary Deoxyribonucleic Acid
CNV Central Nervous System
CO2 Carbon Dioxide
DC Dendritic Cell
DNA Deoxyribonucleic Acid
DRB1 DR-1 Beta Chain
dsDNase Double Strand Specific DNase
E2F1 E2F Transcription Factor 1
ER Endoplasmic Reticulum
ES Endolymphatic Sac
FHM Familial Hemiplegic Migraine
FMD Familial Meniere’s Disease
GAPDH Glyceraldehyde 3-phosphate Dehydrogenase
gDNA Genomic Deoxyribonucleic Acid
GFI1 Growth Factor Independent Factor 1
GRM7 Glutamate Metabotrophic Receptor 7
HGF Hepatic Growth Factor
HIF1A Hypoxia-inducible Factor 1α
HL Hearing Loss
HRH1 Histamine Receptor H1
HRH3 Histamine Receptor H3
HVS1 Hypervariable Segment 1
iv
I Intermediate
iCOS Inducible T-cell Co-stimulator
iCOSL Inducible T-cell Co-stimulator Ligand
IFN Interferon
IFNA2 Interferon type 2
IFNG Interferon γ
IgE Immunoglobulin E
IKKe IkB kinase ε
IL Interleukin
IL-1β Interleukin 1 β
IL-1RN Interleukin 1 Receptor Antagonist (gene)
IL-1RA Interleukin 1 Receptor Antagonist (protein)
IL-6 Interleukin 6
IRF3 Interferon Regulatory Factor 3
K+ Potassium Ion
kDa Kilodalton
LYP Lymphoid Protein Tyrosine Phosphatase
MAPK Mitogen-Activated Protein Kinase 1
MD Meniere’s Disease
MHC Major Histocompatibility Complex
mL Millilitre
mM Millimolar
mRNA Messenger Ribonucleic Acid
mtDNA Mitochondrial Deoxyribonucleic Acid
mTOR Mechanistic Target Of Rapamycin
mTORC2 Mechanistic Target Of Rapamycin Complex 2
MYC MYC Proto-Oncogene, BHLH Transcription Factor
MyD88 Myeloid Differentiation Primary Response 88
Na+ Sodium Ion
NAT2 N-acetyltransferase 2
NFkB Nuclear Factor-κB
NMDA N-methyl-D-aspartate
NSHL Non-syndromic Hearing Loss
OR Odds Ratio
PAMP Ppathogen-associated Molecular Patterns
PBMC Peripheral Blood Mononuclear Cells
PBS Phosphate Buffered Saline
PCR Polymerase Chain Reaction
pg Picogram
PI3K Phosphoinositide 3-kinases
v
PRL Prolactin
PRR Pattern Recognition Receptors
PTGER4 Prostaglandin E receptor subtypes EP4
qPCR Quantitative Polymerase Chain Reaction
R Rapid
RICTOR RPTOR Independent Companion Of MTOR Complex 2
RIP1 Receptor Interacting Serine/Threonine 1
RNA Ribonucleic Acid
rpm Rotations per minute
ROS Reactive Oxygen Species
rRNA Ribosomal Ribonucleic Acid
S Slow
SCN1A Sodium Voltage-Gated Channel Alpha Subunit 1
SD Standard Deviation
SE Standard Error
SNHL Sensorineural Hearing Loss
SNP Single Nucleotide Polymorphism
STAT1 Signal Transducer And Activator Of Transcription 1
TAK1 Transforming Growth Factor Beta-activated Kinase 1
TBE Tris-Borate- Ethylenediaminetetraacetic Acid
TBK1 TANK Binding Kinase 1
TCR T-cell Receptor
Th T Helper Cell
TLR Toll-like Receptor
TNFα Tumour Necrosis Factor α
TRAM Translocation Associated Membrane Protein
TREG T Regulatory Cell
TRIF TIR Domain-containing Adaptor Protein Inducing Interferon Beta
TRIM24 Tripartite Motif Containing 24
tRNA Transfer Ribonucleic Acid
U Enzyme Units
UPR Unfolded Protein Response
VD Vestibular Disorders
VEGF Vascular Endothelial Growth Factor
VM Vestibular Migraine
WHO World Health Organization
vi
Resumo
Introdução: O ouvido interno é o órgão sensorial responsável pela manutenção do equilíbrio e pela
capacidade auditiva. A surdez é a deficiência neuro-sensorial mais comum no Ser Humano, podendo ter uma origem genética e/ou ambiental. A presbiacusia, ou surdez associada à idade, é um tipo de surdez neuro-sensorial progressivo e bilateral, que resulta do efeito cumulativo de fatores intrínsecos e extrínsecos, levando à degeneração da cóclea e das vias centrais auditivas. Estudos prévios indicam uma predisposição genética para o desenvolvimento de presbiacusia. A surdez neuro-sensorial pode ocorrer associada a outros sintomas e ser intermitente em algumas manifestações como na doença de Meniere. A doença de Meniere é uma doença multifatorial, caraterizada por ataques de vertigens espontâneos, associado a surdez neuro-sensorial unilateral intermitente, acufenos e uma sensação de preenchimento do ouvido (“aura”). Os pacientes com doença de Meniere podem também desenvolver surdez neuro-sensorial bilateral, enxaquecas e doenças autoimunes sistémicas. Apesar da doença de Meniere ser considerada multifatorial, existem três hipóteses mais aceites para a sua etiologia - genética, autoimune ou alérgica – existindo evidências científicas para todas elas. A prevalência de alergias diagnosticadas em pacientes de doença de Meniere é três vezes superior à população geral. Nas doenças do ouvido há também a considerar as doenças vestibulares, que levam à perda transiente ou permanente da função vestibular. A Enxaqueca Vestibular é caraterizada pela ocorrência de episódios de sintomas vestibulares e uma história de enxaqueca, com uma associação temporal em pelo menos 50% dos ataques. A Enxaqueca Vestibular é mais comum em pacientes com doença de Meniere do que na população geral, podendo por vezes serem indistinguíveis baseado apenas em historial médico e sintomas, podendo também apresentar-se como uma comorbidade. Porém, a relação patofisiológica entre Enxaqueca Vestibular e doença de Meniere é desconhecida.
Objetivos: Caracterização genética de pacientes de presbiacusia a nível dos genes GRM7 e NAT2 e
haplogrupos de mtDNA; comparação da resposta imune induzida por fungos entre pacientes de doença de Meniere e Enxaqueca Vestibular.
Materiais e Métodos: Estudo e análise das caraterísticas demográficas e clinicas dos indivíduos da
amostra de presbiacusia (n=483, oriunda da população portuguesa), doença de Meniere (n=115, oriundas da população espanhola) e Enxaqueca Vestibular (n=73, oriundas da população espanhola); sequenciação da região HVS1 do DNA mitocondrial e determinação de haplogrupos utilizando o mtDNA Haplogroup Analysis software; genotipagem por real-time PCR dos genes GRM7 (rs11928865) e NAT2 (rs1799930, rs1799931, rs1801280, rs1208, rs1041983, rs1799929 e rs1801279). Determinação do fenótipo de acetilação do gene NAT2 utilizando NAT2PRED software. Determinação do nível de expressão de citocinas (IL-1β, IL-1RN, IL-6 e TNFα) em amostras de indivíduos com Enxaqueca Vestibular por PCR quantitativo e quantificação do nível de liberação extracelular das mesmas utilizando um Multiplex Bead-Based Kit; determinação da expressão génica por microarray de Enxaqueca Vestibular e Doença de Meniere; determinação das vias canónicas, identificação de reguladores e predição do estado (ativo/inibido) utilizando IPA® software.
Resultados e Discussão: Os nossos resultados demonstram que na amostra de pacientes com
presbiacusia há diferenças significativas entre a idade e o nível de perda auditiva, os homens têm uma melhor audição nas baixas frequências e as mulheres nas altas frequências evidenciando um efeito de inversão. Distintas comorbidades foram associadas a presbiacusia, nomeadamente: níveis de colesterol elevado, hipertensão, doença cardiovascular e hábitos tabágicos. O genótipo T/T do SNP rs11928865 do gene GRM7 confere uma maior perda auditiva a 8000 Hz. O haplótipo NAT2*4/NAT2*6A está associado a uma maior perda auditiva a 250 Hz. O fenótipo de acetilação lenta, no gene NAT2, tem uma maior perda auditiva, porém não existem diferenças significativas entre este fenótipo e os restantes. A origem dos haplogrupos mais detetados na nossa amostra é europeia, sendo o haplogrupo mais comum
vii
o haplogrupo H, porém também foram identificados haplogrupos asiáticos e um haplogrupo africano. Apesar de não terem sido encontradas diferenças significativas, o haplogrupo com maior perda auditiva é o haplogrupo X. Os resultados de qPCR revelam que os pacientes com Enxaqueca Vestibular comparativamente a controlos saudáveis, quando estimulados com Aspergillus têm uma maior expressão de IL-1, TNFα e IL-6, porém apenas a diferença em IL-6 é estatisticamente significativa. No entanto, não se vê uma diferença na expressão de citocinas após estimulação com Penicillium. Os níveis basais de IL-1RA são mais elevados em Enxaqueca Vestibular do que nos controlos. Os níveis de IL-6 e TNFα são mais elevados em Enxaqueca Vestibular do que em controlos após estimulação com
Aspergillus e Penicillium. Não existem diferenças significativas entre os níveis basais de Enxaqueca
Vestibular e doença de Meniere com baixos níveis de IL-1β, porém existem diferenças significativas entre os níveis de IL-1RA de Enxaqueca Vestibular e doença de Meniere com baixos níveis de TNFα e entre os níveis de 1β, 1RA, 6 e TNFα de EV e doença de Meniere com elevados níveis de IL-1β e TNFα. Após estimulação, verifica-se uma diferença nos níveis de IL-1RA e IL-6 entre Enxaqueca Vestibular e doença de Meniere com baixos níveis de IL-1β e TNFα e uma diferença entre os níveis de IL-1RA entre Enxaqueca Vestibular e doença de Meniere com elevados níveis de IL-1β e TNFα. Não existem diferenças significativas entre os perfis de expressão génica entre pacientes de Enxaqueca Vestibular e controlos saudáveis e entre pacientes de Enxaqueca Vestibular e pacientes de doença de Meniere com baixos níveis de citocinas. Porém, existem diferenças entre pacientes com Enxaqueca Vestibular e pacientes com Doença de Meniere com elevados níveis de citocinas, que revelam o envolvimento da maturação de linfócitos B, produção de citocinas e a maturação de células dendríticas. A comparação da resposta a Aspergillus e Penicillium entre pacientes com Enxaqueca Vestibular e controlos saudáveis revelou diferenças no envolvimento da produção de citocinas, inflamação e da sinalização para a morte celular programada. A comparação da resposta a estimulação com Aspergillus e Penicillium entre pacientes com Enxaqueca Vestibular e Doença de Meniere revelou o envolvimento de reguladores que atuam na diferenciação, ativação e regulação de linfócitos T, no desenvolvimento de linfócitos B, na maturação de células dendríticas e na alergia.
Conclusão: As doenças do ouvido interno podem ter várias causas e comorbidades associadas. Na nossa
amostra de presbiacusia, os haplogrupos de mtDNA não mostram qualquer efeito na perda auditiva. Não se pode excluir o efeito genético de GRM7, NAT2 e haplogrupos do mtDNA na presbiacusia, no entanto na nossa amostra os fatores ambientais poderão ter um maior efeito para o desenvolvimento de presbiacusia do que os fatores genéticos analisados, ainda que seja de considerar o possível efeito de outros fatores genéticos nomeadamente os associados às alterações do colesterol. Os pacientes de Enxaqueca Vestibular podem ser distinguidos de controlos saudáveis e de pacientes de Doença de Meniere a partir dos níveis basais de IL-1RA. Os resultados do microarray suportam os resultados obtidos através na quantificação dos níveis extracelulares de IL-1β, IL-1RA, IL-6 e TNFα e sugerem uma resposta alérgica nos pacientes de Enxaqueca Vestibular.
viii
Abstract
Introduction: The inner ear is a sensory organ responsible for the maintenance of balance and
equilibrium and hearing. Age-related hearing loss (ARHL) results from the cumulative effect of intrinsic and extrinsic factors that lead to degenerative changes related to ageing of the cochlea and central auditory pathways. Meniere’s Disease (MD) is a multifactorial disorder characterized by vertigo attacks usually associated to unilateral sensorineural hearing loss (SNHL), tinnitus and aural fullness. MD patients have higher prevalence of diagnosed allergy than the general population. Vestibular Migraine (VM) is defined by occurrence of episodic vestibular symptoms and a history of migraine, however it has high symptom overlapping with other vestibular disorders, such as MD.
Objectives: Genetically characterize ARHL patients at GRM7, NAT2 and mtDNA haplogroups and
compare the mold-induced immune response in VM and MD patients.
Materials and Methods: Demographic and clinical characterization of ARHL, VM and MD cohorts.
HVS1 region sequencing and mtDNA haplogroup determination; NAT2 and GRM7 analysis by Real
time PCR; cytokine expression level determination by qPCR and extracellular cytokine quantification with Multiplex Bead-Based Kit and gene expression determining by microarray.
Results: Cholesterol, hypertension, smoking and cardiovascular disease were identified as ARHL
comorbidities. GRM7 genotypes have significant differences for hearing loss (HL) at 8000 Hz. NAT2*4/NAT2*6A is associated to worst listening at 250 Hz. The haplogroups identified in our sample are mostly European. Haplogroup X has highest HL (not statistically significant). Allergenic extracts induce a proinflammatory immune response involving TNF-α and IL-6. Stimulation leads to the involvement of upstream regulators that take part in differentiation, activation and regulation of T-cells, B-cell development, dendritic cell maturation and allergy.
Conclusion: Other variables may prevail over the genetic factor in the Portuguese population of ARHL.
Basal levels of IL1-RA may allow the distinction of VM and MD. The microarray data is supportive of the findings in the extracellular cytokine measurements and suggests an allergic response in VM.
1
1. Introduction
1.1. The Inner Ear
The inner ear is a sensory organ that consists of an osseous labyrinth of spaces in the temporal bone. Within it there is a fluid-filled membranous labyrinth, connected to the osseous labyrinth in various places. The endolymph fills the membranous labyrinth and the perilymph surrounds the perimembranous space. The perimembranous space is directly connected with the subarachnoid space, therefore the perilymph has a similar composition to cerebrospinal fluid, with low [K+] and high [Na+]. Oppositely, the membranous labyrinth is a closed system within the endolymphatic sac filled with endolymph, which has high [K+] and low [Na+] 1,2.
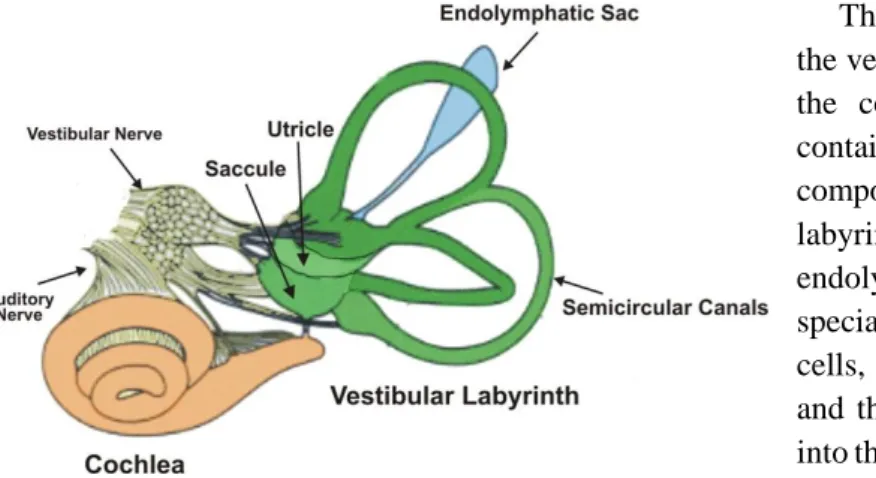
The endolymphatic sac (ES) (figure 1.1) is part of the membranous labyrinth and it is believed to have a role in fluid and ion transport, maintaining the homeostasis of the endolymph and perilymph within the inner ear, however there is no conclusive data 3.
The osseous labyrinth is composed by the vestibule, the semicircular canals and the cochlea (figure 1). The vestibule contains the utricle and the saccule, two components of the membranous labyrinth, which are connected by the endolymphatic duct. The macula is a specialised area of the sensory receptor cells, located at the walls of the utricle and the saccule, from which axons pass into the vestibular nerve as part of sensory inputs to maintain equilibrium. 1.
The semicircular canals contain sensory receptors with axons converging on the vestibular nerve. Alongside with the macula, these receptors help maintain balance and equilibrium 1,2.
The cochlea is a conical helix in the temporal bone, its lumen is continuous with that of the vestibule. The membranous canal of the cochlea arises from the saccule and spirals towards the apex of the osseous space and can be divided into three compartments. The scala media (middle compartment) contains endolymph and the scala vestibuli (upper compartment) and scala tympani (lower compartment) contain perilymph. The sound sensory receptors are located at the Organ of Corti 1,2.
The organ of Corti, which lies in the scala media and rests on the basilar membrane, is a sensory epithelium structure containing receptor cells that allow hearing to happen. The organ of Corti vibrates in response to fluid movements and propagates this mechanical energy to the entire structure. Sound provokes a general wave within the cochlea, however the basilar membrane has different restricted response movements according to the sound frequency, as it is thinner at the base and thicker at the apex. The highest frequencies are sensed towards the base of the cochlea and gradually lower frequencies are sensed along the spiral towards the apex. For each frequency a specific point of the basilar membrane and organ of Corti vibrate and activate the appropriate hair cells to initiate afferent sensory impulses and consequentially send it to the auditory cortex of the brain. This frequency-specific property of the organ of Corti is maintained in the auditory pathway from the hair cell synapse to the auditory cortex and it is known as tonotopia. The inner hair cell synapses mainly transmit information about the acoustic environment, while the outer hair cells are involved in sound amplification. Auditory acuity can be enhanced by modulation of receptor activity through efferent suppressor pathways. This
2
happens due to the integrations of the sensory input from the cochlea in the brain stem and auditory cortex 1,4.
1.1.1. Inner Ear Disease
Inner ear disease classically involves the membranous labyrinth and is characterized by the triad of sensorineural hearing loss (SNHL), tinnitus and vertigo. This may be caused by alterations in the inner ear hair cells, supporting cells or an aberrant inner ear homeostasis, altering the composition of endolymph and perilymph, affecting the integrity and functionality of the hair cells. Also, altered afferent and efferent auditory pathways may accompany or cause inner ear symptoms 5.
1.2. Auditory Disorders
Hearing loss (HL) is the most common neurosensory disorder in humans, affecting 360 million people worldwide 6. In 2011, 120 000 people were estimated to have some degree of hearing loss in the Portuguese population 7. The World Health Organization (WHO) defines as disabling hearing loss when it is higher than 40 dB in the better ear (Annex A) 6.
HL may be genetic, caused by single gene mutation or by a combinations of mutations in various genes, environmental, caused by trauma, medication, medical problems or environmental exposure, also it can be due to an association between genetic and environmental. HL can also be syndromic or non-syndromic. Non-syndromic hearing loss (NSHL) can be inherited by an autosomal dominant mode, usually related to a delayed onset; an autosomal recessive, usually congenital and also mitochondrial and X-linked 8.Syndromic HL is accompanied by additional clinical features, such as anomalies of the eye, kidney, the musculoskeletal and the nervous systems and pigmentary disorders 9.
HL can be present due to various dysfunctions and impairments in the inner ear, such as: impairment of stereociliar function, related to Usher syndrome 10; enlargement of the cochlear aqueduct, present, for example in Pendred syndrome 11; thickening of the stria vascularis, related to Alport syndrome 12; acoustic trauma, causing noise-induced HL. Also HL can be idiopathic, such as sudden deafness or caused by ototoxic medication, such as tuberculostatics, salicylic acid and aminoglycosides, that alters the function of inner ear structures and alter fine tuning of mechanoelectrical transduction 5.
Tinnitus is the perception of a ringing tone within the ear without an external sound trigger. Tinnitus may be caused by alteration in the inner ear or auditory pathway or by vascular and muscular disorders, osseous disease or neoplasia. When the efferent system is affected by inner ear stressors it may cause tinnitus generation and maintenance 5.
1.2.1. Age-related Hearing Loss
Age-related hearing loss (ARHL) or presbycusis is a bilateral, progressive, mainly sensorineural hearing loss that occurs due to degenerative changes related to ageing of the cochlea and central auditory pathways, leading to high-frequency hearing loss and loss of speech discrimination 13–15. ARHL results from the cumulative effect of intrinsic and extrinsic factors, such as loud noise exposure, medical disorders, medications, anatomical degeneration and genetic susceptibility 13,15.
ARHL shows considerable variation in age of onset, progression and severity 14. Currently, it affects over 70% of the world population over 65 years old 16. In 2015, there where 2,122,966 people over 65 years old, in Portugal 17. United Nations projections show that the world’s elderly population (over 60 years old) will double by 2050, surpassing 2 billion people 18. This comes to show that ARHL will continue to be a growing public health problem in the coming years.
Genetic pre-disposition to ARHL is supported by studies conducted in mice 19–21. It was found that 19 out of 80 inbred mouse strains showed early-onset hearing loss, while 16 of them revealed hearing loss at an older age. Further studies revealed 18 ARHL loci and 6 of the affected genes in mice have
3
been identified 19–21. The identification of mutations causing hearing loss in humans and their genetic screening is now practical and carried out in some clinical environments. Knowledge of these mutations will also allow susceptible individuals to have a protective behaviour towards their hearing 21.
ARHL results in difficulty interpreting speech sounds, leading to a reduced ability to communicate. This translates into a physical and social impairment such as cognitive deficits, social isolation, dependence, frustration and reduced quality of life 22,23.
Histopathologically, ARHL has been classified as sensory, neural, strial, metabolic, cochlear-conductive, mixed or undetermined, based on temporal bone degeneration, age-related changes of the organ of Corti, ganglion cell, stria vascularis and basilar membrane and its correlation to audiometric data 24.
Nowadays, ARHL rehabilitation relies mostly on the use of hearing aids, which focus on the peripheral auditory part. However, the success rate is limited due to the diversity of structural changes in the hearing pathway. People with peripheral deficits show the better response to hearing aids. Cochlear implant also shows satisfying results in cases of profound hearing loss 24 where the auditory pathways is still preserved. New targeted treatments may be developed through the understanding of the genetics of ARHL, as it may be indicative of the biological pathways of ARHL.
1.2.1.1. GRM7 gene
Glutamate metabotrophic receptor 7 (encoded by GRM7 gene), belongs to the family of G protein-coupled receptors and is linked to the inhibition of the cyclic AMP cascade. L-glutamate is a fast excitatory neurotransmitter, that activates both ionotropic and metabotropic glutamate receptors. It also presents excitotoxic properties in the central nervous system, when it is released in excess or its recycling mechanism breaks down. This leads to a excitotoxic swelling of the postsynaptic target, due to a massive entry of cations and water, possibly resulting in postsynaptic neuron degeneration and loss of internal calcium homeostasis 25,26.
In the mammalian cochlea, the best candidate for a neurotransmitter function at the synapses between the inner hair cells and the primary auditory neuron (type I spiral ganglion neurons) is glutamate. AMPA/kainate receptors are activated first and could be accountable for the synaptic transmission at low and moderate intensities and NMDA receptors seem to be secondarily activated by high-intensity sounds 27.
The single-nucleotide variant or SNP rs11928865, located in the GRM7 gene, has been associated with ARHI in genome-association studies European and Chinese descendant populations 28,29. This gene is thought to be central to maintain glutamate synaptic transmission and homeostasis at the synapses between hair cells and the dendrites of afferent auditory nerve fibers. Excessive quantity of glutamate could be the mechanism mediating neurotoxicity in auditory neurons 30.
1.2.1.2. NAT2 gene
Oxidative stress results from the accumulation of damage, due to an imbalance between the production and the removal of reactive oxygen species (ROS) and free radicals. Oxidative stress has an essential role in the ageing process and the diseases associated with ageing, such as ARHL 13,31.
During the lifetime, the inner ear suffers a series of insults, for instance exposure to noise, drug influences, ear diseases and age related degeneration, which allied with a specific genetic background, such as antioxidant enzymes polymorphisms, might increase ROS levels, leading to hair cell damage 13,31.
In the adult cochlea there are numerous antioxidant enzymes, such as glutathione S-transferase, catalase and N-acetyltransferase. NAT2 (N-acetyltransferase 2) gene, located at chromosome 8p22,
4
codifies a N-acetyltransferase enzyme that detoxifies exogenic substrates by N–acetylation or O-acetylation, contributing to the balance of oxidative status. NAT2 is highly polymorphic, resulting in intermediate, slow or rapid acetylators, having the latter two links to disease. For example, the missense substitutions of the NAT2 alleles, G191A (NAT2*14A), T341C (NAT2*5A), G590A (NAT2*6A) and/or G857A (NAT2*7A), are associated with slow acetylator phenotypes. These missense substitutions result in different functional characteristics, such as decreased protein expression (NAT2*5A and NAT2*6A) and reduced protein stability (NAT2*14A and NAT2*7A). Previous studies have linked the NAT2*6A polymorphism to ARHL in the Caucasian population 13,31.
1.2.1.3. Mitochondrial DNA
The mitochondria is vital in various cellular processes such as ATP production, β-oxidation of fatty acids, iron-sulphur cluster synthesis and apoptosis. The mammalian mitochondria harbour their own genome, that encodes 13 proteins , 2 rRNAs and 22 tRNAs 32.
Mitochondrial DNA (mtDNA) mutations can lead to cellular energy conversion impairment and tissue dysfunction, being also tied to the pathophysiology of age-associated diseases, such as ARHL, and the ageing process itself. Morphology, abundance and oxidative phosphorylation activity changes are seen in ageing mitochondria 32. Recently, a study by Falah et al has described mtDNA copy number as a predictive biomarker for ARHL, as subjects with ARHL present lower mtDNA copy number than healthy individuals, which suggests that it occurs through alteration of mitochondrial function 33.
Age-related mtDNA mutations increases in multiple human tissues such as heart, colon, skeletal muscle and brain. The spectrum of mutations is similar to nuclear DNA, including point mutations, insertions and deletions. A common age-related deletion mtDNA4977 deletion is usually associated with ageing. The levels of this mutation in human cochlear tissue was found to correlate with ARHL severity 32,34.
mtDNA allows the division of the human population in ethnic groups, based on several discrete haplogroups. Haplogroups emerged due to the uniparental inheritance pattern of mtDNA and the negligible recombination at the population level, subdividing the human population through mutations acquired over time. The major haplogroups arose 40000-150000 years ago and have defined different human populations as they migrated out of Africa. The major European haplogroups (H, J, T and U) emerged 39000-510000 years ago. Currently, there are 20 haplogroups identified in the European community 35,36.
It has been suggested that the presence of these “neutral” polymorphisms in mtDNA, defining different haplogroups might cause mild deleterious bioenergenic abnormalities, which contribute to the ageing process. A study by Manwaring et al found that haplogroups U and K (typically European) have a higher predisposition to ARHL 37,38. On the other hand, a study conducted by Bonneux et al found no significant association between any haplogroups and ARHL 38,39.
1.3.Vestibular disorders
Vestibular disorders (VD) are considered a group of diseases leading to transient or permanent loss of vestibular function 3.
VD have a high clinical heterogeneity and overlapping symptoms among the different VD, which limits clinical characterization and phenotyping. According to their clinical presentation, three major syndromes can be distinguished: a) an episodic vestibular syndrome, such as motion sickness and vestibular migraine (VM); b) a progressive vestibular syndrome leading to bilateral vestibular hypofunction, including some rare disorders such as the cerebellar ataxia, neuropathy, vestibular areflexia syndrome (CANVAS); c) and diseases which include sensorineural hearing loss (SNHL) with a variable vestibular dysfunction, such as Meniere’s disease (MD) 3.
5
1.3.1. Meniere’s Disease
MD is a multifactorial disorder that has its age of onset probably determined by the combined effect of genetics and environmental factors. Clinically, it is characterized by attacks of spontaneous vertigo usually associated with unilateral fluctuating SNHL, tinnitus and aural fullness. Vertigo attacks are typically more common in the first years of the disease, however HL and vestibular hypofunction are highly variable among patients. These patients can also develop bilateral SNHL, migraine, and systemic autoimmune diseases. This variability in the course of the disease makes MD phenotyping difficult 40.
The prevalence of MD is highly different depending of the population in study, ranging from 34-190 per 100,000 40. MD has a higher predominance in women and its age of onset ranges from the third to the seventh decades of life 40–42.
Even though MD is considered multifactorial, there are three main hypothesis for its cause: genetic, autoimmunity and allergy.
The frequency of familial cases in European population is 5-15% and in Asian population (South Korean) 6.3%. Familial MD (FMD) studies suggest a genetic heterogeneity and an autosomal dominant pattern of inheritance with incomplete penetrance, however families with recessive inheritance have also been described. FMD is associated with an earlier onset and a tendency to more severe symptoms in successive generations 43,44.
Several studies support that autoimmune mechanisms are associated to the pathophysiology of MD, such as: the finding of elevated levels of autoantibodies or circulating immune complexes in the serum of some patients 45–47; the association with alleles of DRB1 gene of the MHC reported in different populations; the association with a functional variant of LYP, a lymphoid protein phosphatase, which inhibits T cell receptors response in patients with bilateral ear involvement 48,49; and inner ear antigens with molecular weights of 28, 42, 58 and 68 kDa could be the main components inducing autoimmune MD in guinea pigs 50.
The prevalence of diagnosed allergy is three times higher in MD patients than in the general population, being both inhalant and food allergens associated to MD 51. Furthermore, MD patients have elevated levels of IgE (41.3%) compared to healthy controls (19.5%) 52.
Derebery and Berliner described three theories relating allergy to MD that focus on inflammation within the endolymphatic sac (ES): 1) the ES fenestrated blood vessels could allow antigen entry, causing mast cell degranulation and inflammation; 2) circulating immune complexes may be deposited in the stria vascularis, resulting in an increased vascular permeability and fluid
imbalance; 3) viral antigen-allergic interaction, as viruses can damage epithelial surfaces, allowing
an increase in antigen entry and increasing responsiveness to histamine 53.
In support of the theory that the ES is a target for allergic activity, a study conducted in human tissue, has detected the presence of histamine receptor HRH1 in the epithelial lining of the ES and HRH3 expressed exclusively in the sub-epithelial capillary network 54.
There is not an effective treatment for MD, however patients may be helped by a combination of lifestyle and dietary changes, as well as medical therapy (drugs, surgery and physiotherapy) and psychological counselling. Some of the suggested lifestyle changes are allergy-avoidance, reduction of salt intake, avoidance of caffeine, tobacco and alcohol. Regarding medical therapy, several drugs may be administrated, such as: diuretics, betahistine, steroid therapy, that may be used to treat acute and chronic symptoms and gentamicin intratympanic injection, a destructive treatment that can be used in patients with intractable vertigo 55–57.
6
1.3.2. Vestibular migraine
VM is defined by the occurrence of episodic vestibular symptoms and a history of migraine, with a temporal association in at least 50% of the attacks (Annex B) 58. However, it has only been considered a distinct disease since the new millennia, due to its high symptom overlapping with MD 3,59.
VM has a population prevalence of about 1%, however it is considered underdiagnosed. The mean age of first occurrence is 37.7 years for women and 42.4 years for men. It is also 1.5-5 times more frequent in women than men 3,60. VM has been described in several families with an autosomal dominant inheritance 58.
VM patients have a lack of sleep quality and high levels of depression, which causes a general decrease of health-related quality of life 60.
VM patients have a favourable response to anti-migraine drugs, which supports an underlying migraine mechanism. However, this evidence is insufficient as it is based on uncontrolled clinical case series, thus the apparent efficacy may be due to confounding factors, such as placebo response, spontaneous improvement and multiple drug effect 58.
There are families presenting familial hemiplegic migraine (FHM) and common migraine, which suggests a shared pathophysiology, as does VM. FHM has been linked to mutations in three genes:
CACNA1A, ATP1A2 and SCN1A, which induce changes in the conductance of these voltage-gated ion
channels. However, no evidence of an association with genes encoding ion channels linked to FHM has been found in VM. On the other hand, ATPase activity, leading to an increase in Na+ concentration has been linked to migraine pathophysiology. Therefore, genetic variation of ion channels and ion transporters, which regulate fluid homeostasis may underlie susceptibility to VM 3,61.
Migraine is more common in patients with MD than in healthy controls. At times, VM and MD may be indistinguishable based only on medical history and symptoms, also it can present as a comorbidity. VM patients may present fluctuating hearing loss that does not progress to profound levels, tinnitus and aural pressure. Also, MD patients during attacks may experience migraine headaches, photophobia and migraine auras. Yet the pathophysiological relation between VM and MD is uncertain 58.
2. Objectives
The aim of this work is (1) to genetically characterize patients with ARHL, for GRM7 and NAT2 genes and mtDNA haplogroups and (2) to investigate mold-induced immune response in VM patients and (3) to compare it to the response from MD patients.
Determining ARHL genotypes could allow ARHL to be faced as an avoidable disease and not an obligatory age condition, also it could contribute to a molecular diagnostic and to estimate the risk of ARHL.
Defining the effect of allergenic extracts from Penicillium and Aspergillus in proinflammatory cytokines and gene expression profile in VM patients peripheral blood mononuclear cells (PBMC) may allow to distinguish VM patients from MD patients.
Both groups of results will lead to an increased knowledge on the genetic and environmental contribution to inner ear diseases, the main focus of this study.
7
3. Materials and Methods
3.1. Patient Cohorts
Two different patient cohorts were used: one for the study of ARHL and another for the study of VM and MD.
3.1.1. ARHL Cohort
A total of 483 Portuguese middle aged and elderly people were included in this study, with age comprised between 49 and 100 years old. The samples were obtained from institutions that have protocols with the Deafness Group – Translational and Biomedical Investigation Unit, BioISI, FCUL, such as senior universities and retirement homes. To avoid loss of anonymity, all individuals were coded with alphabet letters (PRE) and numbers, to distinguish them. Written informed consent was obtained from all participants.
All patients involved in this study underwent audiometric examination, to assess the degree of hearing loss and a clinical history was obtained. The clinical variables studied were: cardiovascular disease, hypertension, diabetes, high cholesterol, tinnitus, thyroid disease, ototoxic disease, smoking habits, oncological disease, noise exposure, difficulty hearing in noisy spaces and hearing loss. HL (dB) is determined considering the average HL for the tested frequencies (500 Hz, 1000 Hz, 2000 Hz, 4000 Hz) in the best ear.
3.1.2. VM & MD Cohort
A total of 73 samples from patients with VM and 115 samples from patients with MD were collected for this study. Recruitment was carried out in centres distributed over Spain. The experimental protocols of this study were approved by the Institutional Review Board in all participating hospitals and every patient signed a written informed consent.
All patients underwent a complete neuro-otological evaluation and clinical history was obtained. The clinical variables studied were: gender, time course of disease, age of onset, family history of MD, hearing stage at diagnosis, type of headache, history of autoimmune disease, familial MD, cardiovascular risk factors (high blood pressure, type 2 diabetes, dyslipidemia and smoking) and Tumarkin crisis. Hearing stage was defined as a as four-tone average of 500 Hz, 1000 Hz, 2000 Hz and 3000 Hz according to the American Academy of Otolaryngology Head and Neck Surgery (AAO-HNS) (stage 1, ≤ 25 dB; stage 2, 26-40 dB; stage 3, 41-70 dB and stage 4, >70 dB). The types of headache are migraine and tension-type headache. Migraine can be accompanied by or without aura.
3.2. gDNA Extraction
gDNA was extracted from blood samples collected in FTA® cards (Whatman, GE Healthcare), the blood sample was collected through index finger skin puncture. FTA® cards were stored at room temperature. gDNA extraction protocol was followed by the NZY Tissue gDNA Isolation Kit (NZYTech, Lisbon) suppliers recommendations.
3.3.HSV1 and NAT2 PCR
The HVS1 of the mitochondrial genome was amplified and sequenced in order to identify polymorphisms. This region was amplified from position 15975 to 16515. In table 3.1, the primers used for the PCR reaction are identified.
8
Table 3.1- mtDNA primers and respective size of the amplicon.
Primer Sequence Amplicon size (bp)
HVS1-F 5’- CTCCACCATTAGCACCCAAAGC-3’
540
HVS1-R 5’- TGAAGTAGGAACCAGATGTCGG-3’
The PCR reaction mix had the primers at 10 μM, KAPA2G Robust HotStart ReadyMix (2X) (0.5 U/25 µl of reaction) (KapaBiosystems, GrISP, Porto), sterile ultrapure water and DNA. In every PCR a negative control was added, without DNA, to confirm de absence of contaminants. The PCR conditions are present in annex B.
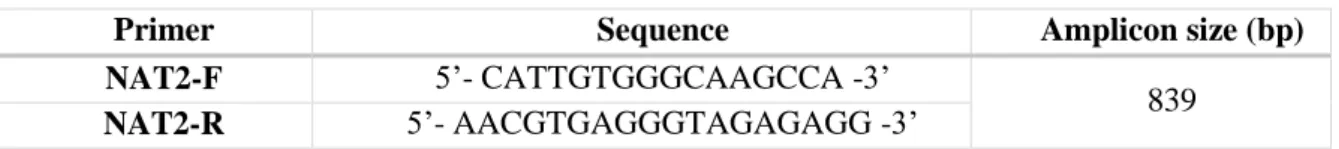
NAT2 gene was amplified and sequenced in order to identify seven SNPs: rs1799930, rs1799931,
rs1801280, rs1208, rs1041983, rs1799929 and rs1801279, that allow to define a haplotype and the corresponding acetylation phenotype. NAT2 gene was amplified from position 13886 to 14724, through a PCR reaction using the primers shown in table 3.2.
Table 3.2 – Primers used to amplify NAT2 gene and respective amplicon size
Primer Sequence Amplicon size (bp)
NAT2-F 5’- CATTGTGGGCAAGCCA -3’
839
NAT2-R 5’- AACGTGAGGGTAGAGAGG -3’
The PCR reaction mix had the primers at 10 μM, 2x Kapa 2G Fast Hot Start Ready Mix (0.5 U/25 µl of reaction) (KapaBiosystems, GrISP, Porto), sterile ultrapure water and DNA. In every PCR a negative control was added, without DNA. The PCR conditions are present in annex B.
All PCR products were observed in electrophoresis, with 2% agarose gel ((SeaKem® LE Agarose, Lonza) and in TBE buffer 0.5X. Midori Green Advanced DNA Stain (GrISP, Porto) was used as DNA intercalating agent, which is observable under blue light. The gel was photographed with the photographic system FastGene® FAS Digi (GrISP, Porto). To compare DNA fragment size it was used GRS Ladder 100 bp (GrISP, Porto). The loading buffer consisted of a 0.25% Bromophenol Blue, 0.25% Xylene cyanol, 95% Formamide and 10mM Sodium hydroxide solution.
3.4. Sequencing and Sequence Analysis
The PCR products were sent to a company STAB Vida, which purifies and sequences the samples. mtDNA sequences were analysed with Chromas Lite 2.1.1 software and compared to the reference sequence J01415.2, with NCBI’s BLAST program. The mtDNA haplogroups were estimated by the mtDNA Haplogroup Analysis software 62.
NAT2 sequences were analysed with the alignment tool Mega6 and compared to the reference
sequence NG_012246.1. NAT2 haplotypes and genotypes were determined considering the N-acetyltranferases database. NAT2 phenotypes were determined with NAT2PRED software 63.
3.5. Genotyping with Real-time PCR
The allelic discrimination of GRM7’s SNP rs11928865 was conducted by real-time PCR, with ABI StepOne™ Real-Time PCR System (Applied Biosystems, Foster City, CA, USA). The 10 μL reaction volume included 5 μL of TaqMan Genotyping Master Mix (Applied Biosystems), 0.5 μL of TaqMan Probe Mix (Applied Biosystems), 0.5 μL of ultrapure sterile water and 4 μL of DNA. The PCR conditions are in annex C.
9
3.6. PBMC Isolation and Stimulation
Peripheral blood was diluted 1:1 with 1× PBS and disposed carefully onto the corresponding 25:15 volume of Lymphosep, Lymphocyte Separation Media (Biowest, Nuaillé, France). Samples were centrifuged for 20 minutes at 2000 rpm to separate blood content. PBMC were collected and washed with 1× PBS and cultured in RPMI 1640 supplemented with 10% (v/v) fetal bovine serum (Biowest, Nuaillé, France) and plated at 1.25x10⁶ cells/mL in 6-well plates. In some experiments, fungus extract was added (2 Allergenic Extract-Mix fungus containing, in one case, 4 equal parts of Mix Aspergillus (oryzae, repens, niger and terreus) and in the other case, 4 equal parts of Mix Penicillium (brevicompactum, expansum, notatum and roqueforti)). The combinations were dialyzed to remove phenol using Tube-o dialyzer (VWR International, Radnor, PA, USA) against deionized distilled water. Each subject had a well per condition and 1.25 x 10⁶ PBMC/mL was stimulated with 5 μg/mL dialyzed mixed fungus. PBMC were incubated during 16 h at 37°C in 7% CO2 and compared with cultured, unstimulated PBMC. The optimal concentrations of these mixtures were identified for previous studies conducted by the group. At the end of all incubations, PBMC were centrifuged, RNA and proteins harvested and supernatants were collected and stored at -80 °C.
3.7. RNA Extraction
RNA was isolated using the RNeasy® Mini Kit (Qiagen) following the manufacturer’s protocol. RNA concentration was measured on a Nanodrop (NanoDrop Technologies Inc.,Wilmington, DE, USA). RNA quality was checked using Agilent 2100 Bioanalyzer (Agilent Technologies, Waldbronn, Germany).
3.8. Quantitative PCR
One-hundred ng of RNA was converted into cDNA using Maxima First Strand cDNA Synthesis Kit for RT-qPCR with dsDNase (Thermo Fisher Scientific) and cDNA samples were diluted to 2 ng/μL for the qPCR assays.
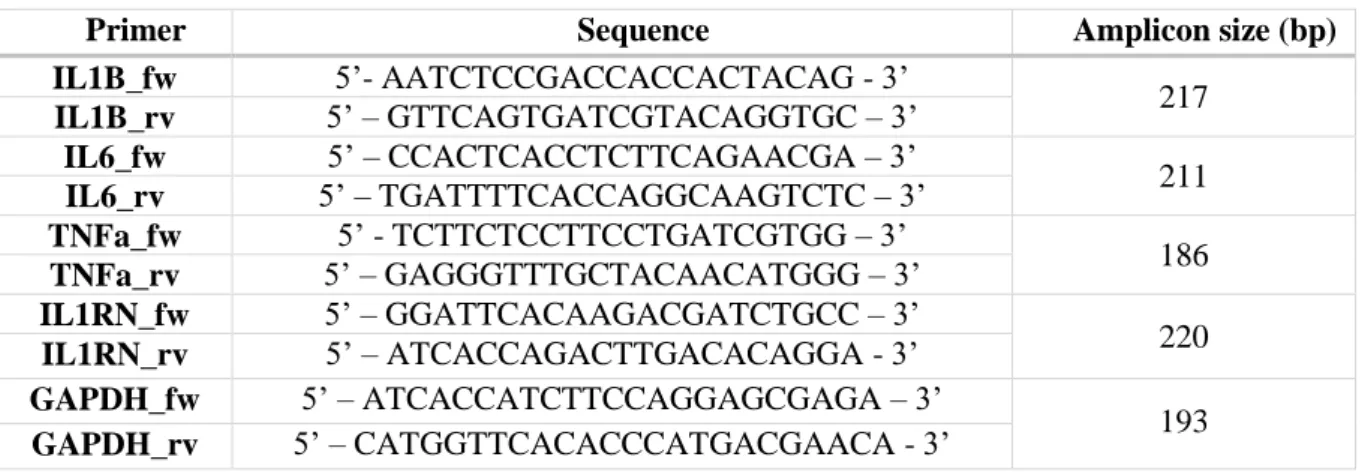
The quantification of IL-1β, IL-1RN, IL-6, TNFα and Glyceraldehyde 3-phosphate Dehydrogenase (GAPDH) gene expression was conducted by quantitative PCR (qPCR) from each cDNA sample. Reactions were made with a final primer (table 3.3) concentration of 1 μM in a final volume of 20 μL and using Brilliant III Ultra-Fast SYBR® GreenQPCR Master Mix (Agilent Technologies) as detection system under the PCR conditions present in table 8.5 (Annex C), using an ABI 7900 HT Fast Real-Time PCR Systems (Life Technologies). No template controls were included in all qPCR plates. To check for reproducibility, four technical replicates were carried out for each sample. GAPDH was used as an endogenous expression control.
Table 3.3 – Primers used to amplify cDNA of each cytokine and respective amplicon size.
Primer Sequence Amplicon size (bp)
IL1B_fw 5’- AATCTCCGACCACCACTACAG - 3’ 217 IL1B_rv 5’ – GTTCAGTGATCGTACAGGTGC – 3’ IL6_fw 5’ – CCACTCACCTCTTCAGAACGA – 3’ 211 IL6_rv 5’ – TGATTTTCACCAGGCAAGTCTC – 3’ TNFa_fw 5’ - TCTTCTCCTTCCTGATCGTGG – 3’ 186 TNFa_rv 5’ – GAGGGTTTGCTACAACATGGG – 3’ IL1RN_fw 5’ – GGATTCACAAGACGATCTGCC – 3’ 220 IL1RN_rv 5’ – ATCACCAGACTTGACACAGGA - 3’ GAPDH_fw 5’ – ATCACCATCTTCCAGGAGCGAGA – 3’ 193 GAPDH_rv 5’ – CATGGTTCACACCCATGACGAACA - 3’
10
3.9. Extracellular Cytokine Level Determination
Conditioned supernatants were collected and stored at –80 ºC until a sufficient number of samples were acquired. Frozen samples were thawed immediately prior to analysis and none of the samples underwent repetitive freeze-thawing cycles prior to analysis. IL-1β, IL-6, IL-1RA and TNFα levels in conditioned supernatant were quantified simultaneously with a commercially available Multiplex Bead-Based Kit (EMD Millipore, Billerica, MA, USA), in accordance with the kit-specific protocols provided by Millipore, using a Luminex 200 (Luminex Corp., Austin, TX, USA) and read with Luminex x PONENT 3.1 software (Luminex Corp.). The minimum detection limit for the assay was 0.14pg/mL and the maximum 10000 pg/mL. Samples with readings below or above these levels were assigned values of 0pg/mL for the minimum value or 10000pg/mL for the maximum value. The reliability of the measurements were previously determined for previous studies conducted by the group, by calculation of the Intraclass Correlation Coefficient (ICC) and sandwich-ELISA (>80%).
3.10. Expression Array
Expression levels were measured using the HumanHT-12 v4 Expression BeadChip (Illumina Inc.) with 500 ng of total RNA and processed with the high resolution scanner iScan (Illumina Inc.). Limma R package from Bioconductor was used for expression data analysis, normalization and differential expression analysis.
Signalling pathway analysis was performed using Ingenuity Pathways Analysis (IPA®, Qiagen, Venlo, Netherlands, http://www.ingenuity.com/products/ipa) software. Core analysis tool was executed using the DEG with an adjusted p-value cut-off of 0.001.
3.11. Statistical Analysis
A descriptive analysis was conducted using SPSS software (SPSS Inc.) for both cohorts.
The audiograms were analyzed considering the best ear (estimated based on the lowest average of frequencies of 500 Hz, 1000 Hz, 2000 Hz and 4000 Hz). For the results from ARHL cohort, Chi-square Test was used for general association between two variables were used. Kruskal-Wallis (for more than 2 groups) tests were employed to compare hearing thresholds. All the results were analysed through logistic regression model, where age was considered as control for all the others variables.
For the results from VM and MD cohort, quantitative variables were compared using Student’s unpaired T-test. Qualitative variables were compared using cross tables and Fisher’s exact test.
11
4. Results
4.1. Demographic Results
A descriptive analysis was conducted for both cohorts. Demographic results from ARHL cohort were analysed considering the influence of the variables on hearing loss. VM and MD cohorts were compared to determine differences between the demographics of the diseases.
4.1.1. ARHL Cohort
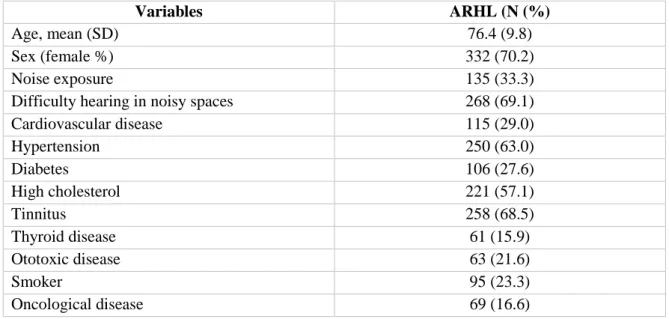
Due to the nature of the questionnaire, it was not possible to obtain full information from the 483 individuals, therefore on table 4.1 the percentage of each variable is relative to the number of answers obtained. This cohort is composed mostly by women and the mean age is 76.49.8 years. A great majority of the individuals also show difficulty of listening in noisy environments (69.1%) and have tinnitus (68.5%).
Table 4.1 - ARHL cohort descriptive analysis of demographics and clinical history.
Variables ARHL (N (%)
Age, mean (SD) 76.4 (9.8)
Sex (female %) 332 (70.2)
Noise exposure 135 (33.3)
Difficulty hearing in noisy spaces 268 (69.1)
Cardiovascular disease 115 (29.0) Hypertension 250 (63.0) Diabetes 106 (27.6) High cholesterol 221 (57.1) Tinnitus 258 (68.5) Thyroid disease 61 (15.9) Ototoxic disease 63 (21.6) Smoker 95 (23.3) Oncological disease 69 (16.6)
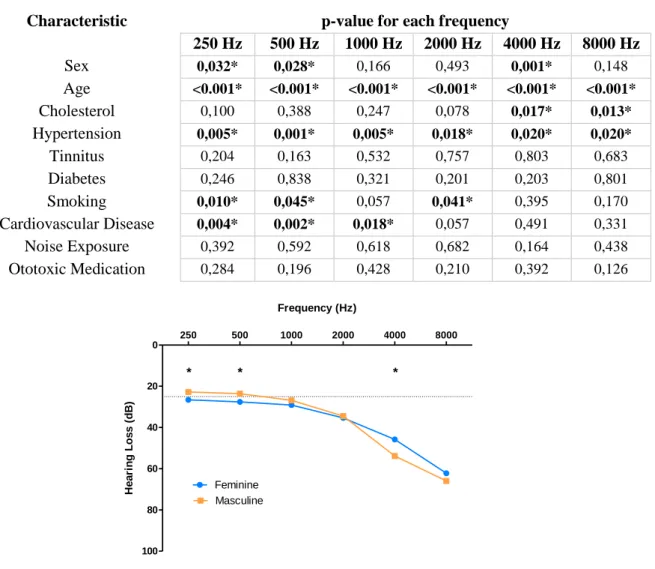
The effect of demographics and comorbidities was tested for each of the hearing frequency considered. It was evident that there was a significant difference for sex, age, hypertension and cardiovascular disease, as seen on table 4.2. The effect of sex it is evident on lower frequencies (250 Hz and 500 Hz) where men have better hearing and at 4000 Hz there is an inversion and women turn into the better listeners (figure 4.1).
They were then categorized by mean HL in the best ear according to the WHO classification, which revealed that 33% of the sample has normal hearing and 67% of the sample have hearing loss (34.5% have mild HL, 27.5% have moderate HL and 5% have severe to profound HL). The same characteristics where analysed to see if they have an effect on the prevalence of HL (Annex D), which showed that age, cholesterol, hypertension and cardiovascular disease have an effect on HL. Moreover, a multivariate logistic regression controlled by age was conducted, which showed the effect of cholesterol and diabetes on HL (table 4.3). This is, for the same age, people with cholesterol show a 40% inferior probability of HL compared to people without cholesterol. People with diabetes show a 77% superior probability of HL than people without diabetes
12
Table 4.2 - Effect of demographic and clinical features on HL per frequency (Hz)
Characteristic p-value for each frequency
250 Hz 500 Hz 1000 Hz 2000 Hz 4000 Hz 8000 Hz Sex 0,032* 0,028* 0,166 0,493 0,001* 0,148 Age <0.001* <0.001* <0.001* <0.001* <0.001* <0.001* Cholesterol 0,100 0,388 0,247 0,078 0,017* 0,013* Hypertension 0,005* 0,001* 0,005* 0,018* 0,020* 0,020* Tinnitus 0,204 0,163 0,532 0,757 0,803 0,683 Diabetes 0,246 0,838 0,321 0,201 0,203 0,801 Smoking 0,010* 0,045* 0,057 0,041* 0,395 0,170 Cardiovascular Disease 0,004* 0,002* 0,018* 0,057 0,491 0,331 Noise Exposure 0,392 0,592 0,618 0,682 0,164 0,438 Ototoxic Medication 0,284 0,196 0,428 0,210 0,392 0,126
Table 4.3 - Multivariate logistic regression controlled by age.
Characteristic OR p-value Sex (Masculine) 1.34 0.294 Cholesterol (Yes) 0.60 0.077* Hypertension (Yes) 1.23 0.487 Tinnitus (Yes) 1.14 0.664 Diabetes (Yes) 1.77 0.089* Smoking (Yes) 1.29 0.438
Cardiovascular Disease (Yes) 1.51 0.225
Noise Exposure (Yes) 1.46 0.203
Ototoxic Medication (Yes) 0.92 0.831
4.1.2. VM & MD cohort
It was not possible to obtain full information from all the patients, therefore on table 4.4 and table 4.5 the percentage of each variable is relative to the number of answers obtained.
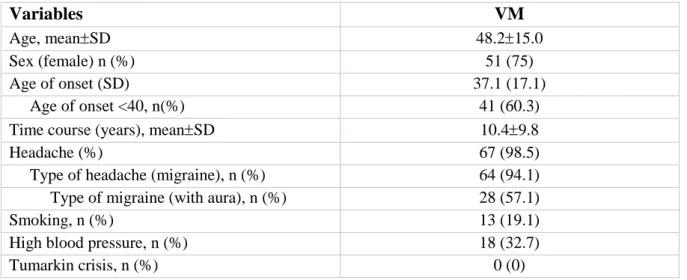
VM patients have a mean age of onset of 37.115.0 and have slightly more frequent migraine with aura. These patients have no history of Tumarkin crisis (table 4.4). On the other hand, MD patients have a higher age of onset (48.314.4 years) and have least frequently headaches, also they have a slight predominance of female affected patients (table 4.5).
250 500 1000 2000 4000 8000 0 20 40 60 80 100 Feminine Masculine * * * Frequency (Hz) He a ri n g L o s s ( d B )
13
Table 4.4 - VM patients' descriptive analysis for demographics and clinical history.
Variables
VM
Age, meanSD 48.215.0
Sex (female) n (%) 51 (75)
Age of onset (SD) 37.1 (17.1)
Age of onset <40, n(%) 41 (60.3)
Time course (years), meanSD 10.49.8
Headache (%) 67 (98.5)
Type of headache (migraine), n (%) 64 (94.1)
Type of migraine (with aura), n (%) 28 (57.1)
Smoking, n (%) 13 (19.1)
High blood pressure, n (%) 18 (32.7)
Tumarkin crisis, n (%) 0 (0)
Table 4.5 - MD patients' descriptive analysis for demographics and clinical history.
Variables
MD
Age, meanSD 60.712.6
Sex (female %) 67 (58.8)
Age of onsetSD 48.314.4
Age of onset <40, n(%) 32 (28.6)
Time course (years), meanSD 10.39.0
Affect ear (unilateral) n (%) 73 (64.0)
Headache (%) 42 (39.6)
Type of headache (migraine), n (%) 22 (48.9)
Familial md, n (%) 10 (9.7) Hearing stage 1 9 (8.2) 2 31 (28.2) 3 51 (46.4) 4 19 (17.3) Autoimmune disease (%) 16 (17.6) Smoking, n (%) 17 (16.7)
High blood pressure, n (%) 26 (26.5)
Dyslipemia, n(%) 21 (27.6)
Type 2 diabetes 9 (9.8)
Tumarkin crisis, n (%) 18 (17.6)
A comparison between VM and MD patients revealed that there are differences between the age of the patients, age of onset of the disease, prevalence of females affected, frequency of headaches and migraine (table 4.6). However, when comparing VM to the specific MD type 4 64, characterized by the presence of migraine in all cases, it is observed that there are only significant differences in age of the patients and the age of onset of the diseases (table 4.6).
14
Table 4.6 - Comparison of VM patients’ demographics and clinical history to MD patients and MD type 4 patients.
Variables VM MD p-value MD type 4 p-value
Age, meanSD 48.215.0 60.712.6 1.18×10⁻⁸ 60.712.2 0.0104
Sex (female %) 51 (75) 67 (58.8) 0.023 9 (81.8) 0.476
Age of onsetSD 37.117.1 48.314.4 5.0×10⁻⁶ 51.913.1 0.00760
Time course (years),
meanSD 10.49.8 10.39.0 0.960 5.65.1 0.121 Headache (%) 67 (98.5) 42 (39.6) 8.18×10⁻¹⁸ 11 (100) 0.861 Type of headache (migraine), n (%) 64 (94.1) 22 (48.9) 4.2×10 -8 11 (100) 0.542
4.2. GRM7 gene
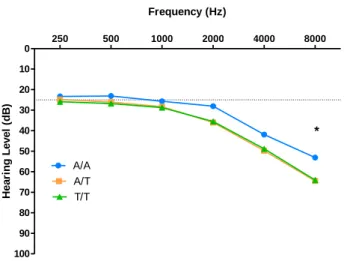
From the total of 467 people genotyped by real-time PCR for the GRM7 SNP rs11928865, only 337 individuals had full audiogram information, therefore only these were considered for the analysis. In table 4.7, it is possible to observe that the most common genotype is T/T with a corresponding mean HL of 35.0115.61 dB and the least frequent genotype is A/A with a mean HL of 29.7016.03 dB.
The genotype effect was tested for each tested hearing frequency and as observed in figure 4.2, there is a significant difference at 8000 Hz (p-value=0.048). However, when categorized by mean HL in the best ear according to the WHO classification and tested to evaluate the effect of GRM7 SNP rs11928865 genotype on HL there were no significant differences (p-value=0.133). Also, a multivariate logistic regression controlled by age showed that comparing to A/A genotype, A/T genotype had a 1.93 times higher hearing loss risk and T/T genotype a 2.08 times higher hearing loss risk, but this was not statistically different (table 4.8).
Table 4.7- Distribution of individuals according to GRM7 rs11928865 and its associated mean HL Standard deviation (SD).
Genotype N (frequency) Mean HL SD (dB)
A/A 21 (6.2%) 29.7016.03
A/T 115 (34.1%) 33.9516.01
T/T 201 (59.6%) 35.0115.61
Table 4.8 - Logistic model applied to HL controlled by age, considering GRM7 SNP rs11928865 A/A genotype as reference
GRM7 genotype OR (95% CI) p- value (Wald)
A/T 1.93 (0.69,5.52) 0.210 T/T 2.08 (0.77,5.68) 0.147 250 500 1000 2000 4000 8000 0 10 20 30 40 50 60 70 80 90 100 A/A A/T T/T * Frequency (Hz) H e a ri n g L e v e l (d B )
Figure 4.2 – Effect of GRM7 SNP rs11928865 genotype on HL (dB) for each tested frequency (Hz).