A Work Project, presented as part of the requirements for the Award of a Masters Degree in Management from the NOVA – School of Business and Economics
Sovereign Debt and CRAs: Where Does the Power Lie?
MICHELE GALLO (1045)
A project carried out on the Financial Management course, under the supervision of: Prof. Qinglei Dai
2
SOVEREIGN DEBT AND CRAs: WHERE DOES THE POWER LIE?
ABSTRACT
This work project analyzes how changes in sovereign debt rating within Europe can affect the stock performance of the event country, and which are the factors that influence this impact. We found a significant impact made by both positive and negative watchlisting, while upgrades entail a significant downward reaction when they are preceded by watchlist activity. A further analysis of this impact allowed us to identify a surprise effect, composed by the presence of warning, the level of discussion and whether other agencies previously implemented the same action. Assuming the semi-strong form of market efficiency holds, these findings suggest CRAs are considered to disclose private information.
3 1. Introduction - General Overview
Past 20 years showed a periodical intensification of attention towards Credit Rating Agencies (CRAs), particularly during periods of crisis. Many people started to ask whether the presence of mainly US-based independent organizations, controlling the ability of a Sovereign State to gather credit, would enhance their power over reasonable level; moreover, if this could generate conflict of interests. Nowadays, because of the European Sovereign Debt Crisis, the debate reached a new peak. As already happened during the 1997 Asian financial crisis, people started considering if the action of the CRAs, namely the downgrading and negative outlook, was partially responsible for the spiral of fear within the financial markets. What really matters is what kind of sentiment these announcements are able to generate within the markets. If we consider the semi-strong form of market efficiency, markets only react when a previously private information becomes public. If CRAs disclose private information, this would give them discretional power to generate turbulence within the markets.
Consider a simple example: on November 10th 2011, S&P mistakenly reported a downgrade for the French triple A rating, somehow anticipating future action, to be taken on January 13th 2012. This generated two effects: on one side the AMF (Autorité des marchés financiers) and French government furiously turned against the Agency, on the other French 10-year bond yield increased 27 basis points on the day, leading the spread over German Bund to increase up to 168 basis points, one of the largest figure of the euro era1. S&P reported this was only a technical error; nonetheless it strongly influenced market movements. If we compare it to the effect the actual downgrade had on French bond yield (only 4 basis points increase), the incredible impact an unexpected
1 Source: “Financial Times” – November 10th, 2011
2
4
announcement by the CRAs can have becomes obvious. This work project enters this discussion with the specific aim to analyze how financial markets react to particular news from CRAs. Specifically, we empirically investigate the two following research questions: how the stock market reacts to sovereign rating announcements; and how this reaction is related to the surprise effect within the markets, namely when and how prices incorporate the news announcements.
Our major findings highlight that CRAs have strong influences over domestic market. We found that negative announcements are associated with significant downward effects in the stock market around the event day. On the other hand, we find that upgrade announcements are also related to negative stock market reactions, and such negative reactions are particularly related to previous positive watchlisting by the CRAs. We argue that this pattern seems to be a counterbalance of the previous overreaction caused by the watchlisting. Moreover, wider impact of watchlist changes compared to actual rating variations is persistent in all cases. When analyzing how does the surprise element affect the reaction, we found an amplified effect in case of widely discussed (which in our model means unexpected) negative news. Positive unexpected announcements seem to be characterized by price stickiness to a certain threshold in the short run. Furthermore, upgrades are significantly affected by the presence of similar action by another Agency, and the above mentioned negative impact over upgrades of previous watchlist actions is hereby confirmed. The overall picture drawn by these surprise factors leads us to the insight that CRAs are likely to be considered to disclose private information, an important starting point in the discussion of what role should they have within financial markets in the future.
5
from earlier studies (Michaelides, Milidonis et al., 2012; Cantor & Packer, 1996) who examine the CRA announcement effects in global markets, our case is narrowed down to European countries, and the benchmark to be used for comparison is hereby identified by the European MSCI Index. Second, we employ several new proxies for market surprises, such as the level of discussion around the topic, incorporated by the number of Bloomberg News, the presence of previous corresponding watchlist movements, and whether another Agency already implemented the same action. Third, we reached, among others, completely original conclusions, in particular about upgrades.
The structure of the paper is as follows. After this brief introduction, Section Two includes a simple literature review, clarifying the starting point of this study, and showing results previous literature already reached. In Section Three, the focus will be pointed towards the empirical dataset, and what is the implication it had in the upcoming study. The fourth section focuses on descriptive analysis regarding both simple and abnormal returns. The fifth section explains in detail the regression results. And the last section will draw a general picture of what has been found, and how this can vary the way we assume CRAs behave.
2. A Brief Literature Review
Rating literature, starting from the 90s, has been developing in two main directions. On one side, many studies tried to figure out what are the determinants of Sovereign Debt Rating; namely, they analyzed if movements of specific macroeconomic factors can explain rating variations. Cantor & Packer (1996) were pioneers in this kind of studies. In a famous paper, they identified six influential factors: per capita income, GDP
6
growth, inflation, external debt, level of economic development and default history. A. Afonso (2003) reached equivalent results, testing also prediction error trend according to linear and logistic transformations: conclusions demonstrate the latter outperforms the former, meaning low rating moves quicker than high rating, since requirements are less demanding. This kind of predictive model has been used also to back-test whether CRAs were able to predict financial crises, and if they just accordingly reacted or massively increased the related effects. N. Mora (2005), along the lines of Ferri et al. (1999), criticizes CRAs' behavior during the Asian financial crisis, defining the rating actions in excess of what predicted, and moreover sticky after the crisis period. Being the ratings sticky, the authors conclude they probably do not give much new information to the market, because they only react to adjust their own perspective to the current market conditions. These results contrast with the predictions from Cantor & Packer (1996): they show announcements by the CRAs have considerable market impact on bond yield.
This directly connects to the second direction in which rating studies have been evolving, which is exactly where this work project comes in: analyzing mainly through event studies the impact of rating variations over bonds and stocks. We should mention the first papers concerned mainly corporate debt ratings (Hand, Holthausen & Leftwich, 1992), even if later, driven by historical events like the Mexican, the Asian and the latest Global financial crises, the focus moved to sovereign debt (Cantor & Packer, 1996; Steiner & Heinke, 2001; Kiff, Nowak & Schumacher, 2012; Michaelides, Milidonis, Nishiotis & Papakyriacou, 2012). Most of these academic studies, even if through different frameworks, reaches similar conclusions for the whole sample, which generally includes countries from all over the World: asymmetry between upgrades and
7
downgrades2, where only the latter presents significant and temporary abnormal returns, due to CRAs’ action, while the former does not have similar impact. This work project partially builds up on these conclusions. On one side the focus is narrowed down to Europe, but, as next paragraphs will show, on the other further analysis on upgrades revealed the possibility for a positive market overreaction to positive announcements, to be counterbalanced in the moment of the actual rating variation.
The topic regarding general market reaction to CRAs’ actions was followed also by interesting specifications, concerning for example the spillover effect over emerging markets (Kaminsky & Scmukler, 2002), international markets in general (Gande & Parsley, 2004; Ferreira & Gama, 2007) or among European countries within the current European Sovereign Debt crisis (Arezki, Candelon et al., 2011; Brutti & Sauré, 2011). Even if the subject of this study focuses only on the event country, without directly considering spillover effect, the asymmetric reaction between upgrades and downgrades that these papers jointly reveal, not only is in line with our solutions, as discussed above, but does represent a powerful magnifier of the effect CRAs have on the market, especially in period of heavy crisis, like the one we are currently in.
3. Data
We start by defining the event days on which the events occurred. Through Bloomberg software, a database listing all CRAs' actions (upgrades and downgrades) and watchlist changes3 (upward and downward) was created, both considering long-term debt ratings
2
Hereby this definition includes both the actual changes and positive/negative announcements.
3
According to CRAs’ definition, a credit issuer is put on Watchlist, or CreditWatch, if “events or circumstances occur that may affect a credit rating in the near term” (S&P), if “a rating is under review for possible change in the short-term” (Moody’s), and if “there is a heightened probability of a rating change… generally resolved over a relatively short period” (Fitch). The main difference with Rating Outlook is the time horizon, since the latter represents a long-time (6 months to 2 year) direction.
8
in local currency. In this way 207 observations were identified from 16 countries, including 12 members of the Eurozone (Austria, Belgium, Finland, France, Germany, Greece, Ireland, Italy, Luxembourg, Netherlands, Portugal, Spain), 3 countries only in the European Union (Denmark, Sweden, UK), and 1 more only in the European Economic Area (Norway). Since positive and negative actions are supposed to differently affect stock financial markets, the overall sample was divided in 132 negative events (80 downgrades and 52 negative watchlist) and 75 positive events (62 upgrades and 13 positive watchlist). This events list considers only the three largest CRAs (S&P, Fitch and Moody's), given that both regulators and previous literature rarely include other rating companies in their considerations. This is due to the incredible relevance these three agencies have on investors, since, for example, they are responsible for 98% of all outstanding ratings among the agencies recognized by the SEC (Security and Exchange Commission)4.
Given these events, two other kinds of data were required. First of all, in order to inspect the market reactions to the ratings news, we calculate the abnormal market returns around the event days. In the process of calculating daily abnormal returns, historical returns of both the MSCI Index for each Event Country and the MSCI Europe Index were collected. These data include two window periods around each event: [-250;-1] and [-20;+20]. The former is considered to incorporate market trends before the event5, while the latter represents a reasonable amount of time6 to check for
- Source: Company Websites:
http://img.en25.com/Web/StandardandPoors/SP_CreditRatingsGuide.pdf
http://www.fitchratings.com/web_content/ratings/fitch_ratings_definitions_and_scales.pdf
http://www.moodys.com/sites/products/AboutMoodysRatingsAttachments/MoodysRatingsSymbolsa nd%20Definitions.pdf
4
2008 SEC NRSRO (National Recognized Statistical Rating Organizations) Report.
5
We believe that including 250 days prior the event not only allows to have enough information about the market, but also permits to distinguish among different time periods, since each of them may be related to different drivers of interest.
9
significant consequences related to the CRAs’ action. However, we believe that there could be high covariance between the MSCI Europe index and the individual country index for several reasons. First, certain country stock indices could be highly correlated with the MSCI Europe index because the former take up substantial weights in the calculation of the latter. Second, ratings news may cause a spill-over reaction at the pan-European level, more than simply at country level. Therefore our specification for the abnormal return might be downward biased. Hence we use two specifications for the stocks returns: the abnormal market returns of the respective country around the event day, as well as the simple stock index returns.
Then, in order to deepen the understanding of the role of CRAs in relation to market efficiency, another set of data was gathered, to be used as a proxy for the likelihood of the news to be expected or not: the number of news published by Bloomberg related to the topic of interest in a 7-day time window after the event. The rationale behind this proxy is straightforward: the less anticipated a piece of news is, the more discussion it would provoke. In this way it becomes possible to highlight the presence of correlation between cumulative abnormal returns and the degree of expectation within the markets.
4. Descriptive Analysis
4.1 Using simple index returns around the event day
Table 1 reports the overall conclusion derived from our descriptive analysis. In order to provide a better understanding of the relation between simple and abnormal returns, the above mentioned table presents the former in Panel A and Panel B, and the latter in Panel C and Panel D. Notice each type of returns is further divided according to its 6
Even if the [-20; +20] windows is one of the most common in this kind of analysis (see Michaelides, Milidonis et al., 2012), other studies use different time periods, like [-10; +10] (Kaminsky & Schmukler, 2002), [-30; +20] (Cantor & Parker 1996) or even [-180; +180] (Steiner & Heinke, 2001).
10
relation to negative or positive announcements concerning the sovereign rating, and then four event windows are taken in consideration: two of them are connected to immediate market reaction (the event day, 0, and [-1; +1]), and the remaining widen the analysis to larger periods, in particular [-5; +5] and [-20; +20]. Moreover, acknowledging the influence that being previously moved in positive or negative watchlist can have at the moment an actual rating variation occurs, we further divided this category in two branches: they differ in such a way the first one includes those rating changes anticipated by a watchlist action in previous 6 months. This section will focus on simple returns, while next will move the discussion to abnormal returns. Looking at Table 1, some of the average returns present statistical significance. This is the case of the [-1; +1] window, reporting a negative return of -1.04% after a country is put under negative watchlist (significant at 10% level). This means such an action has a negative impact on domestic stock markets, in particular in the short run. Moving to positive announcements, we can see in Panel B how upgrades preceded by positive watchlist are characterized by significant negative returns in the short run, both in the event day, with a return of 0.41%, significant at 5%, and in [1; +1], with a return of -0.62% significant at 10%. This implies an upgrade can generate a negative reaction by the market. Even if this seems counterintuitive, once we consider this effect does not appear in case of upgrades without previous warning, we can hypothesize this may be due to an overestimation by the market at the moment of the watchlisting action, to be counterbalanced when the rating actually increases. This conclusion can be even more appreciated if we start dealing with positive watchlist movements. This kind of announcement in our results is linked to impressive positive cumulative returns, reaching 2.93% in [-5; +5] with a statistical significance of 10%, and so much as 8.49%
11 in [-20; +20] with a statistical significance of 1%.
To complete this part of the descriptive analysis, we provide a graphical approach as well in Figure 1 and Figure 2. The main reason is to understand the returns behavior over the all period of 20 days before and after the event, even if there may be a lack of statistical significance. Moreover, this will allow us to easily compare the results concerning abnormal returns. As a matter of fact, looking at results from the following section, we noticed that the patterns of the two types of returns are very similar. To avoid duplication, and given the higher importance of abnormal returns in the long run, we decided to only provide comments to these patterns in next section.
4.2 Using abnormal returns around the event day
Panel C and Panel D from Table 1 present the descriptive analysis of abnormal returns (see Appendix for information about data generation). The rationale behind calculating abnormal returns is the likelihood of simple returns to be driven by general market conditions. This kind of effect is clearly amplified the longer the event window is. For this reason we tried to eliminate external trends, and gather in such a way insights related only to the domestic market.
The results obtained from abnormal returns presents only few differences from the ones in Panel A and Panel B. In Panel C we observe that negative watchlisting is related in the very short term to negative abnormal returns, -0.41% in the event day and -0.85% in [-1; +1]; in both cases they are supported by statistical significance at 5% level. Moving to Panel C, the negative impact of upgrades anticipated by positive watchlist is confirmed, and now it has significance for all the event windows. In particular, these positive announcements are characterized by negative abnormal of -0.51% in the event
12
day and of -1.11% in [-1; +1] (both significant at 10%); of -2.34% in [-5; +5] (significant at 5%); of -6.46% in [-20; +20] (significant at 1%). This confirms the previous hypothesis of overreaction to positive watchlist, even if in this case the market seems to go down after an upgrade even further than the positive variation due to watchlisting, meaning the effect is amplified. As far as concerning the overestimation effect in Panel C, as already happened when analyzing simple returns, average abnormal returns confirm its presence, however, since it is not supported by statistical significance in any case, its role is less relevant.
Previous literature including event studies often goes with a graphical analysis, to observe the cumulative abnormal returns (CARs) impact over the entire event window. In order to compare our conclusions to other academic papers, and following the same structure of previous section, Figure 3 to 6 identify the movements of CARs around the event day in case of both positive and negative announcements. In particular, we added to previous section graphical framework also the overall impact of generic positive and negative announcements, considering altogether rating and watchlist changes7.
Figure 3 represents the CAR for all kind of negative CRAs’ actions; in this case results are consistent with both Steiner & Heinke (2001) and Michaelides, Milidonis et al. (2012). The implied message is straightforward: market presents a strong reaction, both pre-announcement and post-announcement, to this kind of news. In particular, even if the effect seems to last, what really surprises is the temporary deep jump immediately close to the event day, to be recovered in part in the following days. Figure 4 decomposes this impact according to Table 1 structure. The conclusion is consistent with what has been previously said: negative watchlist have an important negative
7
13
impact on markets, while no significant trend emerges if we look at downgrades, both with and without a prior threat8.
Moving to Figure 5, the preannouncement situation is in line with previous literature, showing minor, non-significant positive CARs. It definitely changes when dealing with the post announcement phase: instead of remaining around 0, the CARs from day 5 present a deep downward trend, leading to negative results up to day 20. We already discussed what may be the rationale behind this negative effect, and previous considerations have an even easier visual explanation when we take a look at Figure 6, which deals with the different kinds of actions related with positive announcements. The figure makes it clear there are three separate trends. Positive watchlist movements belong to the first group, and they are related to positive CARs in the entire sample, particularly in the post announcement phase. The second sample, which includes upgrades without warning, perfectly reflects results from similar event studies: the line is flat, and CARs are not significantly different from zero. Third, upgrades preceded by watchlist movements represent the line with negative slope after the event day: this is what we previously defined as an overestimation effect, and visually shows the negative impact an upgrade can generate on domestic markets, in specific situations.
The results from the two sets of simple and abnormal returns, even if partially correlated, have clearly distinctive characteristics. In particular, simple returns do not succeed in explaining the results concerning cumulative returns, which become highly dependent on the corresponding European situation when we consider a large enough event window; this becomes clear when we compare the corresponding graphs from
8
14
abnormal returns. For this reason we concluded that, while simple returns may be appropriate in the valuation of short term effects, abnormal returns are a better fit when dealing with cumulative returns in longer windows.
5. Regression Analysis 5.1 Methodology
The second part of the work project seeks for correlation between stock market returns and the degree of surprise caused by the event. The aim here is to understand the behavior of CRAs, and to distinguish if they only incorporate information already available to the market, or they disclose private information. In particular, once we assume they have an impact on markets, if the surprise element includes a big part of this reaction, it means markets are driven by the acknowledgement of previously private information, once we assume the semi-strong form of market efficiency holds. However, this would rise the doubt of whether CRAs should be allowed to incorporate such a transmission mechanism. For this reason a simple linear regression analysis, decomposing the effect of rating variation on returns in various elements, is performed according to the equation:
𝑅𝑖= 𝛾 + 𝛿 ∗ 𝑁𝑒𝑤𝑠𝑖+ 𝜋 ∗ 𝐹𝑖𝑟𝑠𝑡𝑖+ 𝜔 ∗ 𝑊𝑎𝑟𝑛𝑖𝑛𝑔𝑖+ 𝜌 ∗ 𝐸𝑢𝑟𝑜𝑖+ 𝜇 ∗ 𝐶𝑟𝑖𝑠𝑖𝑠𝑖+ 𝜀 [1]
The dependent variable, 𝑅𝑖, is the stock market return. As we have defined earlier, it takes multiple specifications, according to whether it considers daily or cumulative, simple or abnormal returns, and what event window it includes. The constant, γ, captures the impact of the event on the stock price. We expect γ to be significantly positive for positive announcements and significantly negative for negative announcements, which would imply stock markets react accordingly to the news
15
direction, once we get rid of all the other variable components.
We use three variables to measure the unexpectedness of the ratings change. News is the number of related news published by Bloomberg within a week after the event day. We expect this variable to behave as a magnifying glass for returns, which implies the coefficients would show consistent trends with the results we highlighted in the descriptive analysis for each of the corresponding event window. In addition, dummy variable First shows whether there was in the previous three months an action in the same direction by a different CRA, separately considering rating variations and watchlist movements. We expect that this component presents not only coefficients in line with the specified announcement, but also significant impact, since CRAs’ action are definitely correlated, and this means markets will react differently if they are waiting for an Agency to adjust its rating or not. The third variables, Warning, directly refers to the overestimation effect discussed in the descriptive analysis: it reports whether in the previous 6 months the rating change was preceded by a watchlist movement in the same direction. Obviously, this variable is available only for those announcements comprehending an actual downgrade or upgrade. According to the hypothesis made in last section, we expect Warning to have a coefficient sign opposite to the type of announcement, because of its rebalancing function; furthermore, we expect the impact to be significantly stronger in the post announcement phase, in line with the graphical analysis shown in Figure 4 and Figure 6.
We also included two more dummy variables on the right-hand-side of the regression model. Euro takes into account whether the event happened after the creation of the Euro zone. We expect that there might exist more spill-over effects caused by the event when the country uses the same currency as some neighboring countries, hence the
16
event country could face smaller impact on its abnormal market returns than on the simple market returns. This indicates that, in negative events, the regression coefficients for Euro in the models employing abnormal market returns as the dependent variable might be larger than those in models using simple returns; for positive events previous literature9 does not find significant impact, and for this reason we do not expect particular differences among simple and abnormal returns. Moreover institutional organizations, like the BCE, are very influential, because of their support and control role in the monetary union. Hence event countries in the Euro zone might suffer less from negative impacts on both of its abnormal market return and simple market return. This effect however may be counterbalanced if rating changes are close one to another: in the same way other countries can share the impact of announcements in the event country, the same is true also in the other way round. This is what happened during the Financial Crisis: past months saw more than once group downgrades or watchlist movements in the same day. We use dummy variable Crisis to show if the event happened after the current financial crisis begun, assuming as starting point September 2008. For the above mentioned reason, and for the systematic bearish impact of the crisis, we expect that the coefficient will be in line with the announcement, and particularly significant in case of downgrades.
5.2 Regression results
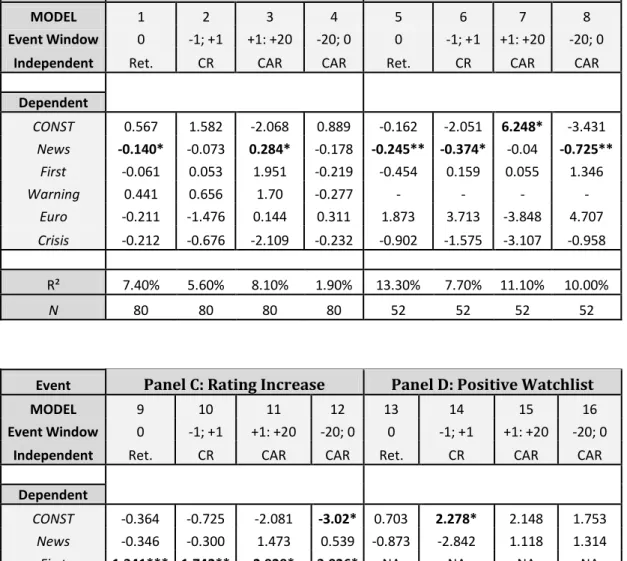
Table 2 exhibits the results we reached. Panel A, B, C and D show the results for the four subsamples of rating decrease, negative watchlist, rating increase and positive watchlist respectively. Before discussing in detail the results in each of these panels, we
9
17
should make a couple of considerations: first, a general trend consistent with conclusions reached in the descriptive analysis pops out at first sight, namely the predominance of positive watchlist-related announcements; then, the predictive power among all the different equations is not particularly high (average R-squared slightly below 15%), and this may imply some limitations for our results.
Panel A focuses on downgrades. The constant γ is almost always positive (though not statically significant), except in the post announcement window: in absence of all the other variables, markets on average negatively react to this kind of news only after the event day. The two variables News and First present the same pattern: negative coefficients in all the windows, except [+1; +20] (First is also positive in Model 2, however we consider it negligible due its particularly high p-value). This is in line with our earlier observation in Figure 3 on how the impact related to such an announcement is only negative in the short term, and immediately followed by a positive recovering trend. This means a positive relation with how unexpected the news is, only serves to counterbalance previous movements. Moreover, News coefficients can rely on statistical significance in Model 1 (p-value of 7.4%) and 3 (p-value of 9.2%). In line with our expectations, Warning presents a large positive coefficient in [+1; +20], however this specific test for the overestimate hypothesis does not reach statistical significance, as already happened for downgrades in descriptive analysis. Moving to the other dummy variables, consistent with our expectations, Euro has positive slopes in case of abnormal returns. However, it has negative coefficients in the short-term windows, based on simple returns. This temporary effect may be related to the absence of the benchmark from the event study: since simple returns may reflect also cross-country effects, belonging to a bigger institution can amplify the downgrading effect, and offset the
18
impact previously described. Instead, the magnifying argument occurs in all the Crisis coefficients, consistently with our expectations.
Panel B enters the discussion about negative watchlisting. If we look at γ values, they are the opposite of the ones from Panel A, which means we can use the opposite explanation: since the markets quickly recover from the news, CRAs’ action is more likely to be a reaction to previous negative trends. Focusing on surprise variables, we reached consistent results in case of News, with always negative coefficients, significant at 5% (Model 5 and 8) and 10% (Model 6). Instead, First shows coefficients mostly not in line with our expectations, with the only exception of Model 5; however, particularly high p-values do not allows us to be confident this variable would have such impact. Moving to the last two variables, we reached results in line with our expectations for both Euro (except Model 7) and Crisis, which means positive coefficients for the former, and negative coefficients for the latter.
So far we dealt with negative announcements; Panel C moves the topic to positive news, precisely upgrades. The most surprising result comes from the constant, which is negative for all the event windows, and also significant at 10% in Model 12. This means that, according to this model, all the positive impact of upgrades, if any, is incorporated in surprise variables. First exactly behaves according to this proposition: its positive coefficients are significant at 1% (Model 9), 5% (Model 10) and 10% (Model 11 and 12). Instead, News somehow differentiates itself, since its coefficients are positive for Model 11 and 12, but negative for Model 9 and 10. A possible explanation concerns the timing of the impact: the temporary negative relation may be due to price stickiness10; namely, the amplified positive movements 20 days before and after the event would
10
The same argument used by Ferri et al. (1999), even if it focused more on the relation between ratings and crisis periods.
19
require an even higher peak immediately close to day 0, but the line stays flatter because prices already reached an adequate level. The third surprise variable, Warning, allows us to observe one of the most important results obtained in this paper, which is the negative relation of market anticipation (namely, positive watchlisting) over abnormal returns after an upgrade announcement. The coefficients are always negative, and also significant in the event day at 10%, and in the post announcement phase at 1%. Notice this last coefficient is not only supported by significance, but represents also a very large impact (-6.725). Next, Euro and Crisis present coefficients with a different sign than what expected; the latter may be due to widespread fear for the future within the markets, and a rising distrust in CRAs’ actions.
Last, Panel 4 deals with positive watchlisting. First thing to notice, this set of regressions presents only variables News and Euro. As far as concerning First, none of the observations occurred within three months after another CRAs’ action, and for this reason the model considers it as a constant. For Crisis, similarly, only two observations happened after 2008, and because of this low number and partial correlation with Euro, the variable did not allow us to gather insights without mistakenly altering the model. Following the same path of the other Panels, we find the constant γ: in line with our expectations, it is always positive, and significant at 10% in Model 14. The variable News confirms the coefficients previously discussed for upgrades, already related to the hypothesis of price stickiness to a certain threshold. Moving to the remaining variable, Euro is in line with our forecasts, and in Model 14 the coefficient of -4.745 is also significant at 5% level.
20 6. Conclusions
This paper tries to uncover what kind of role the CRAs have within financial markets, in order to foster the discussion concerning how should institutions solve a situation that, once again during current crisis, has shown all of its weaknesses. First of all, in line with many other academic studies, our analysis confirmed that in many cases stock market returns are subject to direct relation to these announcements, and in particular markets are more affected by the possibility in the short run of a rating variation, than the moment in which this news becomes concrete. This generates counterbalancing trends, acting as a source of both instability in the economy and discretional power in the hands of CRAs. Moreover, how widespread the impact becomes, is directly related to the surprise element within the announcement. One can argue this implies that these agencies are considered bearer of private information, new to the markets’ knowledge. Both these conclusions bring an important question: to what extent should few organizations be entitled of such an incredible influence over delicate topics, able to define a country’s future?
References
Alfonso, Antonio. 2003. “Understanding the Determinants of Sovereign Debt Rating: Evidence for the two leading Agencies”. Journal of Economics and Finance. 27 (1): 56-74
Arezki, Rabah; Candelon, Bertrand; Sy, Amadou N.R. 2011. “Sovereign Rating News and Financial Markets Spillovers: Evidence from the European Debt Crisis”. Working Paper WP/11/68, International Monetary Fund.
Brooks, R.; Faff, R.W.; Hillier, H.; Hillier, J. 2001. “The National Market Impact of Sovereign Rating Changes”. Working Paper by the University of Strathclyde - Department of Accounting & Finance.
21
Brutti, Filippo; Sauré, Philip. 2011. “Transmission of the Sovereign Risk in the Euro Crisis”. Working Paper 12.01 by the Study Center Gerzensee – Foundation of the Swiss National Bank.
Cantor, Richard; Packer, Franck. 1996. “Determinants and Impact of Sovereign Credit Rating”. FRBNY Economic Policy Review. October 1996.
Ferreira, Miguel A.; Gama, Paulo M. 2007. “Does sovereign debt rating news spill over to international stock markets?”. Journal of Banking & Finance 31: 3162-3182 Ferri, G.; Liu, L.; Stiglitz, J.E. 1999. “The Procyclical Role of Rating Agencies:
Evidence from the East Asian Crisis”. Economic Notes 28: 335-355
Gande, Amar; Parsley, David C. 2005. “News spillovers in the sovereign debt market”. Journal of Financial Economics 75: 691-734
Hand, John R.M.; Holthausen, Robert W.; Leftwich, Richard W. 1992. “The Effect of Bond Rating Agency Announcements on Bond and Stock Prices”. The Journal of Finance. 47 (2): 733-752
Kaminsky, Graciela; Schmukler, Sergio L. 2002. “Emerging Market Instability: Do Sovereign Ratings Affect Country Risk and Stock Returns?”. The World Bank Economic Review. 16 (2): 171-195
Kiff, John; Nomak, Sylwia; Schumacher, Liliana. 2012. “Are Rating Agencies Powerful? An Investigation into the Impact and Accuracy of Sovereign Rating.” Working Paper WP/12/23, International Monetary Fund.
Michaedelis, Alexander; Milidonis, Andreas; Nishiotis, George; Papakyriacou, Panayiotis. 2012. “Sovereign Debt Rating Changes and the Stock Market”. Discussion Paper No. 8743. Center for Economic Policy Research.
Mora, Nada. 2006. “Sovereign credit ratings: Guilty beyond reasonable doubt?”. Journal of Banking & Finance. 30: 2041-2062
Oakley, David. 2011. “France Furious Over S&P Downgrade Error”. Financial Times November 10th, 2011. Link: http://www.ft.com/intl/cms/s/0/6ccfa48c-0bbd-11e1-9310-00144feabdc0.html#axzz1dbBBxUSH
Reinhart, Carmen M. 2002. “Default, Currency Crises and Sovereign Credit Ratings”. National Bureau of Economic Research. Working Paper 8738.
Steiner, Manfred; Heinke, Volker G. 2001. “Event Study Concerning International Bond Price Effects of Credit Rating Actions”. International Journal of Finance and Economics. 6: 139-157
22 Tables & Graphs:
23
Table 2 – Regression Results
Event Panel A: Rating Decrease Panel B: Negative Watchlist
MODEL 1 2 3 4 5 6 7 8
Event Window 0 -1; +1 +1: +20 -20; 0 0 -1; +1 +1: +20 -20; 0
Independent Ret. CR CAR CAR Ret. CR CAR CAR
Dependent CONST 0.567 1.582 -2.068 0.889 -0.162 -2.051 6.248* -3.431 News -0.140* -0.073 0.284* -0.178 -0.245** -0.374* -0.04 -0.725** First -0.061 0.053 1.951 -0.219 -0.454 0.159 0.055 1.346 Warning 0.441 0.656 1.70 -0.277 - - - - Euro -0.211 -1.476 0.144 0.311 1.873 3.713 -3.848 4.707 Crisis -0.212 -0.676 -2.109 -0.232 -0.902 -1.575 -3.107 -0.958 R² 7.40% 5.60% 8.10% 1.90% 13.30% 7.70% 11.10% 10.00% N 80 80 80 80 52 52 52 52
Event Panel C: Rating Increase Panel D: Positive Watchlist
MODEL 9 10 11 12 13 14 15 16
Event Window 0 -1; +1 +1: +20 -20; 0 0 -1; +1 +1: +20 -20; 0
Independent Ret. CR CAR CAR Ret. CR CAR CAR
Dependent CONST -0.364 -0.725 -2.081 -3.02* 0.703 2.278* 2.148 1.753 News -0.346 -0.300 1.473 0.539 -0.873 -2.842 1.118 1.314 First 1.341*** 1.742** 2.929* 3.026* NA NA NA NA Warning -0.929* -1.061 -6.795*** 0.238 - - - - Euro 0.362 0.125 -2.758* 0.568 -0.665 -4.745** -2.48 -3.702 Crisis -0.340 -0.123 -3.337 -1.394 NA NA NA NA R² 23.10% 12.20% 29.50% 7.30% 8.20% 43.20% 14.00% 14.50% N 62 62 62 62 13 13 13 13
Ret.: Simple Daily Return - CR: Cumulative Return - CAR: Cumulative Abnormal Return News: Number of Bloomberg News - First: First Mover Dummy - Warning: Preceded by Watchlist
Euro: European Union Creation Dummy - Crisis: Financial Crisis Dummy *: significant at 10% - **: significant at 5% - ***: significant at 1%
24
Figure 1 – Cumulative Returns in [-20; +20]: Negative Announcements
Figure 2 – Cumulative Returns in [-20; +20]: Positive Announcements
Figure 3 – CAR in [-20; +20]: All Negative Announcements
-4.00% -3.00% -2.00% -1.00% 0.00% 1.00% 2.00% 3.00% -20-17-14-11 -8 -5 -2 1 4 7 10 13 16 19 C A R Day
Downgrades with Warning Downgrades w/o Warning Negative Watchlist -1.00% 0.00% 1.00% 2.00% 3.00% 4.00% 5.00% 6.00% 7.00% 8.00% 9.00% -20-17-14-11 -8 -5 -2 1 4 7 10 13 16 19 C A R Day
Upgrades with Warning Upgrades w/o Warning Positive Watchlist -0.80% -0.70% -0.60% -0.50% -0.40% -0.30% -0.20% -0.10% 0.00% -25 -5 15 C A R Day Negative Announcements
25
Figure 4 – CAR in [-20; +20]: Downgrades with and without previous warning, and Negative Watchlist
Figure 5 – CAR in [-20; +20]: All Positive Announcements
Figure 6 – CAR in [-20; +20]: Upgrades with and without previous warning, and Positive Watchlist -2.50% -2.00% -1.50% -1.00% -0.50% 0.00% 0.50% 1.00% -20 -17 -14 -11 -8 -5 -2 1 4 7 10 13 16 19 C A R Day Negative Watchlist Downgrades with Warning Downgrades w/o Warning
-1.50% -1.00% -0.50% 0.00% 0.50% 1.00% -25 -15 -5 5 15 25 C A R Day Positive Announcements -7.00% -5.00% -3.00% -1.00% 1.00% 3.00% -25 -5 15 C A R Day Upgrades w/o Warning Upgrades with Warning Positive Watchlist
26
APPENDIX: DATA GENERATION – ABNORMAL RETURNS
To calculate the impact of rating variation in terms of abnormal returns, first of all a benchmark is required. The benchmark in this study is represented by a time series regression of the MSCI index of each country of interest, over the European MSCI index, performed on the 250 trading days before the event. The equation can be easily identified as the following:
𝑀𝑆𝐶𝐼𝑖= 𝛼𝑖+ 𝛽𝑖∗ 𝑀𝑆𝐶𝐼𝐸𝑈+ 𝜀𝑖
The event study methodology requires that the outcomes of this regression, namely the slope and the intercept, should be used to compare the performance of the countries’ indexes, within the event window, to the previous performance. In this way it becomes possible to analyze if it was influenced somehow by the event. More precisely, abnormal returns are calculated according to the formula:
𝐴𝑅𝑖= 𝑀𝑆𝐶𝐼𝑖− 𝛼̂ − 𝛽𝑖 ̂ ∗ 𝑀𝑆𝐶𝐼𝑖 𝐸𝑈
Starting from abnormal returns, the analysis briefly includes some descriptive statistic measures, which are then used to statistically test the significance of the results. We defined the test statistic as:
𝑍 = √𝑁 ∗𝐴𝐴𝑅𝑡
𝑠𝑡 ~ 𝑡𝑁−1
The average abnormal return 𝐴𝐴𝑅𝑡 is the arithmetic average of all the abnormal returns over the N number of events (in day t), while the volatility estimator 𝑠𝑡 takes in account
we consider part of the population as representative for the overall sample. This test is directly related to the assumption that abnormal returns follow a normal distribution with mean zero and variance 𝜎2.
A similar rationale was extended to cumulative abnormal returns (CAR), defined as the sum of abnormal returns in a specific time period. In this case the test statistic becomes:
𝛷 = √𝑁 ∗𝐶𝐴𝐴𝑅[𝑡1;𝑡2]
𝑠 ~ 𝑁(0,1)
Again, it uses the arithmetic average of all cumulative abnormal returns between a window [𝑡1; 𝑡2] and a volatility estimator s, with N-1 degrees of freedom.
27
APPENDIX: Daily Average Abnormal Returns (AAR) and P-Values [*: significant at 10% - **: significant at 5% - ***: significant at 1%]
NEGATIVE VARIATION POSITIVE VARIATION
Day DECREASE NEG.WATCHLIST ALL INCREASE POS.WATCHLIST ALL
-20
Ret. P-value Ret. P-value Ret. P-value Ret. P-value Ret. P-value Ret. P-value
-0.17% 0.14 0.03% 0.42 -0.09% 0.21 -0.07% 0.35 0.18% 0.14 -0.04% 0.41 -19 0.13% 0.22 -0.02% 0.47 0.07% 0.28 0.01% 0.47 0.05% 0.40 0.02% 0.44 -18 -0.09% 0.29 -0.30%** 0.03 -0.17%* 0.07 0.04% 0.37 0.08% 0.36 0.05% 0.33 -17 -0.05% 0.32 -0.25% 0.10 -0.13% 0.11 0.12% 0.18 0.34% 0.22 0.16% 0.11 -16 0.05% 0.38 -0.12% 0.17 -0.01% 0.46 0.02% 0.45 0.20% 0.23 0.04% 0.36 -15 0.17% 0.14 -0.33%** 0.05 -0.01% 0.46 -0.05% 0.38 -0.15% 0.28 -0.06% 0.32 -14 0.00% 0.49 0.19% 0.15 0.07% 0.27 0.04% 0.41 -0.15% 0.30 0.01% 0.48 -13 -0.10% 0.21 0.07% 0.38 -0.04% 0.36 -0.10% 0.18 0.48% 0.12 -0.01% 0.47 -12 -0.03% 0.43 0.25%* 0.07 0.08% 0.27 0.18% 0.12 0.34% 0.17 0.21%* 0.07 -11 0.23%** 0.05 0.08% 0.38 0.17%* 0.08 -0.14% 0.11 -0.07% 0.38 -0.13%* 0.10 -10 0.08% 0.32 -0.08% 0.33 0.02% 0.44 0.02% 0.43 -0.58%** 0.03 -0.07% 0.28 -9 0.09% 0.27 -0.05% 0.40 0.04% 0.36 -0.02% 0.47 -0.24% 0.25 -0.05% 0.38 -8 -0.30%** 0.04 0.02% 0.47 -0.18%* 0.08 0.03% 0.40 0.27%*** 0.01 0.07% 0.25 -7 0.00% 0.50 -0.07% 0.38 -0.03% 0.41 0.00% 0.50 -0.07% 0.39 -0.01% 0.47 -6 -0.11% 0.24 -0.26% 0.11 -0.16%* 0.09 0.06% 0.36 0.12% 0.34 0.07% 0.31 -5 -0.16% 0.17 0.14% 0.23 -0.05% 0.35 0.06% 0.37 0.06% 0.40 0.06% 0.35 -4 0.14% 0.15 0.14% 0.26 0.14% 0.12 0.09% 0.26 -0.03% 0.47 0.07% 0.28 -3 0.02% 0.46 -0.05% 0.39 -0.01% 0.48 0.07% 0.35 0.14% 0.26 0.08% 0.30 -2 -0.04% 0.39 -0.02% 0.47 -0.03% 0.40 -0.15%* 0.10 -0.29%** 0.04 -0.17%** 0.04 -1 -0.06% 0.38 -0.25%* 0.07 -0.13% 0.16 -0.16%* 0.09 0.01% 0.48 -0.13%* 0.10 0 -0.05% 0.39 -0.41%** 0.02 -0.19%* 0.10 0.01% 0.48 0.41% 0.15 0.07% 0.29 1 -0.05% 0.35 -0.18% 0.18 -0.10% 0.19 -0.09% 0.24 -0.59% 0.17 -0.17% 0.12 2 0.39%** 0.02 -0.10% 0.31 0.21%* 0.07 0.01% 0.47 0.04% 0.42 0.02% 0.46 3 -0.14% 0.21 0.05% 0.41 -0.07% 0.31 -0.01% 0.47 0.21% 0.27 0.02% 0.44 4 0.24%* 0.06 -0.02% 0.45 0.14% 0.13 -0.15% 0.11 0.08% 0.37 -0.12% 0.14 5 -0.15% 0.18 0.11% 0.32 -0.06% 0.34 0.21%** 0.05 0.11% 0.29 0.20%** 0.04 6 0.09% 0.29 -0.02% 0.47 0.05% 0.35 -0.18%** 0.05 -0.22% 0.17 -0.19%** 0.03 7 0.18% 0.11 0.10% 0.33 0.15% 0.11 -0.17%* 0.10 -0.38%* 0.06 -0.21%** 0.04 8 0.17% 0.12 -0.02% 0.46 0.10% 0.19 -0.06% 0.32 -0.26% 0.27 -0.09% 0.23 9 0.04% 0.41 -0.15% 0.17 -0.03% 0.38 -0.21% 0.04 0.22% 0.23 -0.14%* 0.10 10 -0.02% 0.45 0.46%*** 0.01 0.16%* 0.09 -0.38%*** 0.00 0.51%** 0.05 -0.24%*** 0.01 11 -0.04% 0.38 -0.02% 0.44 -0.03% 0.37 -0.02% 0.43 0.45%* 0.07 0.05% 0.30 12 -0.15% 0.19 0.01% 0.48 -0.09% 0.25 -0.16% 0.13 -0.41% 0.16 -0.20%* 0.07 13 0.05% 0.35 -0.46%*** 0.01 -0.14%* 0.09 -0.17%* 0.10 -0.15% 0.29 -0.16%* 0.08 14 0.16% 0.14 -0.15% 0.23 0.04% 0.35 -0.12% 0.21 0.08% 0.35 -0.09% 0.25 15 -0.10% 0.22 -0.19% 0.12 -0.13%* 0.09 0.00% 0.50 0.25% 0.13 0.04% 0.38 16 0.06% 0.32 0.37% 0.12 0.18% 0.11 0.01% 0.46 0.27% 0.14 0.05% 0.34 17 -0.21%* 0.06 0.11% 0.28 -0.09% 0.21 -0.21%* 0.07 0.17% 0.23 -0.15% 0.11 18 -0.04% 0.38 -0.04% 0.37 -0.04% 0.33 -0.08% 0.29 -0.15% 0.30 -0.09% 0.24 19 -0.10% 0.24 0.20% 0.25 0.01% 0.47 0.15% 0.13 0.76%** 0.02 0.25%** 0.03 20 -0.30%** 0.03 0.12% 0.29 -0.15% 0.13 0.01% 0.47 0.82%*** 0.00 0.14% 0.18
![Figure 3 – CAR in [-20; +20]: All Negative Announcements](https://thumb-eu.123doks.com/thumbv2/123dok_br/15775643.1076461/24.893.160.530.530.807/figure-car-negative-announcements.webp)
![Figure 4 – CAR in [-20; +20]: Downgrades with and without previous warning, and Negative Watchlist](https://thumb-eu.123doks.com/thumbv2/123dok_br/15775643.1076461/25.893.148.531.215.476/figure-car-downgrades-previous-warning-negative-watchlist.webp)